Transcription
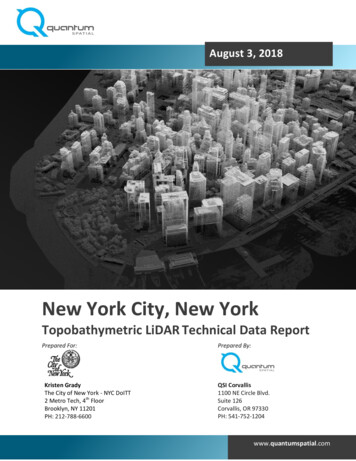
August 3, 2018New York City, New YorkTopobathymetric LiDAR Technical Data ReportPrepared For:Kristen GradyThe City of New York - NYC DoITT2 Metro Tech, 4th FloorBrooklyn, NY 11201PH: 212-788-6600Prepared By:QSI Corvallis1100 NE Circle Blvd.Suite 126Corvallis, OR 97330PH: 541-752-1204www.quantumspatial.com
TABLE OF CONTENTSINTRODUCTION . 1Deliverable Products . 2ACQUISITION . 5Planning . 5Airborne LiDAR Survey . 7Ground Control. 9Base Stations. 9Ground Survey Points (GSPs) . 10Land Cover Class . 10PROCESSING . 13Topographic and Topobathymetric LiDAR Data . 13Boardwalk Removal . 16Bathymetric Refraction . 16Splicing the Topographic and Bathymetric Data . 16Feature Extraction . 18Hydroflattening and Water’s Edge Breaklines. 18Hydro-enforcement . 19Topobathymetric LiDAR-Derived Products . 20Topobathymetric DEMs . 20Intensity Images. 20RESULTS & DISCUSSION . 22Bathymetric LiDAR. 22Mapped Bathymetry. 22LiDAR Point Density . 23First Return Point Density . 23Ground and Bathymetric Bottom Classified Point Densities . 26LiDAR Accuracy Assessments . 29LiDAR Non-Vegetated Vertical Accuracy . 29LiDAR Vegetated Vertical Accuracies. 32LiDAR Relative Vertical Accuracy . 33SELECTED IMAGES. 35GLOSSARY . 37Technical Data Report – New York City LiDAR Project
APPENDIX A - ACCURACY CONTROLS . 38Cover Photo: A view looking northwest over Downtown Manhattan in the New York City LiDAR dataset. The imagewas created from the LiDAR point cloud.
INTRODUCTIONThis photo taken by QSI acquisitionstaff shows a ground professionaltaking bathymetric check points insidethe New York City LiDARTopobathymetric AOI.In May 2017, Quantum Spatial (QSI) was contracted by Applied Geographics to collect topographic andtopobathymetric Light Detection and Ranging (LiDAR) data for the City of New York (NYC) in the springand summer of 2017 for the New York City LiDAR project site in New York. QSI collected and processedtraditional (near infrared wavelength) LiDAR over the topographic AOI, and spliced together NIR andbathymetric LiDAR (green wavelength) for the topobathymetric AOI. Data were collected to helpsupport the City’s many agencies in planning and analysis related to their key initiatives. LiDAR derivedDEMs will be crucial for long-term land use planning and assessing the impacts of sea level rise. NYCParks will be using LiDAR-derived land cover mapping to analyze the need for greening of the city and tohelp support the measurement of tree canopy height and biomass calculations.This report accompanies the delivered topobathymetric LiDAR data and documents contractspecifications, data acquisition procedures, processing methods, and analysis of the final datasetsincluding LiDAR accuracy and density. Acquisition dates and acreage are shown in Table 1, a completelist of contracted deliverables provided to NYC is shown in Table 2, and the project extent is shown inFigure 1.Table 1: Acquisition dates, acreage, and data types collected on the New York City Topographic andTopobathymetric LiDAR siteProject SiteContractedAcresBufferedAcresAcquisition DatesData TypeTopographic AOI197,203208,65505/03/17, 05/04/17, 05/08/17 05/12/17, 05/16/17, 05/17/17NIR LiDAR69,55405/03/17, 05/04/17, 05/09/17 05/12/17, 05/16/17, 05/17/17, 07/04/17- 07/06/17, 07/09/17, 07/10/17,07/12/17, 07/13/17, 07/22/17, 07/26/17Spliced NIR andGreen LiDARTopobathymetricAOI56,611Page 1Technical Data Report – New York City LiDAR Project
Deliverable ProductsTable 2: Products delivered to NYC for the New York City Topographic and Topobathymetric LiDARsitesNew York City LiDAR ProductsProjection: New York State Plane Long IslandHorizontal Datum: NAD83 (2011)Vertical Datum: NAVD88 (GEOID012B)Units: US Survey FeetTopographic LiDARPointsLAS v 1.4 All Classified ReturnsRasters1.0 Foot GeoTiffs (*.tif) Bare Earth Digital Elevation Models (DEM) Hydroflattened Bare Earth Digital Elevation Models Filled Hydroenforced Bare Earth Digital Elevation Models Unfilled Hydroenforced Bare Earth Digital Elevation Models Highest Hit Digital Surface Models (DSM) Intensity ImagesVectorsShapefiles (*.shp) Project Boundary LiDAR Tile Index DEM Tile Index Ground Control Shapes Water’s Edge Breaklines Bridge Breaklines Hydroenforcement LinesTopobathymetric LiDARPointsLAS v 1.4 All Classified ReturnsRasters1.0 Foot GeoTiffs (*.tif) Topobathymetric Bare Earth Digital Elevation Models (DEM) Highest Hit Digital Surface Models (DSM) Intensity ImagesPage 2Technical Data Report – New York City LiDAR Project
VectorsShapefiles (*.shp) Project Boundary LiDAR Tile Index DEM Tile Index Ground Control Shapes Water’s Edge Breaklines (Hydroflattening, Splicing, Low Tide) Bridge Breaklines Bathymetric Coverage ShapeCombined Topographic/Topobathymetric LiDARPointsLAS v 1.4 All Classified Returns Unclassified NIR Swaths Unclassified Green SwathsRasters1.0 Foot GeoTiffs (*.tif) Combined Topographic/Topobathymetric Bare Earth Digital ElevationModels (DEM) Combined Filled Hydroenforced Bare Earth Digital Elevation Models Combined Unfilled Hydroenforced Bare Earth Digital ElevationModels Combined Highest Hit Digital Surface Models (DSM) Combined Intensity ImagesShapefiles (*.shp) Project Boundary LiDAR Tile Index DEM Tile IndexVectors Ground Control Shapes Water’s Edge Breaklines (Hydroflattening, Splicing, Low Tide) Bridge Breaklines Bathymetric Coverage Shape*The data were created in NAD83 (2011), but for GIS purposes are defined as NAD83 as per New York Cityspecifications.Page 3Technical Data Report – New York City LiDAR Project
Figure 1: Location map of the New York City Topographic and Topobathymetric LiDAR site in New YorkPage 4Technical Data Report – New York City LiDAR Project
ACQUISITIONThis photo of QSI’s pilot inside theCessna Caravan 208B was taken byQSI’s sensor operator during thetopobathymetric LiDAR acquisitionover New York City.PlanningIn preparation for data collection, QSI reviewed the project area and developed a specialized flight planto ensure complete coverage of the New York City Topographic and Topobathymetric LiDAR study areaat the target point density of 8.0 points/m2. Acquisition parameters including orientation relative toterrain, flight altitude, pulse rate, scan angle, and ground speed were adapted to optimize flight pathsand flight times while meeting all contract specifications.Factors such as satellite constellation availability and weather windows must be considered during theplanning stage. Any weather hazards or conditions affecting the flights were continuously monitoreddue to their potential impact on the daily success of airborne and ground operations. Logisticalconsiderations including private property access, air space restrictions over the City of New York,building heights, and the need to fly at night were carefully managed.Acquisition was closely coordinated with air traffic control as to not interfere with air traffic from thethree major airports in the region. During the topobathymetric flights, tide levels and water clarityconditions were closely monitored to facilitate the best bathymetric bottom return conditions possible.The client requested that all topobathymetric flights were flown at low-tide.Page 5Technical Data Report – New York City LiDAR Project
This photo taken by QSI acquisition staff displays the clarity conditions within the New York CityTopobathymetric AOI.Page 6Technical Data Report – New York City LiDAR Project
Airborne LiDAR SurveyThe LiDAR surveys were accomplished using Leica ALS80 and Riegl VQ-880-G laser systems mounted in aCessna 402C or Cessna Caravan 208B aircraft. The Riegl VQ-880-G uses a green wavelength (ʎ 532 nm)laser that is capable of collecting high resolution vegetation and topography data, as well as penetratingthe water surface with minimal spectral absorption by water. The recorded waveform enables rangemeasurements for all discernible targets for a given pulse. Both the Leica ALS80 and Riegl VQ-880-Glaser systems can record unlimited range measurements (returns) per pulse. It is not uncommon forsome types of surfaces (e.g., dense vegetation or water) to return fewer pulses to the LiDAR sensor thanthe laser originally emitted. The discrepancy between first return and overall delivered density will varydepending on terrain, land cover, and the prevalence of water bodies. All discernible laser returns wereprocessed for the output dataset. Table 3 summarizes the settings used to yield an average pulsedensity of 8 pulses/m2 over the New York City Topographic and Topobathymetric LiDAR project areas.Table 3: LiDAR specifications and survey settingsLiDAR Survey Settings & SpecificationsSurvey AreaAcquisition DatesAircraft UsedNIR AOITopobathymetric LiDAR AOI05/03/2017 – 05/17/201705/03/2017 – 07/26/2017Cessna 402CCessna 402CCessna Caravan ximum ReturnsResolution/DensityUnlimitedAverage 8 pulses/mUnlimited2Average 8 pulses/mUnlimited2Average 15 pulses/m2Nominal Pulse Spacing0.35 m0.35 m0.26 mSurvey Altitude (AGL)1800 m1800 m450 mSurvey speed145 knots145 knots120 knotsField of View30⁰30⁰40⁰Mirror Scan Rate48 Hz48 Hz80 lines/secTarget Pulse Rate314.8 kHz314.8 kHz245 kHz2.5 ns2.5 ns1.5 nsLaser Pulse FootprintDiameter39.6 cm39.6 cm45 cmCentral Wavelength1064 nm1064 nm532 nmMultiple Pulses in Air(MPiA)Multiple Pulses in Air(MPiA)Multiple Times Around(MTA)22 mrad22 mrad0.7 mrad898 m898 m327.5 m60%60%60%Intensity8-bit (Scaled to 16-bit)8-bit (Scaled to 16-bit)16-bitAccuracyRMSEZ 15 cmRMSEZ 15 cmRMSEZ 15 cmPulse LengthPulse ModeBeam DivergenceSwath WidthSwath OverlapPage 7Technical Data Report – New York City LiDAR Project
All areas were surveyed with an opposing flight line side-lap of 50% ( 100% overlap) in order to reducelaser shadowing and increase surface laser painting. To accurately solve for laser point position(geographic coordinates x, y and z), the positional coordinates of the airborne sensor and the attitude ofthe aircraft were recorded continuously throughout the LiDAR data collection mission. Position of theaircraft was measured twice per second (2 Hz) by an onboard differential GPS unit, and aircraft attitudewas measured 200 times per second (200 Hz) as pitch, roll and yaw (heading) from an onboard inertialmeasurement unit (IMU). To allow for post-processing correction and calibration, aircraft and sensorposition and attitude data are indexed by GPS time.Manhattan at night, photo taken by a QSI sensor operator during the LiDAR acquisition.Page 8Technical Data Report – New York City LiDAR Project
Ground ControlGround control surveys were conducted to support the airborne acquisition. Ground control data wereused to geospatially correct the LiDAR point cloud and used to perform quality assurance checks on finalLiDAR data products. In addition, Continuously Operating Reference Stations (CORS) from the New YorkState Spatial Reference Network (NYSNet) were used to geospatially correct the aircraft positionalcoordinate data and as base stations for GSP collection. All ground survey work to support thetopobathymetric LiDAR acquisition was conducted during the NIR LiDAR collection window.Base StationsCORS base stations from the NYSNet were utilized as static base stations for the New York CityTopographic and Topobathymetric LiDAR acquisition. The spatial configuration of NYSNet stations andNGS monumentation provided redundant control within 13 nautical miles of the mission areas for LiDARflights. Base stations and monumentation were also used for the collection of ground survey pointsusing real time kinematic (RTK), post processed kinematic (PPK), and fast static (FS) survey techniques.CORS and monument locations were selected with consideration for satellite visibility, field crew safety,and optimal location for GSP coverage. QSI utilized ten existing CORS stations and one NGS Monumentfor the New York City Topographic and Topobathymetric LiDAR project.Table 4: NYSNet Real Team Network stations used for the New York City Topographic andTopobathymetric LiDAR acquisition. Coordinates are on the NAD83 (2011) datum, epoch 2010.00CORS IDLatitudeLongitudeEllipsoid (meters)KP1440 57' 41.92906"-74 07' 52.69137"7.391LAMT41 00' 16.23300"-73 54' 32.05717"90.181NYBK40 42' 12.32084"-73 58' 44.25877"-15.219NYBP40 42' 03.81683"-74 00' 51.54905"-14.452NYBR40 41' 19.14463"-74 00' 04.57867"-19.038NYJM40 39' 46.05517"-73 48' 25.48867"-12.601NYOB40 33' 05.55502"-74 06' 59.66700"-11.936NYQN40 43' 10.26182"-73 43' 48.26660"-0.403NYVH41 04' 56.22098"-73 49' 04.12567"63.296ROG 140 38' 21.40078"-74 07' 14.42731"-13.631Table 5: NGS Monument utilized for the New York City Topographic and Topobathymetric LiDARacquisition. Coordinates are on the NAD83 (2011) datum, epoch 2010.00Monument IDLatitudeLongitudeEllipsoid (meters)KU138340 35' 03.58770"-73 07' 50.32522"-29.270Page 9Technical Data Report – New York City LiDAR Project
To correct the continuously recorded onboard measurements of the aircraft position, QSI utilized staticGlobal Navigation Satellite System (GNSS) data collected at 1 Hz recording frequency by the basestation. During post-processing, the static GPS data were triangulated with nearby ContinuouslyOperating Reference Stations (CORS) using the Online Positioning User Service (OPUS) to verify andupdate record positions as needed to align with the National Spatial Reference System (NSRS).Ground Survey Points (GSPs)Ground survey points were collected using real time kinematic, post-processed kinematic (PPK), andfast-static (FS) survey techniques. For ground survey points collected on May 21, 2017, a Trimble R7base unit was positioned at a nearby monument to broadcast a kinematic correction to a roving TrimbleR8 GNSS or R10 receiver. All other ground survey points were collected using the Real-Time Network toapply kinematic corrections to roving receivers. All GSP measurements were made during periods with aPosition Dilution of Precision (PDOP) of 3.0 with at least six satellites in view of the stationary androving receivers. When collecting RTK and PPK data, the rover records data while stationary for fiveseconds, then calculates the pseudorange position using at least three one-second epochs. FS surveysrecord observations for up to fifteen minutes on each GSP in order to support longer baselines for postprocessing. Relative errors for any GSP position must be less than 1.5 cm horizontal and 2.0 cm verticalin order to be accepted. See Table 6 for Trimble unit specifications.GSPs were collected in areas where good satellite visibility was achieved on paved roads and other hardsurfaces such as gravel or packed dirt roads. GSP measurements were not taken on highly reflectivesurfaces such as center line stripes or lane markings on roads due to the increased noise seen in thelaser returns over these surfaces. GSPs were collected within as many flightlines as possible; howeverthe distribution of GSPs depended on ground access constraints and monument locations and may notbe equitably distributed throughout the study area (Figure 2).Table 6: Trimble equipment identificationReceiver ModelAntennaOPUS Antenna IDUseTrimble R7 GNSSZephyr GNSS GeodeticModel 2 RoHSTRM57971.00Static*Trimble R8Integrated Antenna R8Model 2TRM R8 GNSSRoverTrimble R10Integrated AntennaR10TRMR10Rover*Utilized on 5/21/17 only, all other GSPs collected using Real Time Network correctionsLand Cover ClassIn addition to ground survey points, land cover class check points were collected throughout the studyarea to evaluate vertical accuracy. Vertical accuracy statistics were calculated for all land cover types toassess confidence in the LiDAR derived ground models across land cover classes (Table 7, see LiDARAccuracy Assessments, page 29).Page 10Technical Data Report – New York City LiDAR Project
Table 7: Land Cover Types and DescriptionsLand covertypeLand cover codeExampleDescriptionAccuracyAssessment TypeVVATall GrassTALL GRASSHerbaceousgrasslands inadvanced stagesof growthShrublandSHRUBAreasdominated byshrubsVVAForestFORESTEDForested areasdominated bydeciduousspeciesVVABareEarth/UrbanBARE, URBANAreas of bareearth surface inan urban settingNVAPage 11Technical Data Report – New York City LiDAR Project
Figure 2: Ground survey location mapPage 12Technical Data Report – New York City LiDAR Project
PROCESSINGThis LiDAR cross section shows the New YorkCity point cloud colored by point classification.Topographic and Topobathymetric LiDAR DataUpon completion of data acquisition, QSI processing staff initiated a suite of automated and manualtechniques to process the data into the requested deliverables. Processing tasks included GPS controlcomputations, smoothed best estimate trajectory (SBET) calculations, kinematic corrections, calculationof laser point position, sensor and data calibration for optimal relative and absolute accuracy, and LiDARpoint classification (Table 8).For the topobathymetric AOI, Riegl’s RiProcess software was used to facilitate bathymetric returnprocessing. Once bathymetric points were differentiated, they were spatially corrected for refractionthrough the water column based on the angle of incidence of the laser. QSI refracted water columnpoints using QSI’s proprietary LAS processing software, LAS Monkey. The resulting point cloud datawere classified using both manual and automated techniques. Processing methodologies were tailoredfor the landscape. Brief descriptions of these tasks are shown in Table 9.Page 13Technical Data Report – New York City LiDAR Project
Table 8: ASPRS LAS classification standards applied to the New York City Topographic andTopobathymetric LiDAR datasetClassificationNumberClassification Name1Default/UnclassifiedLaser returns that are not included in the groundclass, composed of vegetation and anthropogenicfeatures1WODefault/Unclassified –Withheld OverlapLaser returns that are deemed not necessary toform a complete single, non-overlapped, gap freecoverage with respect to adjacent swaths2GroundLaser returns that are determined to be groundusing automated and manual cleaning algorithmsClassification Description7WNoise - WithheldLaser returns that are often associated with birds,scattering from reflective surfaces, or artificialpoints below the ground surface9WaterLaser returns that are determined to be waterusing automated and manual cleaning algorithms17BridgeBridge decks25Subway StairsSubway Stairs40Bathymetric BottomRefracted Riegl sensor returns that fall within thewater’s edge breakline which characterize thesubmerged topography.41Water SurfaceGreen laser returns that are determined to bewater surface points using automated and manualcleaning algorithms.45Water ColumnRefracted Riegl sensor returns that are determinedto be water using automated and manual cleaningalgorithms.AOITopographic andTopobathymetricTopobathymetricOnlyPage 14Technical Data Report – New York City LiDAR Project
Table 9: LiDAR processing workflowLiDAR Processing StepResolve kinematic corrections for aircraft position data using kinematicaircraft GPS and static ground GPS data. Develop a smoothed bestestimate of trajectory (SBET) file that blends post-processed aircraftposition with sensor head position and attitude recorded throughout thesurvey.Calculate laser point position by associating SBET position to each laserpoint return time, scan angle, intensity, etc. Create raw laser point clouddata for the entire survey in *.las (ASPRS v. 1.4) format. Convert data toorthometric elevations by applying a geoid correction.Import raw laser points into manageable blocks to perform manualrelative accuracy calibration and filter erroneous points. Classify groundpoints for individual flight lines.Using ground classified points per each flight line, test the relativeaccuracy. Perform automated line-to-line calibrations for system attitudeparameters (pitch, roll, heading), mirror flex (scale) and GPS/IMU drift.Calculate calibrations on ground classified points from paired flight linesand apply results to all points in a flight line. Use every flight line forrelative accuracy calibration.Apply refraction correction to all subsurface returns.Classify resulting data to ground and other client designated ASPRSclassifications (Table 8). Assess statistical absolute accuracy via directcomparisons of ground classified points to ground control survey data.Generate bare earth models as triangulated surfaces. Generate highest hitmodels as a surface expression of all classified points. Export all surfacemodels as GeoTIFF format at a 1 foot pixel resolution.Software UsedWaypoint Inertial Explorer v.8.7POSPac MMS v.8.0RiProcess v1.8.2Waypoint Inertial Explorer v.8.6Leica Cloudpro v. 1.2.2TerraMatch v.17TerraScan v.17TerraMatch v.17RiProcess v1.8.2LAS Monkey 2.3 (QSI proprietarysoftware)TerraScan v.17TerraModeler v.17TerraScan v.17TerraModeler v.17ArcMap v. 10.2.2ArcMap v. 10.3.1Export intensity images as GeoTIFFs at a 1 foot pixel resolution.Las Product Creator 3.0 (QSIproprietary software)Page 15Technical Data Report – New York City LiDAR Project
Boardwalk RemovalAfter deliberating with NYC, it was decided that wooden and concrete boardwalks which are known tobe on pylons and separation is clearly visible, were to be removed from the bare earth models.Triangulation due to interpolation will be seen in these areas. (Figure 3)Figure 3: Boardwalk RemovalBathymetric RefractionThe water surface models used for refraction are generated using elevation information derived fromthe NIR and Green channels to inform where the water surface level is located, and then water surfacepoints are classified for both the forward and reverse look directions. Points are filtered and edited toobtain the most accurate representation of the water surface and are used to create a water surfacemodel for each flight line and look direction. Water surface classification and modeling is processed oneach flight line to accommodate water level changes due to tide and temporal changes in water surface.Each look direction (forward and reverse) are modeled separately to correctly model short durationtime dependent surface changes (e.g. waves) that change between the times that each look directionrecords a unique location. The water surface model created is raster based with an associated surfacenormal vector to obtain the most accurate angle of incidence during refraction. Once an accurate watersurface model is created, the refraction processing is done using LasMonkey, QSI’s proprietary software.Splicing the Topographic and Bathymetric DataThe Topobathymetric AOI was created using data from both the Topographic NIR LiDAR flightlines andthe topobathymetric Green LiDAR flightlines. Water’s edge breaklines were used to delineate the areawhere bathymetric (green) data would be inserted (spliced) into the NIR topographic dataset. Using thewater’s edge breakline as the delineator, NIR data falling within the breaklines was removed, andreplaced with green sensor data. Because the NIR and green LiDAR flights took place between May ofPage 16Technical Data Report – New York City LiDAR Project
2017, and July of 2017, temporal differences between datasets did necessitate additional interpretationand data manipulation at the splicing boundary (Figure 4 and Figure 5). Steps were taken to minimizethe differences and provide the smoothest bare earth models as possible. The main goal was to preservedata that was under water at the time of the NIR acquisition but exposed as dry land or validbathymetric bottom during the topobathymetric acquisition.Figure 4: This image of the topobathymetric DEM labels the locations of the Green LiDAR and NIRLiDAR and provides an example of temporal offsets that may be seenSplicingbreaklinelocationFigure 5: This image shows a three-foot cross-section of spliced NIR and Green LiDAR within the pointcloud. The top image is colored by scanner (NIR or Green) and the bottom image is colored by pointclassificationPage 17Technical Data Report – New York City LiDAR Project
Feature ExtractionHydroflattening and Water’s Edge BreaklinesThe tidal areas surrounding the New York City LiDAR Topographic AOI and other water bodies within theproject area were flattened to a consistent water level. Bodies of water that were flattened includelakes and other closed water bodies with a surface area greater than 0.25 acres, all streams and riversthat are nominally wider than 20 feet, all tidal waters bordering the project, and select smaller bodies ofwater as feasible. The hydroflattening process eliminates artifacts in the digital terrain model caused byboth increased variability in ranges or dropouts in laser returns due to the low reflectivity of water.Hydroflattening of closed water bodies was performed through a combination of automated andmanual detection and adjustment techniques designed to identify water boundaries and water levels.Boundary polygons were developed using an algorithm which weights LiDAR-derived slopes, intensities,and return densities to detect the water’s edge. The water edges were then manually reviewed andedited as necessary.Once polygons were developed the initial ground classified points falling within water polygons werereclassified as water points to omit them from the final ground model. Elevations were then obtainedfrom the filtered LiDAR returns to create the final breaklines. Lakes were assigned a consistent elevationfor an entire polygon while rivers were assigned consistent elevations on opposing banks and smoothedto ensure downstream flow through the entire river channel.Water boundary breaklines were then incorporated into the hydroflattened DEM by enforcing triangleedges (adjacent to the breakline) to the elevation values of the breakline. This implementationcorrected interpolation along the hard edge. Water surfaces were obtained from a TIN of the 3D wateredge breaklines resulting in the final hydroflattened model (Figure 6).Figure 6: Example of hydroflattening
www.quantumspatial.com August 3, 2018 New York City, New York Topobathymetric LiDAR Technical Data Report Prepared For: Prepared By: Kristen Grady The City of New York - NYC DoITT

