Transcription
User's GuideSystem Monitor - PerformanceMonitoring Services 5.5
PrefaceSystem Monitor - Performance Monitoring Services 5.5 (hereafter referred to as "System Monitor - PerformanceMonitoring Services") is a software program that provides a simple means of monitoring the performance ofmultiple machines. This manual explains how to use System Monitor - Performance Monitoring Services.This manual is organized as follows.Chapter12345678910TitleFunction OverviewConfiguration settingBasic OperationsCollecting Performance DataDisplaying PerformanceStatusThreshold Monitoring andthe Notification FunctionManagement ofPerformance DataCommand-Line InterfaceTroubleshootingNotesContentThe functions and features of System Monitor - PerformanceMonitoring ServicesHow to make configuration settingsStartup methods and basic GUI operationsHow to make settings relating to collecting performance dataHow to make settings relating to displaying performance statusHow to monitor thresholds for performance data and makesettings for the notification functionHow to manage performance dataHow to use command-line interfaceErrors and how to handle themVarious notes and issuesFirst edition, January 200421st edition, August 2014Notes(1) No part of this document may be reproduced in any form without the prior written permission of NECCorporation.(2) The contents of this document may be revised without prior notice.(3) All efforts have been made to ensure the accuracy of all information in this document. If you notice any partunclear, incorrect, or omitted in the document, contact your authorized NEC sales representative.(4) NEC assumes no liability for damages arising from the use of this product, nor any liability for incidental orconsequential damages arising from the use of this document regardless of (3)Trademarks "Windows", "Hyper-V", "Microsoft SQL Server" and "Microsoft SQL Server 2012 Express Edition" areregistered trademarks or trademarks of Microsoft Corporation, U.S. in the United States and othercountries. "Linux" is a registered trademark or trademark of Linus Torvalds in the United States and other countries. "Red Hat" is a registered trademark or trademark of Red Hat, Inc. in the United States and other countries. "SUSE" is a trademark of Novel, Inc. "VMware" is a registered trademark or trademark of VMware, Inc. Citrix XenServer is a registered trademark or trademark of Citrix Systems, Inc. Other product names that appear in this document may be registered trademarks or trademarks of their
respective owners.This product includes icons from the Silk Icons set version 1.3 by Mark James licensed under a CreativeCommons Attribution 2.5 License.http://www.famfamfam.com/This product includes Granados provided by Routrek Networks, Inc under the following license:Copyright (c) 2003 Routrek Networks, Inc.All Rights Reserved.Copyright (c) 2002 Chew Keong TANRedistribution and use in source and binary forms, with or without modification, are permitted providedthat the following conditions are met:1. Redistributions of source code must retain the above copyright notice, this list of conditions and thefollowing disclaimer.2. Redistributions in binary form must reproduce the above copyright notice, this list of conditions and thefollowing disclaimer in the documentation and/or other materials provided with the distribution.3. The end-user documentation included with the redistribution, if any, must include the followingacknowledgment:"This product includes software developed by Routrek Networks, Inc."Alternately, this acknowledgment may appear in the software itself,if and wherever such third-party acknowledgments normally appear.4. The names "Routrek Networks" or "Routrek" must not be used to endorse or promote products derivedfrom this software without prior written permission. For written permission, please contactinfo@routrek.co.jp.5. Products derived from this software may not be called "Granados", appear in their name, without priorwritten permission of the Routrek Networks, Inc.THIS SOFTWARE IS PROVIDED AS IS'' AND ANY EXPRESSED OR IMPLIED WARRANTIES,INCLUDING, BUT NOT LIMITED TO, THE IMPLIED WARRANTIES OF MERCHANTABILITY ANDFITNESS FOR A PARTICULAR PURPOSE ARE DISCLAIMED.IN NO EVENT SHALL ROUTREKNETWORKS, INC. OR ITS CONTRIBUTORS BE LIABLE FOR ANY DIRECT, INDIRECT,INCIDENTAL, SPECIAL, EXEMPLARY, OR CONSEQUENTIAL DAMAGES (INCLUDING, BUT NOTLIMITED TO, PROCUREMENT OF SUBSTITUTE GOODS OR SERVICES; LOSS OF USE, DATA, ORPROFITS; OR BUSINESS INTERRUPTION) HOWEVER CAUSED AND ON ANY THEORY OF
LIABILITY, WHETHER IN CONTRACT, STRICT LIABILITY, OR TORT (INCLUDING NEGLIGENCEOR OTHERWISE) ARISING IN ANY WAY OUT OF THE USE OF THIS SOFTWARE, EVEN IFADVISED OF THE POSSIBILITY OF SUCH DAMAGE.Copyright (c)NEC Corporation 2004,2014This document cannot be changed or copied without permission from NEC.
Table of ContentsCHAPTER 1 FUNCTIONS . 11.1FUNCTION OVERVIEW OF SYSTEM MONITOR - PERFORMANCE MONITORING SERVICES . 11.2BASIC CONFIGURATION OF SYSTEM MONITOR - PERFORMANCE MONITORING SERVICES . 21.3COLLECTED PERFORMANCE DATA . 71.4SUMMARY DATA . 211.5DATA MANAGEMENT . 221.6GROUPS. 231.7CONNECTING TO MONITORED MACHINES . 241.8DISPLAYING PERFORMANCE STATUS AND CSV FILE OUTPUT . 321.9THRESHOLD MONITORING AND THE NOTIFICATION FUNCTION . 391.10THE SYSTEMPROVISIONING LINKAGE FUNCTION . 421.11COMMAND-LINE INTERFACE. 66CHAPTER 2 CONFIGURATION SETTINGS. 682.1STARTING THE PERFORMANCE MONITORING SERVICE . 682.2REGISTERING THE MANAGEMENT SERVER . 692.3CONNECTION SETTINGS TO MONITORED MACHINES . 702.4CONNECTION SETTINGS TO THE MANAGEMENT CONSOLE . 712.5THE EXECUTION ACCOUNT FOR THE PERFORMANCE MONITORING SERVICE . 742.6SYSTEMPROVISIONING CONNECTION SETTINGS. 782.7LOG SETTINGS . 80CHAPTER 3 BASIC OPERATIONS . 813.1STARTING THE MANAGEMENT CONSOLE AND CONNECTING TO THE MANAGEMENT SERVER . 813.2THE MAIN WINDOW . 85CHAPTER 4 COLLECTING PERFORMANCE DATA . 914.1SPECIFICATIONS FOR MONITORED MACHINES. 914.2SPECIFICATIONS FOR THE PERFORMANCE DATA TO BE COLLECTED . 1044.3PAUSING AND RESTARTING THE COLLECTING OF PERFORMANCE DATA . 1184.4CHECKING THE COLLECTING STATUS FOR PERFORMANCE DATA . 119CHAPTER 5 PERFORMANCE STATUS DISPLAY AND FILE OUTPUT . 1225.1DISPLAYING PERFORMANCE GRAPHS . 1225.2SAVING PERFORMANCE STATUS DISPLAY SPECIFICATIONS . 1345.3FILE OUTPUT . 135CHAPTER 6 THRESHOLD MONITORING AND NOTIFICATION . 1376.1CONFIGURING THRESHOLD MONITORING . 137
CHAPTER 7 MANAGEMENT OF PERFORMANCE DATA . 1477.1DATA MANAGEMENT TOOL . 1477.2DATABASE SIZE MONITORING . 150CHAPTER 8 COMMAND-LINE INTERFACE . 1528.1SSC-PERF COMMAND . 152CHAPTER 9 TROUBLESHOOTING . 1599.1THE EVENT LOG . 1599.2WHAT TO DO IF THE PERFORMANCE MONITORING SERVICE DOES NOT START . 1669.3WHAT TO DO IF THE CONNECTION FROM MANAGEMENT CONSOLE TO SERVER FAILS. 1729.4WHAT TO DO IF PERFORMANCE DATA COLLECTING FAILS . 1749.5WHAT TO DO IF PERFORMANCE DATA COLLECTING IS DELAYED . 1809.6WHAT TO DO IF THERE ARE SYSTEMPROVISIONING CONFIGURATION APPLYING ERRORS . 1819.7WHAT TO DO IF THERE ARE ERRORS WHEN PERFORMANCE ABNORMALITIES ARE REPORTED TOSYSTEMPROVISIONING . 1829.8WHAT TO DO IF THE SYSTEMMONITOR DATA MANAGEMENT TOOL MIGHT NOT START . 1839.9DATABASE . 1859.10OTHER . 189CHAPTER 10 NOTES . 19010.1THE NUMBER OF MONITORED MACHINES. 19010.2NOTES ON DATABASE. 19110.3NOTES ON GRAPH DISPLAYS . 19210.4NOTES ON LINKING TO SYSTEMPROVISIONING . 19310.5RELEASE OF RESOURCES . 19810.6NOTES ON UPGRADING/UPDATING . 19910.7ISSUES WHEN OTHER PRODUCTS TO MONITOR THE WINDOWS MONITORED MACHINE COEXISTWITH SYSTEM MONITOR - PERFORMANCE MONITORING SERVICES . 200APPENDIX . 201A.HOW PERFORMANCE VALUES FOR GROUPS ARE CALCULATED . 201
Chapter 1 Functions1.1Function Overview of System Monitor - Performance Monitoring ServicesSystem Monitor - Performance Monitoring Services is a software program that supports monitoring theperformance status of systems, and it provides features to view the performance state and to monitor thresholdsby periodically collecting performance data from the system and accumulating those data.You can use the methods of collecting performance data provided by a monitored machine's operating system orvirtualized infrastructure from the physical machine running on Windows or Linux, or from the virtualmachine server or virtual machine running on VMware, Hyper-V, Xen Server or KVM. Alternatively, you canexecute an arbitrary script on a management server or monitored machine to collect performance data.You can efficiently keep the collected performance data for a long period because System Monitor - PerformanceMonitoring Services aggregates the data as “summary data” and accumulates those aggregated data.System Monitor - Performance Monitoring Services provides graph view for the collected performance datawhich makes it easy to keep track of the performance status of the system.For systems with large-scale configurations, the performance status of the entire system can be followed at aglance by using the function that groups machines and graphs the performance status of each group. You canview the graph of the performance status on the SigmaSystemCenter Web console or the SystemMonitormanagement console.Performance problems (such as high load) can be discovered quickly by graphically displaying and monitoringthe performance status of the system in real time.It is also possible to display performance data that has been collected in the past again. This enables theoperational status of the system in the past to be checked.The threshold monitoring feature can automatically compare the collected performance data and an arbitrarythreshold, and, in case of exceeding threshold, it can log unusual loads on the monitored machine to the eventlog or notify SystemProvisioning of it. In notifying SystemProvisioning, SigmaSystemCenter can run the policyaction in response to the notified events.To make the VM Optimized Placement feature available, which is the feature for load balancing or power savingin the virtual environment of SigmaSystemCenter, you must use the threshold monitoring feature of SystemMonitor - Performance Monitoring Services.You can use the monitoring profile settings from the SigmaSystemCenter Web console to configure collectingperformance data or thresholds on System Monitor - Performance Monitoring Services. However, if theconfiguration requires any special customization, use the System Monitor - Performance Monitoring Servicesmanagement console.1
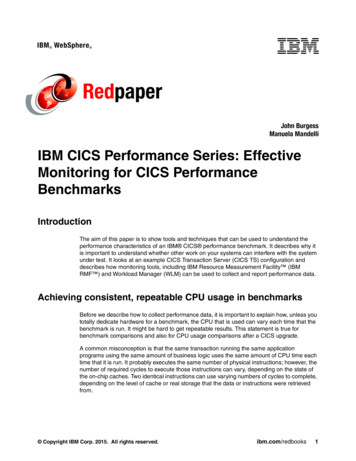
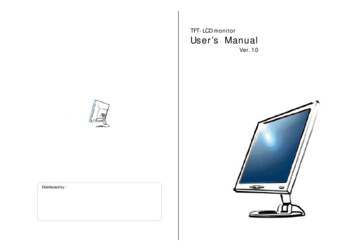
1.2Basic Configuration of System Monitor - Performance Monitoring ServicesSystem Monitor - Performance Monitoring Services is one of the SigmaSystemCenter products, and it consistsof a "Performance Monitoring Service function" that collects performance data and a "management consolefunction" that is the user interface for using the Performance Monitoring Service. Typically, System Monitor Performance Monitoring Services is used in combination with SystemProvisioning.Management serverSaved for3 days1 minuteinterval1 month1 weekAggregatingAggregating5 minutes15 minutes5 years3 monthsAggregatingAggregating1 hour1 dayAccumulatesperformancedataMaking settingsSystem Monitor - PerformanceMonitoring ServicesManagement consoleDisplaying graphsSystem Monitor - PerformanceMonitoring ServicesPerformance Monitoring ServiceApplying configurationinformation (such as amonitoring profile)Obtaining the data for Webgraph displaySystemProvisioningNotifying exceedingthresholdRunningpolicy actionsObtainingperformancedataSetting amonitoring profileWeb graphdisplayMonitored machines2
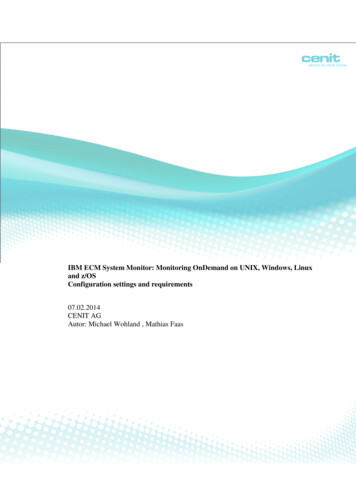
(1) The Performance Monitoring ServiceThis function resides on the server, and acquires performance data by accessing the monitored machines.The performance data is collected and stored in a database. Keeping the collected performance data for along period requires a large data space in a database. However, System Monitor - Performance MonitoringService can aggregate the data to one collection of the data in a longer interval and accumulate the datapreventing the data area from filling rapidly. The machine where the Performance Monitoring Service runsis called the "management server" and the machine whose performance is monitored should be called the"monitored machine".The Performance Monitoring Service runs in the background as a Windows service and startsautomatically when the OS starts.(2) The Management ConsoleThis is one of the user interfaces for using the Performance Monitoring Service. Settings for thePerformance Monitoring Service, such as which machines are monitored and which performanceinformation is collected, are performed from the management console. The management console can alsographically display performance data. If you intend to use not System Monitor - Performance omanageamonitoredmachine,usetheSigmaSystemCenter Web console (described later) instead of the System Monitor - PerformanceMonitoring Services management console.The management console is installed on the management server along with the Performance MonitoringService. Users connect to the Performance Monitoring Service by starting the management console on themanagement server. More than one management console can connect to the same Performance MonitoringService at the same time.In addition, central management is available for multiple management servers from one managementconsole. To implement performance monitoring on large-scale systems, separate monitored machines intothe appropriate units and prepare a management server for each.3
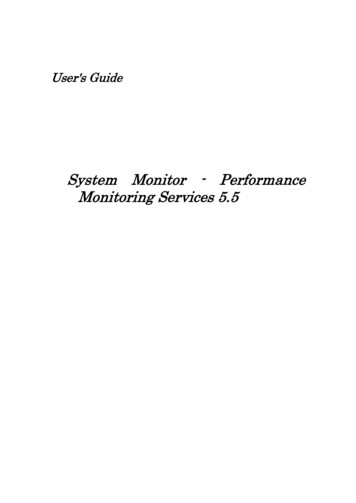
Management server1System Monitor - PerformanceMonitoring ServiceManagement consoleSystem Monitor Performance MonitoringServicesManagement server2Management server3System Monitor Performance MonitoringServicesSystem Monitor Performance MonitoringServicesMonitored machinesMonitoring Target Range of Management Console(3) SystemProvisioning/SigmaSystemCenter Web consoleSystemProvisioning is a core product of SigmaSystemCenter and performs configuration management andprovisioning for management machines in SigmaSystemCenter. To perform operations for configuring orprovisioning management machines, use the SigmaSystemCenter Web console.You can use the monitoring profile information (the set of performance indicator settings and thresholdsmonitoring settings) on the SigmaSystemCenter Web console to configure a monitored machine of SystemMonitor - Performance Monitoring Services and a performance indicator to be collected.System Monitor - Performance Monitoring Services applies the monitoring profile information and theconfiguration information of SystemProvisioning to itself at the timing of execution of reflecting theconfiguration information of SystemProvisioning. This allows System Monitor - Performance MonitoringServices to automatically start performance monitoring for the monitored machine that you intend toregister and allows to display the collected performance data in graph on the SigmaSystemCenter Webconsole.System Monitor - Performance Monitoring Services can notify SystemProvisioning of performanceproblems detected by it such as exceeding thresholds. This makes it possible to automatically start thepolicy action configured on SystemProvisioning.One SystemProvisioning can work with more than one System Monitor – Performance Monitoring Services.In performance monitoring in the large-scale system environment, monitored machines can be grouped by4
group or model in SystemProvisioning and each monitored machine can be monitored on a managementserver. In this case, you can view the performance information for the monitored machine in graph on theWeb console of each management server.Operating SystemsSupported operating systems for the management server and monitored machines are as follows:Supported operating systemsManagement serverWindows Server 2008 R2 Standard Edition SP1Windows Server 2008 R2 Enterprise Edition SP1Windows Server 2008 R2 Datacenter Edition SP1Windows Server 2012 Standard EditionWindows Server 2012 Datacenter EditionWindows Server 2012 R2 Standard EditionWindows Server 2012 R2 Datacenter EditionMonitored machinesWindows 2000 Server (SP4 or later)Windows 2000 Advanced Server (SP4 or later)Windows Server 2003, Standard Edition (including SP1, R2, SP2, andR2 SP2)Windows Server 2003, Enterprise Edition (including SP1, R2, SP2, andR2 SP2)Windows Server 2003, Standard x64 Edition (including R2, SP2, andR2 SP2)Windows Server 2003, Enterprise x64 Edition (including R2, SP2, andR2 SP2)Windows Server 2008 Standard Edition (including SP2)Windows Server 2008 Enterprise Edition (including SP2)Windows Server 2008 Standard x64 Edition (including SP2)Windows Server 2008 Enterprise x64 Edition (including SP2)Windows Server 2008 Datacenter x64 Edition (including SP2)Windows Server 2008 R2 Standard Edition (including SP1)Windows Server 2008 R2 Enterprise Edition (including SP1)Windows Server 2008 R2 Datacenter Edition (including SP1)Windows Server 2012 Standard EditionWindows Server 2012 Datacenter EditionWindows Server 2012 R2 Standard EditionWindows Server 2012 R2 Datacenter EditionWindows XP Professional (including SP1, SP2, SP3)Windows Vista Business Edition (including SP1, SP2)Windows Vista Enterprise Edition (including SP1, SP2)Windows Vista Ultimate Edition (including SP1, SP2)Windows 7 Professional Edition (including SP1)Windows 7 Enterprise Edition (including SP1)Windows 7 Ultimate Edition (including SP1)Windows 8 Pro EditionWindows 8 Enterprise EditionWindows 8.1 Pro EditionWindows 8.1 Enterprise EditionRed Hat Enterprise Linux ES/AS 4 (including x64)5
Supported operating systemsRed Hat Enterprise Linux 5, 6 and 7 Server (including x64)SUSE Linux Enterprise Server 9 (SP3), 10 (SP1, SP2)VMware ESX 4.0, 4.1VMware ESXi 4.0, 4.1, 5.0, 5.1, 5.5Citrix XenServer 5.6, 6.0Windows Server 2008 R2 Standard Hyper-V (including SP1)Windows Server 2008 R2 Enterprise Hyper-V (including SP1)Windows Server 2012 Hyper-VWindows Server 2012 R2 Hyper-VRed Hat Enterprise Linux 6.5 KVMGuest operating systems on VMware ESX/ESXiGuest operating systems on Citrix XenServerGuest operating systems on Hyper-VGuest operating systems on KVMWhen Windows Vista or Windows Server 2008 is running on the monitoredmachine, it may take longer time to collect performance data because of theNoteinternal behavior of Windows. For detail, see "9.5 What to do if PerformanceData Collecting is Delayed."Regarding Red Hat Enterprise Linux ES/AS 4 and Red Hat Enterprise Linux5, 6, 7 Server, these versions listed below are evaluated as a monitoredNotemachine:・The versions of 4.8, 5.10, 6.5 and 7.0.For the later version, please confirm our latest evaluation status.NoteService Pack 2 is necessary for collecting performance data from WindowsServer 2008 Standard/Enterprise x64 Hyper-V.Guest operating systems supported by VMware ESX, Citrix XenServer,NoteHyper-V, and KVM are supported only if they are supported as operatingsystems for monitored machines in System Monitor - PerformanceMonitoring Services.6
1.3Collected Performance DataSystem Monitor - Performance Monitoring Services periodically collects performance data from the monitoredmachines. Collected Performance Indicators can be specified for each SystemMonitor management server, foreach group or for each machine. If they are specified for a management server, they are shared with allmonitored machines that are monitoring targets of the management server.You can configure to collect performance data for the monitored machine on the monitoring profile ofSigmaSystemCenter or on the System Monitor – Performance Monitoring Services management console.Configuring on the monitoring profile of SigmaSystemCenter allows you to configure the monitored machineregistered by reflecting the configuration information of SystemProvisioning. The specified performanceindicator on the monitoring profile of SigmaSystemCenter is automatically applied to System Monitor ngtheconfigurationinformationofSystemProvisioning. For how to configure the monitoring profile, see 4.11.3, "How to Create a MonitoringProfile" and 5.5.15, "Configuring Settings on the Performance Monitor Tab" in SigmaSystemCenterConfiguration Guide.For how to configure it on the management console of System Monitor – Performance Monitoring Services, see4.2.2, "How to Specify Collecting Data Settings"1.3.1 Types of Performance Indicators and Collecting IntervalsThe Performance Indicators consist of "Resource", "Performance index" and "Instance". "Resource" is the targetresource of the Performance Indicators, and includes CPU, physical disk and memory. "Performance index" isthe type of data collected, and indicates CPU usage and disk transfer rates. "Instance" identifies a particularmeasurement object in situations where a resource contains multiple measurement objects. "Instance" is uniqueto "Performance index". The settings for "Instance" cannot be changed. Up to 256 items of PerformanceIndicators can be specified.Performance data is collected from monitored machines at regular intervals. These intervals are called"collecting intervals", and can be specified individually for each Performance Indicator item or collectively for allPerformance Indicator items.Performance Indicators that have been configured to collect data, begin collecting from monitored machinesautomatically when the Performance Monitoring Service starts.1.3.2 Built-in Performance IndicatorSystem Monitor - Performance Monitoring Services comes with Built-in Performance Indicators that arecommon to all systems. Some typical Built-in Performance Indicator items are set up as default settings for eachmanagement server when System Monitor - Performance Monitoring Services is installed.With built-in performance indicators, the individual data per device in the monitored machine cannot becollected because built-in performance indicators collect performance data per monitored machine basis. If youneed to collect individual performance data per device basis, use custom performance indicators instead.7
For example, the performance data obtained with Network Packet Transfer Rate (Bytes/sec) is the total rate ofall packets transferred through network adapters if a monitored machine has more than one network adapters.(1) Standard Performance IndicatorPerformance data for these performance indicators are collected by accessing the monitored machinedirectly.OS of monitored nWindowsResource1CPU Usage (%) is the percentage ofelapsed time that the processor spendsto execute a non-Idle thread.xxxxxxCPU SystemUsage (%)2CPU System Usage (%) is thepercentage of elapsed time that theprocess threads spent executing codein privileged mode.xx---xCPU User Usage(%)3CPU User Usage (%) is the percentageof elapsed time the processor spendsin the user mode.xx---xCPU Usage (MHz)4CPU Usage (MHz) is the amount ofused CPU resource that is calculatedby CPU Usage (%) the count oflogical processors CPU frequency.xxxxxxDisk TransferRate (Bytes/sec)21Disk Transfer Rate (Bytes/sec) is therate bytes are transferred to or fromthe disk during write or readoperations.xxx-xxDisk IO Count(IO/sec)22Disk IO Count (IO/sec) is the rate ofread and write operations on the disk.xxx-xxDisk ReadTransfer Rate(Bytes/sec)23Disk Read Transfer Rate (Bytes/sec) isthe rate at which bytes are transferredfrom the disk during read operations.xxx-xxDisk Read Count(IO/sec)24Disk Read Count (IO/sec) is the rate ofread operations on the disk.xxx-xxDisk WriteTransfer Rate(Bytes/sec)25Disk Write Transfer Rate (Bytes/sec)is the rate at which bytes aretransferred to the disk during writeoperations.xxx-xxDisk Write Count(IO/sec)26Disk Write Count (IO/sec) is the rateof write operations on disk.xxx-xxDisk Space (MB)27Disk Space (MB) displays theunallocated space, in megabytes, onthe disk drive. One megabyte is equalto 1,048,576 bytes.xxxxxxDisk Space Ratio(%)28Disk Space Ratio (%) is the percentageof total usable space on the whole diskdrive that was free.xxxxxxPerformance indexIDCPU Usage (%)8
NetworkNetwork PacketTransfer Rate(Bytes/sec)41Network Packet Transfer Rate(Bytes/sec) is the rate at which data istransmitted and received across theall physical NICs.xxxxxxThe value is total of Network PacketReception Rate (Bytes/sec) andNetwork Packet Transmission Rate(Bytes/sec).MemoryNetwork PacketReception Rate(Bytes/sec)42Network Packet Reception Rate(Bytes/sec) is the total rate at whichdata is received across the all physicalNICs.xxxxxxNetwork PacketTransmission Rate(Bytes/sec)43Network Packet Transmission Rate(Bytes/sec) is the total rate at whichdata is transmitted across the allphysical NICs.xxxxxxPhysical MemorySpace (MB)61Physical Memory Space (MB) is theamount of physical memory, inMegabytes, immediately available forallocation to a process or for systemuse.xxxxxxPhysical MemorySpace Ratio (%)62Physical Memory Space Ratio (%) isthe percentage of the availablememory size to the installed physicalmemory size that is calculated byPhysical Memory Space (MB) / theinstalled physical memory size 100.xxxxxxIf the OS for the monitored machine is Windows 2000, users mus
System Monitor - Performance Monitoring Services 5.5 (hereafter referred to as "System Monitor - Performance Monitoring Services") is a software program that provides a simple means of monitoring the performance of multiple machines. This manual explains how to use System Monitor - Performance Monitoring Services. This manual is organized as .