Transcription
IBM WebSphere RedpaperJohn BurgessManuela MandelliIBM CICS Performance Series: EffectiveMonitoring for CICS PerformanceBenchmarksIntroductionThe aim of this paper is to show tools and techniques that can be used to understand theperformance characteristics of an IBM CICS performance benchmark. It describes why itis important to understand whether other work on your systems can interfere with the systemunder test. It looks at an example CICS Transaction Server (CICS TS) configuration anddescribes how monitoring tools, including IBM Resource Measurement Facility (IBMRMF ) and Workload Manager (WLM) can be used to collect and report performance data.Achieving consistent, repeatable CPU usage in benchmarksBefore we describe how to collect performance data, it is important to explain how, unless youtotally dedicate hardware for a benchmark, the CPU that is used can vary each time that thebenchmark is run. It might be hard to get repeatable results. This statement is true forbenchmark comparisons and also for CPU usage comparisons after a CICS upgrade.A common misconception is that the same transaction running the same applicationprograms using the same amount of business logic uses the same amount of CPU time eachtime that it is run. It probably executes the same number of physical instructions; however, thenumber of required cycles to execute those instructions can vary, depending on the state ofthe on-chip caches. Two identical instructions can use varying numbers of cycles to complete,depending on the level of cache or real storage that the data or instructions were retrievedfrom. Copyright IBM Corp. 2015. All rights reserved.ibm.com/redbooks1
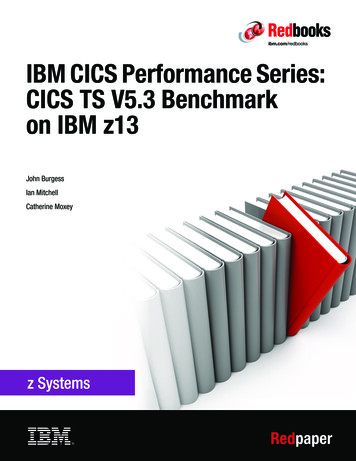
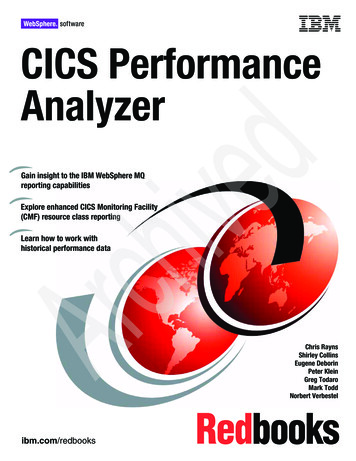
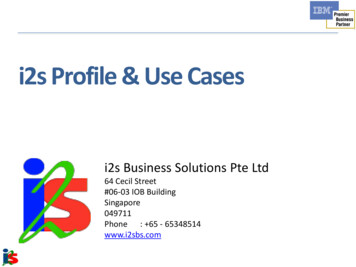
Code in a CICS region running, for example, on a zEC12, is affected by the state of cachehierarchy if the following conditions are true: It is running on a single logical partition (LPAR) of z hardware with any other type of workexecuting in other address spaces on the same LPAR. Work is running on any other LPAR sharing the same central processors (CPs) as theLPAR where the CICS region resides. Work is running on any other LPAR that is using CPs that are on the same processor unit(PU) chip as the CPs that the LPAR running CICS is using because CPs on the same PUChip share a level 3 cache. CPs on the same PU Chip share a level 3 cache even if theLPAR under test has dedicated CPs. Work is running on any other LPAR that is using CPs that are on the same book as theCPs that the LPAR running CICS uses because CPs on the same book share a level 4cache and the same real storage. CPs on the same book share a level 4 cache and thesame real storage even if the LPAR under test has dedicated CPs.Figure 1 shows the memory hierarchy of a zEC12.Figure 1 zEC12 cache layoutFigure 1 shows up to six CPs on a PU chip, six PU chips in a book, and four books in a centralprocessor complex (CEC). Not all CPs are configurable as general-purpose CPs. CPs areassociated with an L1 cache and an L2 cache and shared use of the L3 and L4 caches. Thedeeper into the cache hierarchy the instruction needs to go for its data, the more CPU cyclesit uses. If the cache that programs are using is getting disrupted by other programs even fromother LPARs, the data must be retrieved from higher-level caches or real storage, thereforevarying the cost of these instructions.This depth into the memory hierarchy, to which a workload that is running on an LPAR needsto go to retrieve its data, is referred to as Relative Nest Intensity (RNI). RNI is a metric that isnow used to select the most relevant workload when you use the IBM Large SystemsPerformance Report (LSPR) to calculate the effects of hardware migration. Historically, LSPRworkload capacity values used application names, such as CICS and IBM IMS .2IBM CICS Performance Series: Effective Monitoring for CICS Performance Benchmarks
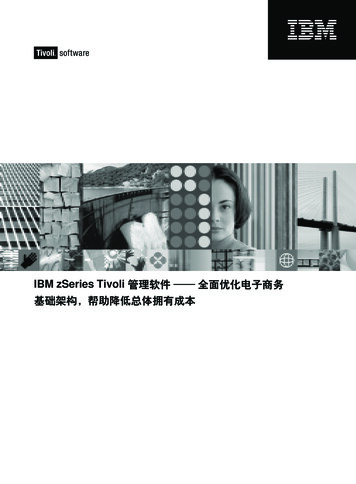
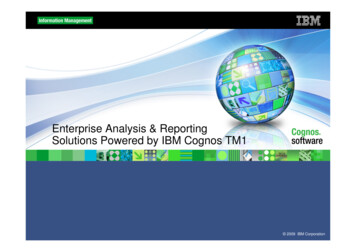
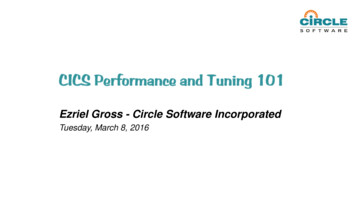
However, because capacity performance was always more closely associated with how aworkload uses and interacts with a particular processor hardware design and moreimportantly its caches, this new RNI metric was introduced with the ability for clients tocalculate this value for their own workloads.For more information, see this website, which provides a more detailed description of LSPRand ib03060.nsf/pages/lsprwork?OpenDocumentOn IBM z10 and later machines, the ability to collect instrumentation data that describesthe interaction with memory was introduced. This Hardware Instrumentation (HIS) can beused to produce IBM z/OS file system (zFS) data and System Management Facilities (SMF)113 records. This data can be used to provide a detailed insight into the workloadcharacteristics. Also, this data can be used to determine in a benchmark that the interactionbetween the software and hardware was the same in two comparative runs and that theresults were not affected by outside influences (Figure 2).For more information about how to gather and use this HIS data, see the IBM Redpaper ,Setting Up and Using the IBM System z CPU Measurement Facility with z/OS,REDP-4727-00.Figure 2 Other work that affects CICS CPU per transactionFigure 2 shows the effect on CICS CPU/transactions when other batch-type work in separateaddress spaces is started on the same LPAR. The other work, which was introduced for ashort time, causes more contention in the cache hierarchy and the cycles per instruction(CPI) increases for the CICS workload. In this example, there was an increase of up to 15%more CPU that was used during that period.In summary, to get consistent and repeatable CPU usage from a benchmark comparison, it isimportant to have a configuration that cannot be affected by other work anywhere on thesystem, either on the LPAR under test or any other LPAR on the machine.IBM CICS Performance Series: Effective Monitoring for CICS Performance Benchmarks3
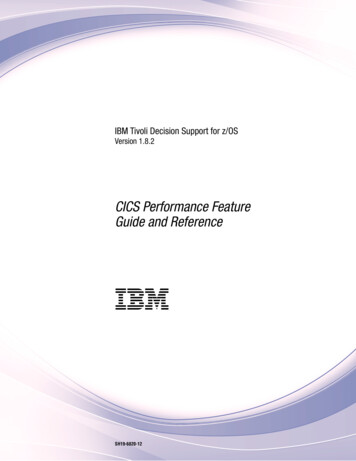
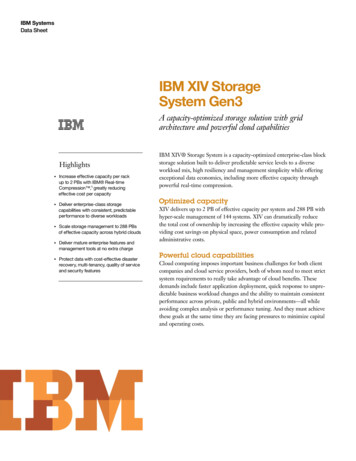
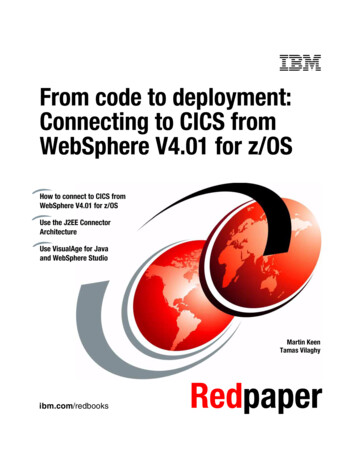
In reality, not everyone can dedicate hardware to a benchmark. So, in this case, take sufficientmeasurements to establish a trend, especially in comparisons before and after a CICSupgrade where a trend from before and after must be established so that extremes or outlyingcases can be eliminated.CICS Transaction Server (CICS TS) configurationFor demonstration, we chose the following CICS configuration (Figure 3) to use as aperformance benchmark.Figure 3 CICS configurationAs shown in Figure 3, there were two terminal-owning regions (TORs) that both route alltransactions to all of the four application-owning regions (AORs). All AORs then function-shipall VSAM file requests to a single data-owning or file-owning region (FOR). The applicationidentifiers (APPLIDs) for the regions are also shown in Figure 3.For reference with the WLM setup later, the job names of the TORs are CICST001 andCICST002; the job names of the AORs are CICSA001, CICSA002, CICSA003, andCICSA004; and the job name for the FOR is CICS2A07.CICS TS applicationThe application that is used for this benchmark has a relatively short path length in terms ofbusiness logic.It has the following characteristics: COBOL/VSAM. All transactions arriving in the TORs are routed to the AORs. Routing is performed by using IBM CICSPlex System Manager (SM).4IBM CICS Performance Series: Effective Monitoring for CICS Performance Benchmarks
A few transactions start in the AOR by way of a Start from a routed transaction. On average, 12 file requests occur per transaction. All file requests are function-shipped to the FOR, 69% Read, 10% Read for Update, 9%Update, 11% Add, and 1% Delete. Long-running mirrors are used. To avoid any transaction affinities, all temporary storage requests use a temporary storagedata sharing server.Hardware and software configurationThis section describes the hardware and software that are used during this benchmark.The following hardware is used: zEC12 2827-799 model HA1LPAR with three dedicated CPs for the system under testLPAR with three dedicated CPs for the network driverInternal Coupling Facility with ICP linksThe following software is used: CICS Transaction Server V5R2 z/OS V2R1 IBM Workload Simulator for z/OS (WSim)Summary of performance monitoring toolsDuring the benchmark sampling period, the following tools were used.RMF Monitor IRMF Monitor I was used to record system resource usage, including CPU, DASD, andstorage. Also, RFM Monitor I was used with the WLM configuration to record the CPU,transaction rates, and response times for CICS service classes and report classes.SMF records 70 - 79 are written on an interval basis. They can be post-processed by usingthe RMF utility program ERBRMFPP.RMF Monitor IIIRMF Monitor III was used to record the coupling facility activity for the logger and temporarystorage structures. SMF records 70 - 79 are written on an interval basis. Also, they can bepost-processed by using the RMF utility program ERBRMFPP. RMF Monitor III can be usedon an interactive basis and the data can be written to VSAM datasets for later review.CICS TS statisticsCICS statistics were used to monitor and report CICS resource usage, including CPU,storage, file accesses, the number of requests that were transaction-routed, and the numberof requests that were function-shipped.IBM CICS Performance Series: Effective Monitoring for CICS Performance Benchmarks5
With CICS interval statistics, most of the counters are reset at the start of the interval so thatany resource consumption that is reported relates only to the observed measurement period.Interval statistics can be activated by using CEMT SET STATISTICS. However, when you set thisinterval, the first interval can be adjusted to a shorter time so that all the intervals aresynchronized to the STATEOD parameter. For example, if you use CEMT to set the interval to 15minutes at 10 past the hour, the first interval expires in 5 minutes so that all future intervalsline up on 15-minute wall clock boundaries. The values in this first report can also beassociated with a much longer period, depending on the time of the last reset.Another alternative to using interval statistics is to use CEMT to reset the counters and then atthe end of the measurement period, use CEMT to record all the statistics. Resetting thestatistics requires a change of state from ON to OFF or from OFF to ON. To ensure that thischange happens, the commands that are shown in Figure 4 show an example of resetting thestatistics in one of the AORs in this configuration.F CICSA001,CEMT SET STAT OFF RESETF CICSA001,CEMT SET STAT ON RESETMeasurement period is between the RESET and the RECORDF CICSA001,CEMT PERFORM STAT ALL RECORDFigure 4 Collecting CICS statisticsRegardless of whether the statistics are ON or OFF, when a PERFORM RECORD is issued, astatistics record is written.CICS statistics are written as SMF 110 subtype 2 records. They can be post-processed byusing the CICS statistics utility program, DFHSTUP, or CICS Performance Analyzer (CICSPA).CICS TS Performance Class MonitoringWhen CICS Performance Class Monitoring is turned on by either using MNPER ON in the CICSstartup parameters or by using CEMT or CEMN transactions to turn it on dynamically, aPerformance Class Monitoring record is generated for every executed transaction when thetransaction terminates.The command in Figure 5 is an example of turning on CICS Performance Class Monitoringand Resource Class Monitoring for one of the AORs in this configuration.F CICSA001,CEMT SET MON ON PER RESRCEMonitoring can then be turned off usingF CICSA001,CEMT SET MON ON NOPER NORESRCEFigure 5 Collecting CICS Performance Class Monitoring dataEach transaction’s performance class record contains information about the resources thatwere used by that transaction, how much CPU was used on all the various task control blocks(TCBs), and information about how long it waited for different resources. Resource ClassMonitoring records contain information about the individual files, temporary storage queues,and distributed program links (DPLs) that were used by transactions.6IBM CICS Performance Series: Effective Monitoring for CICS Performance Benchmarks
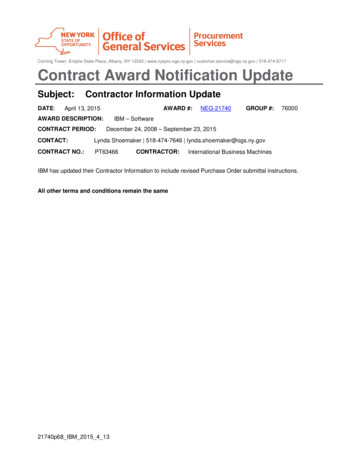
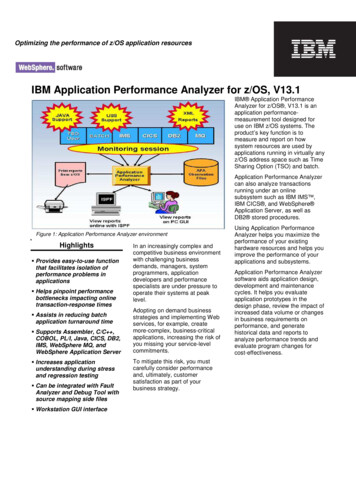
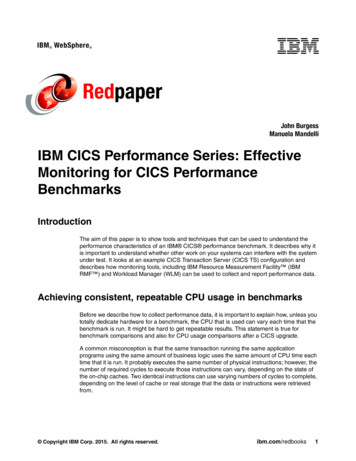
Monitoring records are written as SMF 110 Type 1 records. They can be analyzed by usingCICS Performance Analyzer for z/OS.Hardware Instrumentation countersHardware Instrumentation (HIS) can be used to collect Instruction samples and counters.Only counters were used for this benchmark.HIS counters are written as SMF 113 records and to zFS. These counters contain informationabout key hardware events, such as the number of instructions, the number of cycles thatwere used, and the number of instruction/data cache misses. For more information, seeSetting Up and Using the IBM System z CPU Measurement Facility with z/OS, REDP-4727,which provides a good description of how to set up and use p4727.pdfz/OS Workload Manager (WLM) and CICSz/OS Workload Manager provides a solution for managing workload distribution, workloadbalancing, and distributing resources to competing workloads.WLM service definition constructsFigure 6 shows the main components of a z/OS WLM service definition.Figure 6 WLM service definition constructsIBM CICS Performance Series: Effective Monitoring for CICS Performance Benchmarks7
The main components are described: Service definitionThe service definition is composed of a set of service policies. There is only one servicedefinition for a sysplex. Service policiesA service policy applies to all of the work running in a sysplex. A service policy is acollection of performance goals that are described in a set of service classes.Multiple service policies with different objectives can exist, but only one can be active at atime. Resource groupsResource groups define processor capacity boundaries across the sysplex. You canassign a minimum and maximum amount of CPU service units per second to work byassigning a service class to a resource group. Classification rulesThe classification rules link the external properties of transactions to a service class. Therules are used to assign incoming work to a service class. WorkloadWorkload is an arbitrary name that is used to group service classes for reporting andaccounting. Service classThe service class defines the performance goals for specific types of work. The goal canbe based on the response time or velocity. Report classThe report classes group work for reporting. They are commonly used to provide moregranular reporting for subsets of work within a single service class.WLM is used to set the service levels that you want your CICS regions and transactions toachieve. It is also a useful, relatively inexpensive method for reporting CICS CPU usage,transaction rates, and response times by way of RMF.When work enters the system, it is classified into service classes and reporting classes basedon a set of rules associated with its subsystem type.For this benchmark, all the CICS regions were submitted as batch jobs so in this case theyare all initially classified into a service class under the WLM JES classification rules. Whentransactions start executing in these regions, whether they stay managed to the service classthat is specified in the JES classification depends on what is specified in the Manage RegionUsing Goals of parameter for that classification.If REGION is specified, the CICS region is managed to the Velocity goal of the JES serviceclass.Velocity in this case is the measurement of the speed at which an address space getsdispatched on a CPU when it is in a ready state:Velocity Using samples / (Using samples Delay samples)WLM samples the states of dispatchable units every 250 milliseconds, and this formula refersto these states. Using is when the dispatchable unit is using CPU or DASD I/O. Delayed iswhen delayed by CPU, storage, or I/O.8IBM CICS Performance Series: Effective Monitoring for CICS Performance Benchmarks
If TRANSACTION is specified, the regions are managed to the response time goals of thetransactions that are running in them as specified in the CICS subsystem classification rules.For this benchmark, the CICS response time goals are based on a percentile goal, forexample, 80% of transactions must finish within 0.030 of a second. It is a preferred practice toset goals that are achievable. The shortest goal that can be set is 0.015.If BOTH is specified, the regions are managed to the goals of the transactions that are runningin them. However, at the same time, WLM can help achieve the velocity goal set by the JES orSTC service class that is associated with these regions.For this demonstration, we ran all our CICS transactions in the same service class and usedWLM report classes and workloads to report on the different region types.A report class can be associated with a job that was classified by the JES classification rules,in which case, CPU, I/O, and real storage are reported in that class. Also, a report class canbe associated with a CICS subsystem classification based, in our case, on its CICS APPLID.This reports transaction rates and response times. If you use the same report class for boththe JES and the CICS classifications, you get all of this information in a single report.Another concept, which is called a workload, is an arbitrary grouping of service classes thatis used for reporting and accounting. In this benchmark, we used report classes to look atTORs, AORs, and the FOR. We used the workload to accumulate all the regions into onereport.Note: An important factor with WLM reporting is that CICS transactions are only reportedin the region in which they were originally initiated, classified, and then ended.For instance, if in the TOR/AOR/FOR environment, 5000 transactions arrived in the TOR,these transactions are classified accordingly. If they are all routed to the AOR, they carry thatclassification with them. The same rule applies for any transaction that is running on behalf ofthese in the FOR, such as CSMI. When you look at an RMF report, the only transaction countthat appears is the 5000 in the TOR. This count contains the number of transactions ended,which is the total number of transactions that were initiated in the region or regions that arerepresented by this report class or service class. WLM has a count of the initial transactionsonly, not any transaction that is started as a result of a transaction route or function-ship. Inthis example, where all the transactions were routed to an AOR, there is an ENDED count of5000 and an EXCTD of 5000 in the RMF report. The EXCTD is a count of transactions thatwere routed to another CICS region.The Actual and Execution response times are also shown. Actual refers to the overallresponse time of transactions and Execution refers to the time that is spent executing in theAORs and FOR. Figure 22 on page 19, Report Class for TORs, shows an example.Setting up WLM for this CICS TS configurationFigure 3 on page 4 shows a CICS configuration that consists of two TORs, four AORs, andone FOR. By using the WLM Time Sharing Option (TSO) application, we set up WLM so thatour RMF Monitor I reports show the following information: The transaction rate, response times, and CPU usage in the TORs The transaction rate, response times, and CPU usage in the AORs (this transaction countdoes not include those transactions that were routed from TORs)IBM CICS Performance Series: Effective Monitoring for CICS Performance Benchmarks9
The transaction rate, response times, and CPU usage in the FORs (this transaction countdoes not include those CSMIs that are run as a result of a function-ship request from anAOR) The total transaction rate across all regions and total CPU used by CICS regions(Workload report)In addition to the preceding information, WLM was also set up so that the CICS regions aretransaction-managed with a percentile average response time goal of 80% of all transactionsending within 0.030 seconds.The following windows show several of the panels that we used to achieve the required WLMsettings. Figure 7 shows the TSO WLM application.Figure 7 TSO WLM applicationFigure 7 shows the main panel for the TSO WLM application. The CICS regions that wereused for this benchmark were submitted as batch jobs so these are classified by modifyingthe JES subsystem type under option 6, Classification Rules.JES subsystem classificationFigure 8 on page 11 shows the Subsystem type selection list, which is displayed after youselect option 6, Classification Rules, on the previous panel (Figure 7).10IBM CICS Performance Series: Effective Monitoring for CICS Performance Benchmarks
Figure 8 Selecting the JES classification rulesFigure 8 shows the JES subsystem type that is selected for update.Figure 9 shows the JES classification rules.Figure 9 JES classification rulesFigure 9 shows the JES classification rules for the CICS regions that are described inFigure 3 on page 4. The two TORs start in service class JESTORS. They are reported inreport class CICSTORS. The AORs start in service class CICSBTCH. They are reported inreport class CICSAORS. The FOR starts in service class CICSBTCH. It is reported in reportclass CICSFORS.The TORs were given a unique service class because the classification rule for these regionsdiffers from the classification rule for the other regions. If we scroll to the right in the previouswindow, as shown in Figure 10 on page 12, you can see that these regions are managed byboth REGION and TRANSACTION (BOTH). The AORs and FOR are managed by TRANSACTIONonly.IBM CICS Performance Series: Effective Monitoring for CICS Performance Benchmarks11
Figure 10 TORs have BOTH specifiedDuring initialization, all regions are managed to the JES subsystem classification serviceclasses. When these CICS regions start to execute transactions, transactions are thenclassified according to the CICS subsystem classification rules and the regions are managedto achieve those response time goals in the CICS service classes. The TORs are managedas part of that service class (to achieve the CICS response time goals), but at the same time,their velocity goal is considered by WLM because they have BOTH specified. The AORs andthe FOR are not managed to the JES service class after transactions start to execute.CICS subsystem classificationThe CICS regions for this benchmark are managed by TRANSACTION, and in addition theTORs are managed to BOTH. The following windows show how we set up the WLMdefinitions for the CICS subsystem classification rules. Figure 11 shows the selection of theCICS subsystem rules.Figure 11 Selecting the CICS subsystem rulesFigure 11 shows the CICS subsystem rules that are selected for the update.Figure 12 on page 13 shows the CICS classification rules.12IBM CICS Performance Series: Effective Monitoring for CICS Performance Benchmarks
Figure 12 CICS classification rulesFigure 12 shows that all the regions in our configuration use the same service class. Alltransactions are classified into service class CICSJB but the regions are grouped by type intounique report classes. Classifications are based on the APPLID of the CICS region. Forexample, the TORs have APPLIDs IYCUT001 and IYCUT002; so based on IYCUT0*, alltransactions that start in the TORs run in service class CICSJB and are reported in reportclass CICSTORS. IYCUZC07 is the name for FOR.Note: In Figure 9 on page 11, the TORs, AORs, and FOR classifications for the JESsubsystems show the regions reporting into the same report class names as the CICSsubsystem rules in Figure 12. JES subsystems report CPU time, I/O, and real storage.CICS subsystems report transaction rates and response time. When both subsystem typespoint to the same report class, all data appears in one place. An example is shown later inan RMF report.Service classesIn this configuration, two JES subsystem service classes JESTORS and CICSBTCH exist.One CICS subsystem service class, CICSJB, exists. The AORs and FOR regions aremanaged only by service class CICSBTCH during the CICS initiation and until transactionsstart running. Then, the AORs and FOR regions switch to being TRANSACTION-managed byservice class CICSJB.Figure 13 on page 14 show the selection of service class definitions.IBM CICS Performance Series: Effective Monitoring for CICS Performance Benchmarks13
Figure 13 Selecting service classesFigure 14 lists the service classes.Figure 14 Listing the service classesFigure 14 shows a list of defined service classes.Figure 15 on page 15 and Figure 16 on page 15 show the definitions for the CICSsubsystems service class CICSJB and the JES subsystem service class JESTORS.14IBM CICS Performance Series: Effective Monitoring for CICS Performance Benchmarks
Figure 15 CICSJB service class definitionFigure 15 shows the definition for CICSJB, which is a response time with percentile goalwhere 80% of the transactions need to finish within 0.030 of a second.Note: Data for this service is also accumulated in a workload called CICSCPU. A workloadis an arbitrary name to group service classes together for reporting or accounting.Transactions that run in this service class have an importance of 2, which is the relativeimportance of this service class compared to others. The range is 1 - 5, and 1 is thehighest importance. Also, discretionary is available, which means that it gets service only ifno other service class needs service at that time.Figure 16 shows the definition for JESTORS.Figure 16 JESTORS service class definitionFigure 16 shows the definition for the JES subsystem service class JESTORS. This is aspecial case where although all transactions entering the TORs via the network are classifiedinto service class CICSJB and the TOR regions are managed with the other regions thatsupport that service class to achieve that response time goal of 30 milliseconds, the TORsare also managed to their velocity goal because of being managed by BOTH.IBM CICS Performance Series: Effective Monitoring for CICS Performance Benchmarks15
Note: In this case, the importance of the JESTORS is higher than the CICSJB serviceclass and JESTORS is specified as CPU Critical. CPU Critical means that even if thisservice class is achieving its goal, lower importance service classes are not allowed to takeits CPU when it is executing.The data for this service class is also accumulated into workload CICSCPU, which is thesame workload as the CICS service class.Figure 17 shows the CICSBTCH service class definition.Figure 17 CICSBTCH service class definitionFigure 17 shows the definition for JES subsystem service class CICSBTCH. Although noregions are actually managed to this service class because all of the regions areTRANSACTION-managed, the CPU times, I/O, and real storage are still reported andaccumulated into the same workload, CICSCPU.The RMF report shows the data from all seven CICS regions in workload CICSCPU, includingdata from both the JES and CICS service classes. An example RMF report is shown in“Analyzing the data” on page 18.Verifying the setupFigure 18 shows the TSO System Display and Search Facility (SDSF) Display Active (DA)display for these regions.Figure 18 A TSO S.DA display for the CICS regions16IBM CICS Performance Series: Effective Monitoring for CICS Performance Benchmarks
In Figure 18 on page 16, when you use TSO SDSF view, all CICS regions appear to have theJES subsystem service classes associated with them. However, under the column Server, inthe AORs and the FOR, YES is displayed. YES indicates that these regions, although shownas in service class CICSBTCH, are actually managed by the service classes of thetransaction response times running in them. The TORs show service class JESTORs, butunder the Server column, REG-SERV is displayed. REG-SERV is the indication that BOTH wasspecified in the JES subsystem classification rule and that they are managed to a velocity anda response time goal.Executing the benchmarkThis section describes the execution of the benchmark and how the work was delivered toCICS.Repeatable measurementsThe first part of this paper describes the issue of repeatable and consistent measurements.The LPAR that is used to support the CICS regions in this benchmark has three dedicatedCPs. If you refer to Figure 1 on page 2, you can see that even though our CPs are dedicated,the L3 and L4 caches are shared with other CPs that are used by other LPARs. So, thissituation is not perfect; it can lead to CPU variation because those caches can have their datainvalidated by those CPs that are used by the other LPARs. It is important to understand thissituation before we can continue to show how the data can be collected and then analyzed.We ran this benchmark by using IBM Workload Simulator for z/OS (WSim) running on oneLPAR, simulating 10000 LU2 clients in session with the TORs. The system under test was ona separate LPAR in the same sysplex. All network traffic was routed by way of a couplingfacility from one LPAR to the other. A “user think time” was adjusted to achieve the requiredtransaction rate in the CICS regions, and the workload was allowed to run for a period toensure that all programs were loaded and the LSR pools were populated. After thestabilization period was complete, the performance data collection was started.Collecting the dataNo specific changes to any default CICS parameters were needed to support the data thatwas collected during this benchmark. Data was collected for a 5-minute period, which isrelatively short but adequate for the demonstration in this paper.RMF, CICS Performance Class Monitoring, CICS statistics, and HIS were all synchronizedand started and ended together. We use an automation tool that enters commands on theIBM MVS console on a time-based interval. Clients can use the tool that is most convenientfor them for this role.To generate the RMF interval, we chose to simply start and stop RMF at the appropriatetimes, which creates an interval report for that period rather than trying
WebSphere IBM CICS Performance Series: Effective . Summary of performance monitoring tools During the benchmark sampling period, the following tools were used. RMF Monitor I RMF Monitor I was used to record system resource usage, including CPU, DASD, and storage. Also, RFM Monitor I was used with the WLM configuration to record the CPU,