Transcription
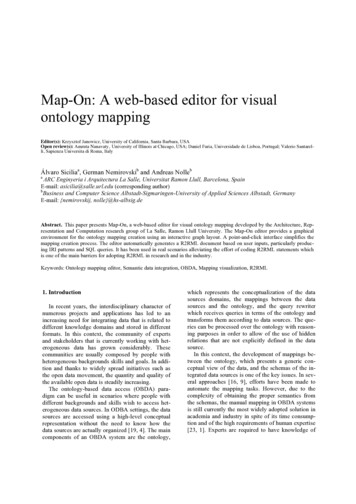
Map-On: A web-based editor for visualontology mappingEditor(s): Krzysztof Janowicz, University of California, Santa Barbara, USAOpen review(s): Amruta Nanavaty, University of Illinois at Chicago, USA; Daniel Faria, Universidade de Lisboa, Portugal; Valerio Santarelli, Sapienza Universita di Roma, ItalyÁlvaro Siciliaa, German Nemirovskib and Andreas NollebaARC Enginyeria i Arquitectura La Salle, Universitat Ramon Llull, Barcelona, SpainE-mail: asicilia@salle.url.edu (corresponding author)bBusiness and Computer Science Albstadt-Sigmaringen-University of Applied Sciences Albstadt, GermanyE-mail: {nemirovskij, nolle}@hs-albsig.deAbstract. This paper presents Map-On, a web-based editor for visual ontology mapping developed by the Architecture, Representation and Computation research group of La Salle, Ramon Llull University. The Map-On editor provides a graphicalenvironment for the ontology mapping creation using an interactive graph layout. A point-and-click interface simplifies themapping creation process. The editor automatically generates a R2RML document based on user inputs, particularly producing IRI patterns and SQL queries. It has been used in real scenarios alleviating the effort of coding R2RML statements whichis one of the main barriers for adopting R2RML in research and in the industry.Keywords: Ontology mapping editor, Semantic data integration, OBDA, Mapping visualization, R2RML1. IntroductionIn recent years, the interdisciplinary character ofnumerous projects and applications has led to anincreasing need for integrating data that is related todifferent knowledge domains and stored in differentformats. In this context, the community of expertsand stakeholders that is currently working with heterogeneous data has grown considerably. Thesecommunities are usually composed by people withheterogeneous backgrounds skills and goals. In addition and thanks to widely spread initiatives such asthe open data movement, the quantity and quality ofthe available open data is steadily increasing.The ontology-based data access (OBDA) paradigm can be useful in scenarios where people withdifferent backgrounds and skills wish to access heterogeneous data sources. In ODBA settings, the datasources are accessed using a high-level conceptualrepresentation without the need to know how thedata sources are actually organized [19, 4]. The maincomponents of an OBDA system are the ontology,which represents the conceptualization of the datasources domains, the mappings between the datasources and the ontology, and the query rewriterwhich receives queries in terms of the ontology andtransforms them according to data sources. The queries can be processed over the ontology with reasoning purposes in order to allow of the use of hiddenrelations that are not explicitly defined in the datasource.In this context, the development of mappings between the ontology, which presents a generic conceptual view of the data, and the schemas of the integrated data sources is one of the key issues. In several approaches [16, 9], efforts have been made toautomate the mapping tasks. However, due to thecomplexity of obtaining the proper semantics fromthe schemas, the manual mapping in OBDA systemsis still currently the most widely adopted solution inacademia and industry in spite of its time consumption and of the high requirements of human expertise[23, 1]. Experts are required to have knowledge of
the data schemas to be integrated and on the ontology architecture.Mappings from relational databases to a RDF dataset are mostly implemented using R2RML, a declarative language recommended by the W3C.R2RML is supported by OBDA systems for dataintegration such as Mastro Studio [5] and systems fordata integration [2]. As stated above, creatingR2RML mappings require advanced skills and expertise in ontology design and formal logic. However,also domain experts and data owners, who usuallylack the mentioned expertise, are involved in thesetting up of OBDA scenarios. However, in thesescenarios and for these kinds of users, the main barrier is often the lack of a visual representation of themappings. In practice, a visual representation couldhelp them to overcome the lack of expertise andcomplete the mapping task.With this scenario in mind, we have developedMap-On, a graphical environment for ontology mapping to help different kind of users – domain experts,data owners, and ontology engineers – to create andmaintain mappings between a database and a domainontology using the R2RML recommendation. Theontology mapping environment offers visualizationsof mappings based on a graph layout and supportsthe automated generation of IRI patterns and SQLqueries for R2RML statements.The paper is organized as follows. Section 2 givesan overview of the existing mapping editors. Webriefly introduce the R2RML language in section 3.Afterwards, in section 4, the main features of MapOn are described, including its visual representationof ontology mappings, point-and-click interface andthe automated generation of R2RML statements.Section 5 gives a complete overview of the tool architecture. A description of real-world deploymentsof Map-On is given in Section 6, and a discussionabout the current limitations and future plans, is exposed in Section 7.2. Related toolsSeveral tools have been developed to assist experts in specifying the mappings between the datasources and the ontologies. For instance, OntopProextends Protégé by providing a mapping editor thatintegrates a SPARQL query interface with the Questquery engine [22]. In spite of the fact that the editorworks with a proprietary mapping format, it can export and import R2RML files. Similar functionalitiesare included in the mapping editor presented bySengupta et al. in [24], in this case with native support of R2RML. Generally, the users of these toolsare technicians, experts in formal and especially description logics. These tools do not provide graphicvisualization of any kind. This shortcoming makesthese tools inadequate for domain experts and dataowners, who despite being involved in the data integration process, do not have the necessary background in ontology engineering.A significant help for non-experts in ontology engineering can be provided by ontology visualizationtechniques. They help users to inspect, navigate, andverify the ontologies and mappings [10].Mapping editors like the Karma system constitutea good example of this. Karma is a mapping editorthat provides a graphical user interface for visualizing and editing the mappings. Moreover, Karma canautomatically suggest mappings and supportsR2RML recommendation [9]. The mappings aredisplayed using a tree layout for the ontology and atable layout for the database schema. Another example is ODEMapster which works in a similar way toKarma. It also offers a graphic visualization of thedatabase schema and of the domain ontology using atree layout expressing the mappings in a proprietarymapping language called R2O [20]. Furthermore, theRBA (R2RML By Assertion) tool also uses a treelayout to display the mappings and supports R2RML[14].The limitation of these tools lies in the exploitation of the tree layout for visualization. Such a layoutis unable to represent the complete structure of thedatabase schema, ontology and mapping by itselfsince the structure of an ontology is like a graph.Indeed, even when given a fixed screen space, it isnot always possible to visualize the entire tree structure of ontologies with multiple inheritances andwith a large number of descendants [7].Visualizing ontologies and mappings with a graphlayout is probably the most natural and the mostcommonly used form of visualization. It has beenfound, in a usability test, that graph layouts are moresuitable for overviews and their flexibility helpedusers to hold attention during the mapping tasks [7].However, graph layouts can become difficult tomanage once the nodes visualized exceed a certainnumber.A prominent example is the mapping visualizationmodel presented by Lembo et al. in [11]. In this case,the mappings are presented in a graph layout including three views focused on the mapping, the ontology, and the source. But a complete overview of the
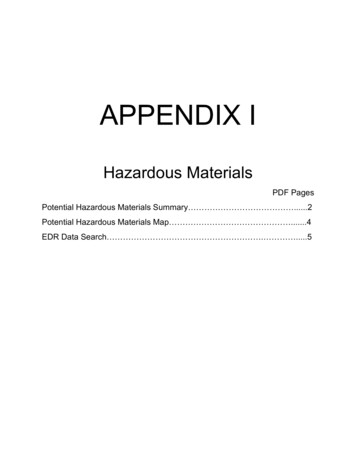
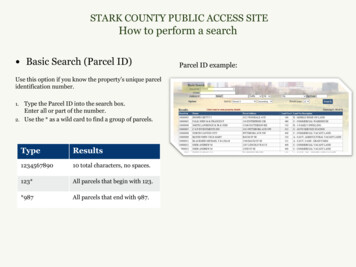
all mappings at once is not provided. RMLEditor isanother example of an editor that presents the mappings using a graph layout [8]. The limitation of themapping representation of RMLEditor is that structure of the relational source is not included in themapping representation. However the use of graphlayout in ontology mapping editors is rare.Table 1Summary of tool featuresToolsOntopPro [22]Sengupta et al. [24]Karma [9]ODEMapster [20]RBA [14]Lembo et al. [11]RMLeditor [8]Map-OnMappinglanguageProprietary ML/R2RMLGraphYesR2RMLGraphYesTable 1 summarizes the main features of the different mapping tools and of the Map-On editor described in this paper. The tools are compared withthe mapping language used (e.g., proprietary language or the R2RML standard), with the graphiclayout to represent mapping elements (e.g., tree andgraph), and whether they provide a complete overview of the mappings generated by the users or not.3. PreliminariesAn R2RML mapping is a set of triples maps thatis composed of a logic table which can be defined asa base table, a view (i.e., a result set of a stored query), or a SQL query; a subject map which defines thesubject of the RDF triples generated from the logictable; and a set of predicate and object maps whichdefines the predicates (i.e., roles) and objects (e.g.,RDF objects) of the RDF triples. The subject andobjects maps describe how the IRIs (Internationalized Resource Identifier) should be generated usingthe columns specified in the logic table and the elements of a target ontology (i.e., concepts, roles andattributes).The manual creation of R2RML mappings requires technical skills in SQL query design and inontology engineering at the same time. The expertswho create the mappings should understand thestructure of the database schemas and the target ontology in order to find correspondences between thecolumns of the relational tables and the ontologyentities. Moreover, users have to design SQL queriesfor the logic tables and the IRI patterns for the subject and object maps.The triples map illustrated in Figure 1 uses a logictable based on a SQL query for the table census. TheIRI of the subject map uses the ID column of thetable and the concept Building. The object map isdefined with the role hasAddress and the columnAddr. The main limitation of R2RML languages isthat in the research community and in the industry,there are certain problems with the adoption ofR2RML. The manual creation of R2RML mappingsis a time consuming process, the mappings are syntactically heavy in terms of R2RML vocabulary (these processes imply to design valid SQL queries, touse the proper terms of the R2RML language, and toselect the ontology concepts and properties), and forthe experts using the language, the steep learningcurve is mainly caused by gaining expertise of thelanguage [17].The mapping editor presented in this paper supports the creation of triples maps by providing visualrepresentation of the mappings and a point-and-clickinterface which enables the user to map the columnsof the tables towards the ontology concepts, roles,and attributes. The IRI patterns and the logic tablesare automatically generated by the tool. mapping1 a rr:TriplesMap;rr:logicalTable [rr:sqlQuery "SELECT ID, Addr FROM census"];rr:subjectMap [rr:template " /building/{ID}";rr:class ex:Building];rr:predicateObjectMap [rr:predicate ex:hasAdress;rr:objectMap [rr:column "Addr"]].Fig. 1. Example of a R2RML mapping.4. Map-On featuresThe main goal of the Map-On tool is to supportusers to create mappings between a database schemaand the existing domain ontology. The tool providesvisualizations of mappings based on a graph layoutfor the database schema and the ontology, an ontolo-
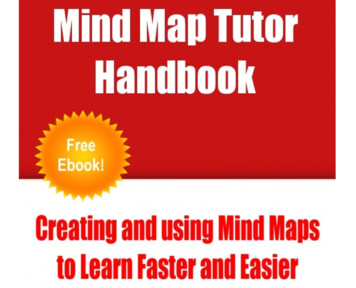
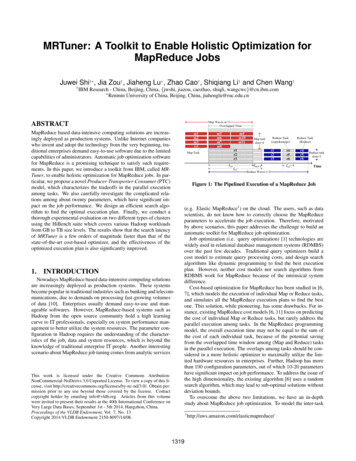
gy mapping interface, and the automated generationof IRI patterns and SQL queries for the R2RMLstatements.4.1. Mapping visualizationDatabase schemas and ontologies are usually represented using a graph layout; a recent prominentexample is VOWL a visual language for visualizingontologies as a force-directed graph layout [12]. Ingraph layout representations of database schemasand ontologies, the node elements (e.g., tables andconcepts) are characterized as nodes and the relations (e.g., primary/foreign key constraints and roles)as edges. The mappings between a database schemaand an ontology are a set of relations between theirelements. That is when, for instance, a column of arelational table is used to define the IRI of a subjectmap and a concept of the ontology is utilized to define the type of the subject map. In this way, it becomes intuitive to represent the mappings graphically as edges between columns and concepts (Figure 2).The Map-On tool represents a table and their columns as purple rectangles connected by a solid purple line. The relationships between tables are displayed with a purple dashed line between foreign keyand primary key constraints. The ontology conceptsare represented as orange ellipses, the roles as directed solid orange lines, and the attributes as greenellipses. The relations between the elements of thedatabase and the ontology are displayed with dashedblue lines. An example of a visual representation ofmappings using a graph layout can be found in Figure 2.After a mapping has been created, the corresponding layout is automatically generated by placing thenodes in a rectangular grid arrangement. As a nextstep, the user can modify the position of the nodes bydragging them to the desired position.Fig. 2. Visual representation of a mapping4.2. Ontology mapping interfaceThe Map-On editor provides the user with a highlevel of assistance in the ontology-database mappingby means of the four following features: point-andclick interface, ontology-driven mapping approach,top-down visualization, and mapping spaces.The Map-On graphic user interface is based on apoint-and-click paradigm in which most of the user’sactions are carried out with the cursor. The mainbenefits of this kind of interfaces are the high comfort factor and the low getting-started-barrier forthose users who lack skills in mapping languagessuch as R2RML.Furthermore, the interface provides easy access tothe elements to be mapped and fosters productivity,as complex mapping tasks can be carried out withfewer actions by the user.Map-On implements the ontology-driven approach for editing the mappings. Namely, the userstarts with selecting concepts of the ontology and asa second step generates R2RML statements by defining the proper logic tables and IRI patterns. An alternative to the ontology driven approach is the database-driven approach which starts with a selection ofdatabase elements followed by the generationR2RML statements through selecting the proper target ontology elements. As stated in [17], none ofthese approaches (i.e., ontology-driven and databasedriven) are better; however users with a backgroundin database can be more familiar with the ontologydriven approach.The Map-On interface provides top-down mapping visualizations (Figure 3). In particular, the elements of the ontology and database schema (i.e.,tables, columns, concepts, roles and attributes) involved in the mapping are visualized in one singlerepresentation as a global view which can be relatedto a set of triples maps in the final R2RML document.This approach helps the user to comprehend bothdatabase and ontology structures at the same time,and therefore to reduce mapping errors and to simplify their maintenance. Furthermore, a list of mappingsis provided in the left side of the interface using thesame colour styles as in the graph representation.When the cursor hovers over one mapping on the list,the node of the graph layout corresponding to thatmapping is highlighted, the same as their neighbourhood nodes. This feature works the other way roundas well, when the cursor hovers over a node of thegraph layout, the corresponding mapping of the listis highlighted.
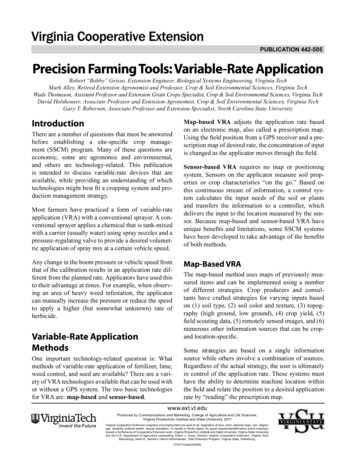
Fig. 3. Map-On main interface. On the left side, a list of mappings is presented on the ‘Net Heat demand’ mapping space. On the right side, aninteractive graphical visualization of the mappings is displayed.Moreover, Map-On facilitates the definition ofmapping spaces. These spaces are partial views of anentire picture of mappings between an ontology and adatabase. Such spaces contain a limited set of ontology and database entities and serve to divide a complex mapping task into a set of less complex andsmaller tasks. This feature is important in scenarioswhere there are a considerable number of elementsinvolved in the mapping.4.3. Automated generation of IRI patterns and SQLqueriesThe Map-On editor automatically generates theIRI patterns and logic tables (i.e., SQL queries) thatare required by the R2RML statements. This is basedon the concepts and columns involved in the mappings created by the user. For example, in Figure 3,when a user maps the concept SUMO:Building to thecolumn ID of the table netheatdemand, the followingIRI and SQL query are generated for defining thesubject map:IRI: base iri /building/{\"netheatdemand.ID\"}SQL: SELECT buildinguse.Building use, netheatdemand.Status, age.Age Class, netheatdemand.ID FROM buildinguse, age, netheatdemandWHERE buildinguse.id netheatdemand.Building use code AND age.Age Class netheatdemand.age idThe IRI is generated based on patterned URIs solution [6]. This pattern was selected considering thatpeople are able to read it and that it is easily generated from a database where identifiers (i.e., primarykeys) are always present. Furthermore, the name ofthe concept is added to the base IRI. In this way, theproblem of generating different individuals with thesame identifier but different concept is mitigated. Inthe above example, the base iri variable is common for all the mappings, the building comes from
the concept of the ontology and netheatdemand.ID isthe column involved in the mapping.The logic tables of the triples maps statements aredefined as SQL queries which are automatically generated by the editor. The editor inspects the mappingscreated by the user for generating a valid SQL queryand takes into account all the possible tables and columns involved in the mapping. In the above example,the SQL query has been generated for the mappingbetween the concepts SUMO:Building and the IDcolumn of table netheademand. In the generation ofthe SQL query the mappings connected through object properties are taken into account, for instance themapping between the concept semanco:Age Classand the column Age Class of the table age. The query retrieves data from three different tables (i.e.,buildinguse, age and netheatdemand) which are connected by constraints defined in the “where” clause.Moreover, the columns involved in the mapping arealso included in the “select” clause.5. Architecture of Map-OnThis section presents the general architecture ofMap-On including the important aspects of everymodule (Figure 4).Fig. 4 Map-On basic architecture.End-user interface. The visualization of the database and the domain ontology by means of a jointgraph representation is one of the strong points of theinterface together with the creation and modificationof the mappings using point-and-click paradigm.Thus, users can change the layout by dragging thegraph nodes making the visualization clearer. Theinterface provides suggestion lists of possible concepts roles, and attributes to be used in the mappings.Moreover, the interface comprises pop-ups with tipsas an integrated help.Source manager. This module provides the methods for loading schemas of the input databases. Theschema is provided as an SQL file. Every databasehas its own mapping spaces with their mappings forproducing a R2RML document.Ontology manager. The domain ontologies arestored in the database of the Map-On tool for increasing the query response performance. The ontologymanager provides functionalities for loading an OWLontology in RDF/XML format and their related ontologies. The module also implements methods forquery specific concepts, roles, and attributes based ona text provided by the user. Finally, the module takescare of the prefixes of the ontology needed for representing the ontology elements by QNames (Qualifiednames).Mapping module. This module is responsible forcreating and storing the mappings defined by the user.Thus, it manages the mapping spaces. The mappingmodule implements the methods for the automaticgeneration of IRI patterns and the SQL queries described in the previous section.R2RML processor. Based on the mappings createdby the user, this module generates a document according to R2RML recommendation. The user canprovide custom mappings which are stored in theMap-On database. Furthermore, the custom mappings are attached to the final R2RML documentgenerated by the processor.User & Log controller. This module tracks the user actions and stores them in the database. The actions are tagged with an identifier depending onwhere the action takes place. For instance, when amapping is created between a concept and a columnof a table, the action is tagged with the identifier ofthe mapping space to which the mapping belongs.Moreover, the actions are tagged with the identifierof the user who carries out the action.Database. The different elements provided or created by the user are stored in the database, specifically the structure of the sources (i.e., table names, column names, column types, and foreign/primary keys),the ontology, and the mappings created. Thus, thegraph layout configurations that are personalized bythe user are also part of the database.
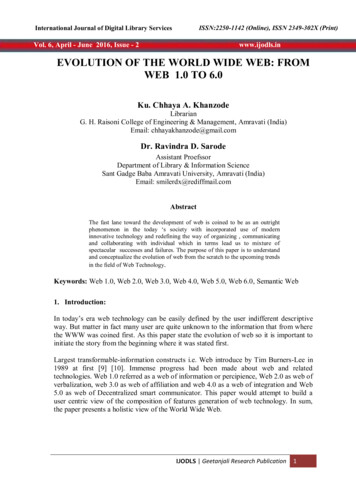
Fig. 5 Map-On interfaces. Left: new mapping creation interface. Right: Object property creation interface.The modules have been developed in PHP usingCode Igniter1, an Open source PHP web applicationframework. The graphic visualizations of the source,the ontology and the mappings have been implemented using the VivaGraphJS 2 , a graph drawinglibrary for JavaScript library. The EasyRDF library3has been used for parsing the ontology files and theAppmosphere RDF classes (ARC) library 4 for theontology storage using MySQL engine. The R2RMLvisualization and text editor use the Codemirror JavaScript library 5 for the turtle syntax highlightingstyle.6. Ontology mapping process with Map-On editorUsers of the Map-On6 editor can carry out an ontology mapping process in a user-friendly interfacewithout worrying about dealing with R2RML coding.The first step of the process is to load the input database and the ontology. The ontology and their imports are stored in the same place in order to reducethe querying time. In order to load the input database,an SQL schema file has to be provided together withthe base IRI to be used in the IRIs of the subject andobject maps of the R2RML ://semanco-tools.eu/map-on2The second step is to define the mapping spaces.Users are free to create any number of mapping spaces, usually parts of ontology that have something incommon are mapped in the same space.The third step is to create the mappings by clickingthe plus button on the top-left side of the interface(Figure 3). In the new mapping page, the graph layout contains an empty node representing an ontologyconcept and the nodes characterizing the structure ofthe input database. The user can search for an ontology concept by typing in the input box (Figure 5, leftscreen). The editor will provide a list of possibleconcepts based on the input given by the user. Oncethe user selects a concept from the list, the node inorange takes the name of the concept. After that, theuser can click a node of the graph representing a column and a mapping –a blue dashed line– will connectthe concept and the column nodes. The tables of thedatabase can be filtered in order to reduce the nodesin the graph visualization by clicking the checkboxeson the bottom-left side of the interface (Figure 5, leftscreen). After these actions the user has established amapping between a concept and a column which corresponds to a subject map statement.The next step is to further elaborate the mappings,particularly with regard to the creation of object mapstatements. The concepts are linked to other concepts,using roles (i.e., object properties) and related to attributes using data properties. The different interfacesare accessible through a dropdown menu which isshown when the cursor moves over the mapping liston the left-hand side of the interface. For an existingmapping, the user can create a role mapping whichwill correspond to an object map statement in the
Fig. 6. An excerpt of the R2RML document generated by Map-OnR2RML document. The user can search the role bytyping in the input box (Figure 5, right screen). Theeditor will provide a list of possible roles whose domain is the previously mapped concept and whichmatch the input text provided by the user. Once therole is selected, the graph visualization is updatedaccordingly and a target concept (i.e., possible rangesof the role) can be selected from the list provided bythe editor. Later, the user can click on a column nodeto map it to the target concept. The process of linkingattributes is similar to the one described for the roles.Finally, when the mappings are created, theR2RML document can be visualized using a turtlesyntax highlighting library (Figure 6). Furthermore,users can write their own mappings. In addition, theR2RML document can be downloaded as a text file.7. User testingWe conducted a user study with five people toidentify usability issues of the tool and to demonstrate that it can be used by non-ontology experts.Participants had a similar profile, they were graduates and post-graduates, experts in data base theorywho use SQL language in their professional activities.The participants did not have any notions of the Semantic Web concept and nor were they familiar withlanguages such as OWL, RDF, SPARQL, andR2RML. Two participants were professors of an engineering school, two participants were industry professionals, and one participant was from the researchcommunity. They took part in the test voluntarily,with no payment for their involvement.7.1. Test designThe test was carried out in a Toshiba Z830 laptop(1.6 GHz, i5, 4GB RAM) with a mouse and a stopwatch. The screen and the voice of the participantswere recorded. The participants were informed ofthis beforehand.The test has been administered by just one person.All testing sessions were approximately fifty minuteslong. The participants were given a brief introductionto the Semantic Web. The concept of ontology wasexplained as well as the main features of the Resource Description Format. Furthermore, a R2RMLmapping was shown to users. Finally, the purpose ofthe Map-On tool and its main features were introduced to the participants.A pre-test questionnaire was submitted to assessparticipant’s expertise on relational databases andSemantic Web technologies. After completing thetasks, the participants filled a satisfaction questionnaire aimed at measuring their subjective satisfactionwith regard to the Map-on tool interface. Participantsanswered a five-level Likert scale. Participants wereasked to use the tool while continuously thinking outloud. That is, verbalizing their thoughts as they werecarrying out the tasks.The domain of the tasks was research conferences(e.g., authors, committees, papers, abstracts ). Thisdomain is easy to understand for the participantswithout teaching them basic concepts and their inter-
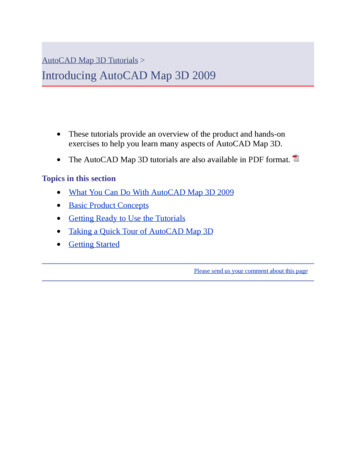
relations. Both the ontology and the database weretaken from the RODI benchmark [18] and were already uploaded to the tool. The user test was composed of three tasks, each involved mapping a classof the domain ontology and an element of the database. The tasks were designed to carry out mappingswhich ranged from simple to complex. The taskswere to 1) relate authors, 2) relate authors with thesubmitted papers, and 3) relate conferences withtheir committees. Tasks were carried out sequentiallyand the participants had to confirm the task finalization by themselves without the validation of the testadministrator.The usability metrics used to evaluate the test werethe effectiveness metric with the accuracy measure –percentage of tasks correctly completed– and theefficiency metric with the completion time which isthe time taken to complete the tasks.7.2. ResultsFigure 7 summarizes the overall results for eachusability metric obtained in the three tasks. The accuracy was obtained by calculating the sum of the participants that successfully completed the task dividedby the number of participants. The completion timewas calculated as the time mean in minutes that eachparticipant took to complete the task.Completion time (minutes)Accuracy100%2080%1560%11040%520%0%0Task 1 Task 2 Task 3of Task 1 and 3 lies in the lack of knowledge of howto work with ontologies –in particular when referringto the creation of object properties to connect concepts of an ontology– and how to use the tool sincethey were not trained beforehand. The completiontime of Task 3 was slightly below the time of Task 1because participants have learned how to use the tool.The average completion time for Task 2 was muchhigher than the other two tasks. The main reason wasthat participants found it difficult to create objectproperties because some messages and warning displayed in the user interface were not clear enough.Indeed, some participants felt confused and lost.Even so, the participants completed quicker Task 3which also implied object property creation
RBA (R2RML By Assertion) tool also uses a tree layout to display the mappings and supports R2RML [14]. The limitation of these tools lies in the exploita-tion of the tree layout for visualization. Such a layout is unable to represent the complete structure of the database schema, ontology and mapping by itself