Transcription
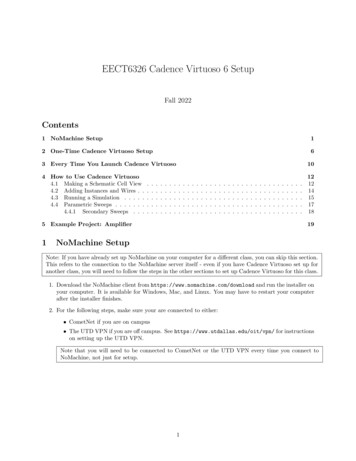
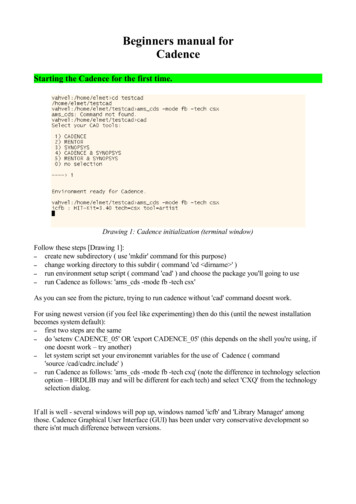
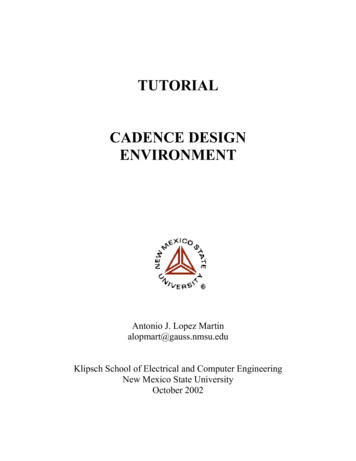
Virtuoso Visualization and AnalysisOptimized display, measurement, analysis, and debug of simulation resultsCadence Virtuoso Visualization and Analysis is a waveform display and analysis tool thatefficiently and thoroughly analyzes the performance of analog, RF, and mixed-signal designs.Integrated with the industry-leading Virtuoso custom design platform, it provides a comprehensiveset of capabilities to display, measure, analyze, and debug simulation results, and to createdocumentation for design reviews. Developed using the latest software technologies, VirtuosoVisualization and Analysis is optimized for fast loading of large datasets.Virtuoso Custom DesignPlatformVirtuoso Visualization andAnalysisThe unified Virtuoso custom designplatform utilizes the latest in modernuser interfaces and design toolintegration advances to bring unprecedented levels of productivity to designcreation, verification, and implementation.Integrated with Virtuoso AnalogDesign Environment and VirtuosoMulti-Mode Simulation, VirtuosoVisualization and Analysis providesbuilt-in support for all Virtuososimulators to completely analyzeand fully explore analog, RF, andmixed-signal designs. With built-inmeasurement tools and toolboxes,designers can quickly visualize manydesign performance metrics, detectcircuit problems, and acceleratedesign debug.Backed by the largest numberof process design kits (PDKs)available from the world’s leadingfoundries—for process nodes from0.35µm to 20nm, and everything inbetween—the Virtuoso platform isbuilt on the OpenAccess database,engineered by Cadence for industrywide interoperability.The Virtuoso platform acceleratesthe design of custom ICs acrossvarious process nodes. By selectively automating aspects of customanalog design and providing advancedtechnologies integrated on a commondatabase, the platform allowsengineers to focus on precision-craftingtheir designs—without sacrificingcreativity to repetitive manual tasks.Figure 1: Virtuoso Visualization and Analysis advanced user interface
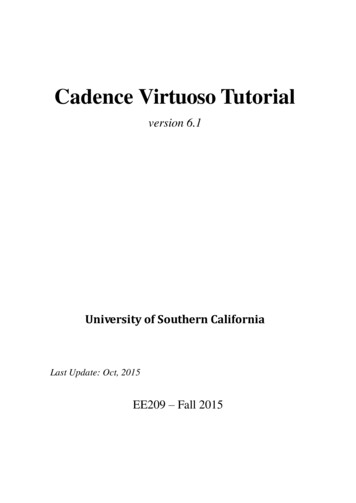
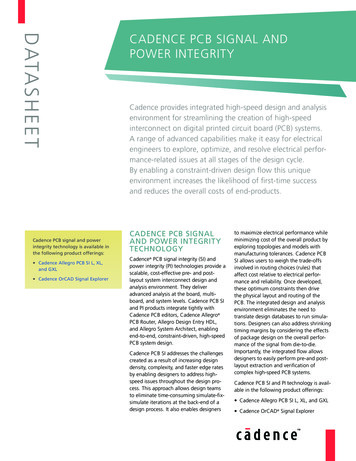
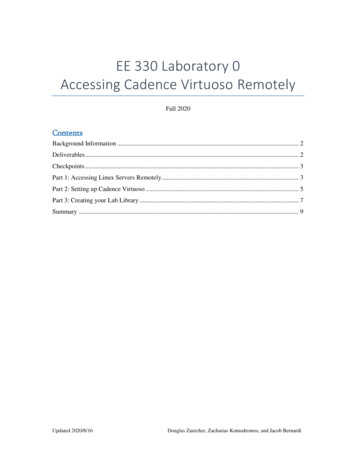
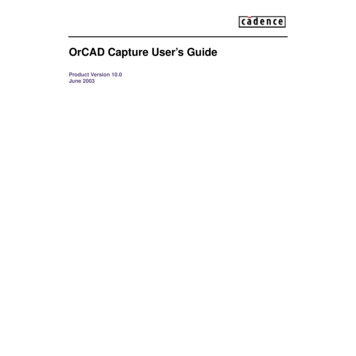
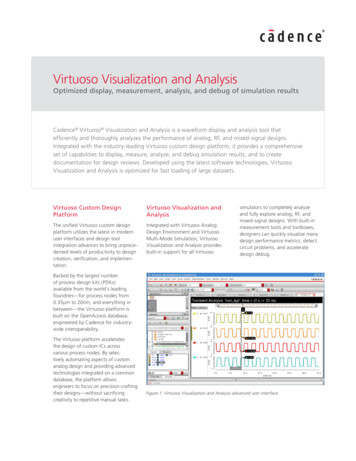
Virtuoso Visualization and AnalysisFeatures such as spec markers, deriveddata plots (e.g. change-independentvariables), automatic edge base measurements, scalar measurements, WREALplotting, and refresh plotting enable usersto easily calculate many design metricsused in analyzing a wide range of analog,RF, and mixed-signal designs.Toolboxes and assistantsMeasurement toolboxes and assistantsallow users to simplify specific measurements for a wide range of waveformanalysis tasks. They enable users tocapture waveforms and create documentsfor design reviews more accurately andproductively.Figure 2: Variable sweepsPost-processing and scriptingBenefitsEase of use High-performance waveform databaseoptimized for fast loading of largeamounts of simulation dataTight integration with Virtuoso SchematicEditor and Virtuoso Analog DesignEnvironment enables users to easily plota wide range of analog, RF, and mixedsignal design waveforms. An advanceduser interface, drag-and-drop mechanism,built-in measurement toolboxes, customizable workspaces, and many moreproductivity-enhancing tools providedesigners with an efficient waveformplotting and measurement tool. Extensive mixed-signal displaycapabilities for efficient data visualization Single waveform tool for all Virtuososimulators Seamless integration with the industryleading Virtuoso custom designplatform Refresh plotting (customized waveformdisplay set-up and refresh with newdata set after each simulation) SKILL and OCEAN programmingfor complex user-developedpost-processing scriptsWaveform displayVirtuoso Visualization and Analysisprovides many advanced features toquickly plot and analyze waveforms.The Virtuoso custom design platformprovides powerful scripting capabilitiesin the form of OCEAN (Open CommandEnvironment for ANalysis) for fast andefficient analysis of waveforms. OCEANscripts provide users with commandline access to a rich set of functions torun simulations in batch mode and toperform extensive analysis of analog, RF,and mixed-signal designs. This, combinedwith built-in functions such as a calculatorand equation builder, allows designersto measure complex design metrics andvalidate designs for a wide range ofoperating modes and conditions. Customizable calculator with a rich setof functions and featuresKey FeaturesPlatform integrationVirtuoso Visualization and Analysis buildsupon the features and infrastructure ofthe Virtuoso custom design platform,providing a technologically advancedand highly productive user experience.Seamless integration with VirtuosoSchematic Editor and Virtuoso AnalogDesign Environment provides users witha fast and efficient waveform display,analysis, and design debug tool.Figure 3: Smith chartwww.cadence.com2
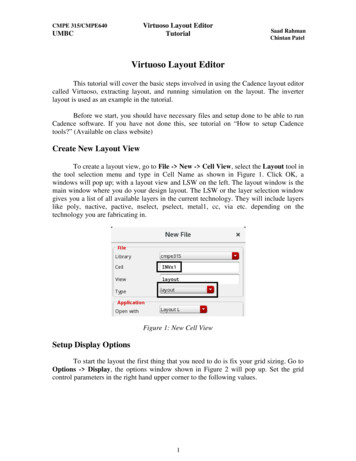
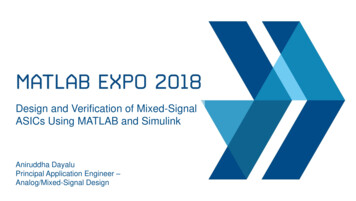
Virtuoso Visualization and Analysison-screen measurement and analysis ofwaveforms. These markers can be lockedto specific coordinates or moved aroundthe waveform and display “X-at-Y” information on screen.MonitorsAn easy-to use model allows usersto place a wide range of markers onwaveforms to perform complex on-screenmeasurements. These monitors includederivative, inverse derivative, delta value,cursor average, min/max/ave, peak-topeak, and RMS values.Figure 4: Bus waveformsWaveform Display Polar plotA user-friendly, advanced interface allowsusers to easily access simulation resultsand plot waveform signals in the displaywindow. The Virtuoso Visualization andAnalysis display can be customized extensively, allowing designers to interactivelyselect display panels, swap independent/dependent variables, create sub-windows,annotate markers, and plot data points inrows and columns in text format. Multi-dimensional sweep with ability toswap sweep variablesThe waveform display includes: Hierarchy browser and signal list Recent files list Drag-and-drop signals onto waveformdisplay windows Multiple windows, sub-windows, andstrip configuration Eye diagram Spectrum Histograms Scatter plots Y/Y plots A-to-D, D-to-A, and busMeasurementsMarkersThe advanced Virtuoso Visualization andAnalysis user interface allows users toplace multiple markers for interactiveWaveform Post-ProcessingA-to-D / D-to-A conversionAnalog waveforms can be converted tosingle-bit or multi-bit digital waveformsusing user-specified threshold values. Alsodigital waveforms can be converted toanalog waveforms based on user-specifiedanalog signal levels using value transitionsampling.Data exportUsers can save waveform data for exportand save the data in different formatssuch as PSF, CSV, Virtuoso CSV (VCSV),SST2, SPICE PWL, and Matlab. Users canexport the entire data or a subset of thedata, helping them reduce the number ofsample points. Zoom and pan capabilities Signal search capability with the abilityto drag-and-drop from search results User-customizable bind keys Customizable workspaces (assistants,toolbars, display settings) Save and restore sessionVirtuoso Visualization and Analysis supportstime and frequency domain waveform typesand statistical plots such as: Analog Digital Smith chartFigure 5: On-screen measurementswww.cadence.com3
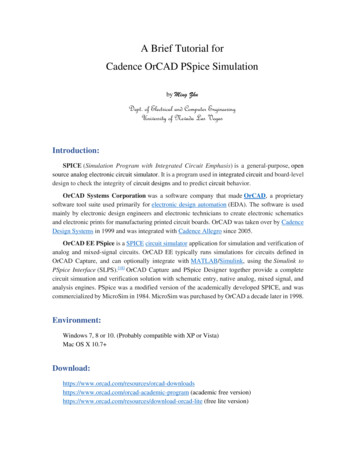
Virtuoso Visualization and AnalysisUsing different sampling techniques, theADC toolbox enables measurement ofparameters SNR, SINAD, SFDR, ENB, noisefloor/bin, noise floor/rtHz, and total andpeak harmonic power.Eye diagram toolboxThe eye diagram toolbox allows usersto easily create eye diagrams fromcomplex waveforms. The eye diagram isconstructed by extracting the clock cycle,or by reference to an ideal clock, or to anexternal signal. The eye diagram assistantcan automatically provide measurementssuch as eye width, height, amplitude,SNR, and level 1 and o standard deviationand mean. Once constructed, theautomatic eye measurement tool canprovide eye opening measurements aswell as create a jitter histogram.Figure 6: A-to-D conversionWaveform Post-Processing withCalculatorUsers of Virtuoso Visualization andAnalysis can perform post-processingcalculations using: Graphical calculator Equation builderThe calculator contains a wide range ofbuilt-in mathematic, logarithmic, RF, andspecial functions and modifiers that canbe applied on signals and waveforms tomeasure various design specifications.Users can save regularly used functionsFigure 7: D-to-A conversionVirtuoso Visualization and Analysissupports FFT and DFT operations on timedomain data using different windowingfunctions, allowing users to computesignal-to-noise ratio (SNR), total harmonicdistortion (THD), signal-to-noise anddistortion ratio (SNDR), and effectivenumber of bits (ENB).Toolboxes and AssistantsSpectrum toolboxThe Spectrum toolbox allows users toanalyze various performance metrics ofanalog-to-digital converters (ADCs). Itallows users to measure various DC staticcharacteristics such as histogram, min/max values, and standard deviations.www.cadence.comFigure 8: Spectrum toolbox4
Virtuoso Visualization and AnalysisPlot output file formats jpeg png bmp pdf svg eps tiffPlatform/OS X86 Linux Sun Solaris IBM AIXFigure 9: Eye diagram toolboxto a favorites folder for easy and efficientaccess. Virtuoso Visualization and Analysisis highly interactive and customizable, andit comes with a powerful equation builderthat allows users to construct equationsto perform complex measurements.Scripting with OCEANOCEAN scripting capability can be usedto perform regression scripting. Thisallows designers to make changes to theirdesign and run a variety of analyses inbatch made, so they can work on otheraspects of the design while the simulations are running. Users can run multipletestbenches and analyses in batch modeand open Virtuoso Visualization andAnalysis at the end of each simulation toanalyze results.The ability to capture waveforms andcreate design documentation combinedwith the ability to share these scriptsacross design teams enables easy, errorfree collection of data for design reviewsand provides design teams with anefficient means of data management.SupportSimulator/input file formats All Cadence and third-party simulators PSF PSF XLwww.cadence.comFigure 10: Calculator5
Virtuoso Visualization and AnalysisCadence Services and Support Cadence application engineers cananswer your technical questions bytelephone, email, or Internet—they canalso provide technical assistance andcustom training Cadence certified instructors teachmore than 70 courses and bringtheir real-world experience into theclassroom More than 25 Internet LearningSeries (iLS) online courses allow youthe flexibility of training at your owncomputer via the Internet Cadence Online Support gives you 24x7online access to a knowledgebase ofthe latest solutions, technical documentation, software downloads, and moreCadence is transforming the global electronics industry through a vision called EDA360.With an application-driven approach to design, our software, hardware, IP, and services helpcustomers realize silicon, SoCs, and complete systems efficiently and profitably. www.cadence.com 2012 Cadence Design Systems, Inc. All rights reserved. Cadence, the Cadence logo, and Virtuoso are registered trademarks of Cadence DesignSystems, Inc. All others are properties of their respective holders.22891 08/12 MK/DM/PDF
database, the platform allows engineers to focus on precision-crafting their designs—without sacrificing creativity to repetitive manual tasks. Virtuoso Visualization and Analysis Integrated with Virtuoso Analog Design Environment and Virtuoso Multi-Mode Simulation, Virtuoso Visualization and Analysis provides built-in support for all Virtuoso