Transcription
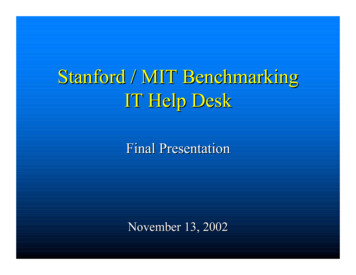
Stanford / MIT BenchmarkingIT Help DeskFinal PresentationNovember 13, 2002
AgendaProject Goals Help Desk Benchmarking – Goals & benchmark metrics– Initial data comparisons– Findings & hypotheses– Quick wins and lessons– Tools and timelines to get there Benchmarking as a Methodology1/5/052
Benchmarking Project Goals Help Desk Specific– Enable comparisons between institutions– Develop ongoing management tool»»» Determine metricsDevelop initial comparisons & findingsIdentify tools needed, future plansBenchmarking in Higher Education––––Enable comparisons among schools and industryDevelop methodologyProvide a test-caseDevelop strategy to expandSee additional context in Appendix 1 Project History & Goals1/5/053
Benchmarks must tie tomanagement goals1.2.3.4.5.6.7.1/5/05Support client needs with quality serviceBe responsiveBe cost effectiveProvide appropriate level of investmentDevelop effective, mature processesMaintain high-performing, competent teamSupport rollout of new systems4
Goals must tie to specific metricsInvest Appropriately % of budget Clients served/FTEBe Cost Effective Cost per case by topic Total costs by topic Cases by media, includingself-helpBe Responsive Elapsed time per case Call abandonment Hold time Time to answerSupport Rollout of New Systems Case volume by topic 3 monthsbefore and after launch Minutes per case1/5/05Support Customer Needswith High Quality Service Annual customer survey Spot-surveys on selectedtransactionsDevelop High Performing,Competent Teams Employee satisfactn survey Individual perf. metrics Team performance metrics Training / FTE % Help Desk certification Case volume compared tostaff skills mixDevelop Effective, Mature Processes # of contacts vs. # of days to resolve Origin of Help Desk casesSee Appendix 6 for discussion of specific data elements to calculate benchmarks5
Caveat:Best benchmarking is yet to come Problems with historical data– Assumptions– Extrapolations– Simply missing some dataSimilar but very different operations Common metrics going forward Don’t focus too heavily on current data;look to future! 1/5/056
Context for Comparison: Help Desk OperationsMITStanfordOrganization Consolidated unquantified Distributed support modelsupport in acad. depts.across ITSSStructureSingle unit; junior/seniorTier 1 & 2mixed; informal limit 15 min (10 min limit Tier 1)LocationOfficesStaffingACDToolMediaSingle, separate locationMultiple, distributedCubes “call center”Individual offices2-4 hour blocks; many stdtsFull-time assignments4 phone numbers1 published #, then phone treeHome-grown JavaCustomized RemedyHeavy email 50% Heavy Web-form1/5/05See more details in Appendix 3. “How Each Help Desk Works”7
Context for Comparison: FY 02 339%Total Population19,43424,96528% 1,535,949 1,937,90026%Annual Base Budget x x 183%Full Time Staff (FTE)270430 159%With StudentsNo Students x x 227.318.6 2-32%43,55356,125 229%DemographicsFaculty & StaffUniversity Consolidated BudgetVarianceIT Department InformationHelp Desk InformationAnnual Base BudgetFull Time Staff (FTE)Tickets Processed5%1 Includes providing telecommunications for Stanford’s hospital2 Does not include Student Help Desk due to no tracking/ticketing system.Approximate increase with students would be 275K and 5 or 6 FTEs.1/5/058
Gauging investment and effectivenessVarianceMITStanfordIT Dept Budget / University Budget2.9%4.2%Help Desk Budget / IT Budget4.2%2.3%Tickets / School Population2.242.25 10%Population per HD Employee7121,342 189%1,5953,01789% 41.83 33.92-19%Tickets / Help Desk FTEHelp Desk Budget / Ticket11/5/05This ratio’s meaningfulness is affected because it does not include Student Help Desknumbers due to no tracking/ticketing system.9
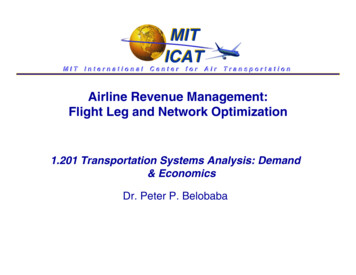
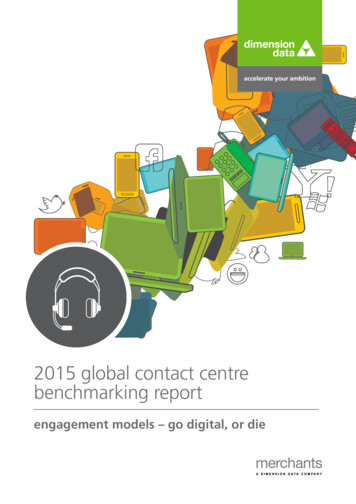
MITSee supporting data in Appendix 9eb pp 180ConsinsupcksAessinBuBuBantouccAGoal: Be cost effective 200Cost per Ticket 160 140Stanford 100 80 60 40 20 0
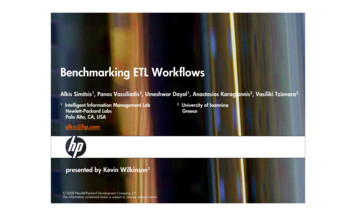
ccounBu Ba tssin ckes upBu ssin Apes pssFunC cC luon stne erC ctivouirs tyewareEmHar ailO dS waSo reftwareOthD Pr eresk intiSnSe oft gcu warrity e/VirusWebAAnnual CostGoal: Be cost effective 480,000 400,0001/5/05Total Annual Cost byHelp Desk Topic 320,000 240,000MITStanford 160,000 80,000 0See supporting data in Appendix 911
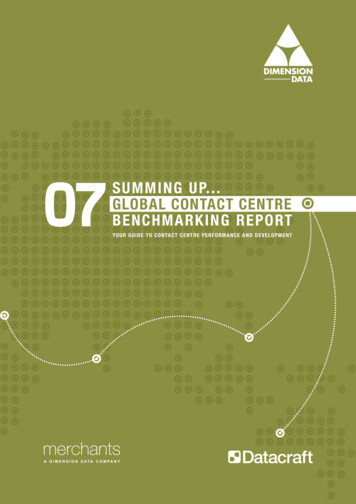
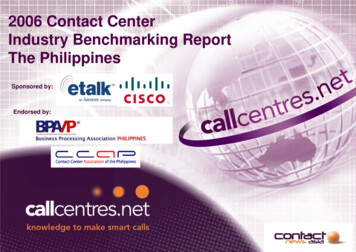
's/AuBu Ba ths A ckuBu pp ps. SuFu ppnc ttionsCC lusontne erC ctivours ityewareEmHar ailO dS waSo reftwareOthPrP erod rinuc tinSe tivi gcu tyri SWty/VirusWeb/IDtsccACases & ComplexitysGoal: Be cost effective12000MIT First Contact Helpdesks10000Estimated Complexity of Case800060001/5/054-101-40-1400020000See supporting data in Appendix 912
D's/AuthBBuas A ckpp upBuSus.Fu pptnctionsCCo lusnn terectivCoityursewareEmaiHlardOwaSSo reftwareOtherPrProdiuc ntintivgitySeSWcurity/VirusWebts/IAccCases & ComplexityGoal: Be cost effective20000100001/5/05Stanford Helpdesks:Tier Where Resolved15000OtherLevel 2Level 150000See supporting data in Appendix 913
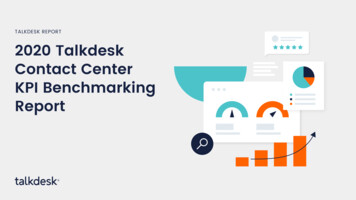
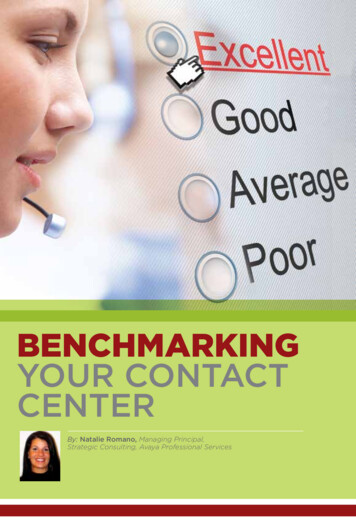
Goal: Support rollout of new systems7,000Impact: New Business ApplicationsNumber of Trouble Tickets6,0005,000ITSS Help DeskLevel 1HR SalarySettingMay4,000Kronos/HRPeople SoftJan.3,000ITSS Help DeskLevel 2LegacyApplicationsAxess Probs.March2,000Rollout NewApplications1,000Total HelpTickets-ASONDJF12 Months FY02MAMJJSome rollout application ticketsincluded in HDLevels 1 & 2.See supporting data in Appendix 9 (Stanford data only).1/5/0514
Preliminary data offers initial observations Implementation choices affect Help Desk costs– MIT» Email» Connectivity to desktop» Security, Kerberos – Stanford» Accounts, authentications» Business apps“Time is money.” Topics are expensive when theyare complex, must escalate, or relate to uniqueapplications– Specialists are required more frequently for unique,proprietary issues System rollouts create overall spikes and some dipsin specific areas1/5/0515
Initial observations Student employees» MIT Help Desk employs more students at a lower overallbudget» More FTEs but difficult now to gauge overall effectiveness ofusing students Structured tiers:» Using structured tiers may support a greater number of cases» Resolving at Tier 1 significantly reduces costs» You can either “tier the work” through process choices, or can“tier the staff” to handle only certain types of work “Media” of case submission may affect costs» Web submission may support greater number of cases/FTE1/5/0516
Goal: Be responsiveResponsiveness to Phone CallsTimeAveragebeforeAverageTimeAbandonSpeed toCallerCallbetween AverageRateAnswerAbandons Length# of CallsCalls(seconds)%(seconds) (seconds) (for staffer) MonthlyStanfordTier 1 only5117%68252(4.2 min)4513%99415(6.9 min)59.54%4.9 min4032Jan-Aug 02MITAll desks2039Jul 01–01– Jun 02HDI IndustryComparisonsSpeed to Answer Abandon rate Call Length Time between Calls 1/5/055 min.Time a call waited before being answered by a person.% of calls where customer hung up; includes callers that hung up after reaching voice mail.Time from when a call is answered to when it is released.Time between calls that an ACD agent handles. Agent closes out ticket before getting back in queue to receive calls.17
Goal: Support customers with high quality serviceCustomer satisfaction appears comparable acrossinstitutions.MIT Computing Help Desk (All Levels) and Stanford Help Desk (Level 1)"Snapshot" Surveys after Recently Closed CasesAnnualized AverageTimeliness ofResponseQuality ofResolution5.05 Point Likert Scale4.0Courtesy Satisfaction1.00.0MIT 2001Improvement effortsdo bear fruit asshown in MIT’stwo annual surveyresults.MIT Computing Help Desk (All Levels)from IS Annual Customer Satisfaction SurveysTimeliness of ResponseQuality of ResolutionCourtesy and ProfessionalismTechnical CompetenceOverall SatisfactionAbility to Get ThroughTurnaround Time5.0Likert Scale SU 20024.03.02.01.00.020002002See supporting data in Appendix 51/5/0518
Goal: Develop effective, mature processesThe vast majority of cases are resolved quickly.Help Desk OverallTime to Close Cases -- Help Desk5000100.00%450090.00%40400080.00%353500 30.00%1010005500CasesDays to CloseCase neglected orCustomer unresponsive252000102030n of Interactions40508.46% 9.23% 10.95%20.00%4.09% 3.40% 2.35% 10.00%0.00%137142131MoreDaysDesirable1/5/0519
Goal: Maintain high-performing, competent teamIndividual performance can vary greatly;must consider Hawthorne effectStanford IT Help Desk(Level 2)Hours Logged FY02130Managers D294Staff Member C (75%)Staff Member A414461Staff Member I532Staff Member E (55%)Staff Member B623Staff Member H (80%)630Staff Member G6761086Staff Member F01/5/052004006008001000120020
Goal: Maintain high-performing, competent teamMore team or employee-related metrics aredesirable but need more high level discussion Employee satisfaction survey Customer satisfaction tied to individualservice providers Individual performance metrics– MIT already tracks by team– Stanford tracks by individual Help Desk Certifications– Behavioral and/or technical competencies1/5/0521
Initial performance data also yields someobservations Customer satisfaction» Appears comparable across both institutions» Improvements efforts did increase satisfaction over 2 years (MIT) Process effectiveness» Better categorization, identification of the work may help with fasterescalation. Get to the “right place” faster.» Vast majority are resolved quickly Employee performance» Can vary significantly among individuals» Metrics do affect behavior (Stanford)1/5/0522
The data also raise good questions Processes– Which cases should be escalated more quickly?– Should you tier the “work” or the “organization?”– How does web-submission affect cost? Staffing– Is student employment effective?– What additional training should “tier 1” receive?– How should each institution use employee performance data? Support intensive systems– Should support intensive systems be replaced?– How can we help with new system design to minimize Help Deskrequirements? Investments to improve efficiencies– Which tools should we acquire to improve performance?1/5/0523
Quick Wins for ImplementationMITStanfordIn PlaceQuick WinQuick WinIn PlaceQuick WinQuick WinIn PlaceQuick WinQuick WinIn PlaceQuick WinQuick WinQuick WinQuick Win Generate & review weekly metric reportsQuick WinQuick Win Generate weekly “standards”standards” for tickets processed or time spentand use as part of individual performance managementNot quickQuick WinIn PlaceQuick WinTracking Track tickets at student-staffed Unix deskTrack internal hand-offs or “tiers/escalations” explicitlyStandardize work reporting categoriesTrack type of media for each caseConsolidate reporting functions into one ticket systemExamine excess ticket counts in specific categoriesCustomer feedback Initiate or increase transaction-based “spot” surveysProactively use dataReconfigure Space 1/5/05Reconfigure space and move staff to allow for more efficienciesand collaboration24
Next Phase of Help Desk BenchmarkingMITStanfordSoftware or Hardware Investments Scope Remedy changes needed for bmarking;bmarking; engage consultantCasetracker to allow consultant to track touch minutes per case andescalations (tiers) both within and outside HDKnowledge Management system Pilot use to help HD staff retrieve standard answers Evaluate usefulness of client use (self-help)ACD “call-board”call-board” to display calls waiting in queueCreate “dashboard”dashboard” reports and process for regular reportingSelf-serve password reset toolsNext PhaseNext PhaseNext PhaseNext PhaseNext PhaseNext PhaseIn PlaceNext PhaseNext PhaseNext PhaseLong TermNext PhaseNext PhaseNext PhaseIn PlaceNext PhaseCustomer feedback Collaborate on annual customer survey Define process for using customer survey responsesManagement Create cross-functional ITSS team for Delphi rolloutInstitute regular review of metrics with financeCreate Help Desk “Standard Oprtng Procdrs” & HandbkNext PhaseNext PhaseNext PhaseIn PlaceNext PhaseNext PhaseNext PhaseLong TermNext PhaseHigh Performing Team 1/5/05Solicit employee feedback for process and job improvementTrack % of HD Certifications and training per employee25
Cost to Implement MetricsSoftware or Hardware InvestmentsNext 6 monthsMIT StanfordRemedy consultant to program changesCasetracker consultant 75KKnowledge Management systemPilot use to help HD staffEvaluate use of client self-serve 300K 300KACD “call-board” to display queued calls 15KSelf-serve password reset tools 60KJoint customer satisfaction survey1/5/05 60K 10K 10KCreation of Standard Operating Procedures 32KSelf Creation of Dashboard 15K26
Stanford: Help Desk Dashboard – MONTHLYCases by MediaTO BE DEVELOPEDCustomer Satisfaction - Spot Ticket Surveys8765432105EmailCallsWalk-InSelf-Help43IT Help DeskTech SupportStudent21JF M A MJJASOND0CourtesyOverall SatisPhone-In StatisticsLevel 1 Help Desk# of Tickets Created by Employee - on10987Another Metric65Time to Answer0543Call Length (Tier 2)2ActualGoalHold 80%60%40%Tier 3Tier 2Tier 120%0%eW100%TWPrS intWS W O-P SersonalHrtheilOamEsuBuAAppCS lue scu trt ery/ViC rusonnD eca tvta tyBackupAccouthnotrityID0% Problem ResolutionProblems by Cause - Tier 1 -- for Month of XXXXX727
MIT: Help Desk Dashboard – MONTHLYMIT First Contact Help DesksMIT First Contact HelpdesksCases By Method60%1200050%40%10000Cases / 2020202024000Jun- Jul-02 O BE DEVELOPEDCustomer Satisfaction - Spot Ticket SurveysSimple (Tier 1)Specialist (Tier 2)Referral (Tier 3)uctivOitySSoftPrwinaretingerthOarwftSoardwa
1/5/05 2 Agenda Project Goals Help Desk Benchmarking –Goals & benchmark metrics –Initial data comparisons –Findings & hypotheses –Quick wins and lessons –Tools and timelines to get thereFile Size: 885KBPage Count: 29