Transcription
irline Revenue Management:Flight Leg and Network Optimization1.201 Transportation Systems Analysis: Demand& EconomicsDr. Peter P. Belobaba
MITICATLecture Outline1. Overview of Airline Pricing Differential Pricing TheoryFare Restrictions and Disutility2. Revenue Management Systems3. Overbooking Models4. Single-leg Fare Class Seat Allocation Problem EMSRb Model for Seat Protection5. Network Revenue Management Origin-Destination Control MechanismsNetwork Optimization Methods2
MITICATDifferential Pricing Theory Market segments withdifferent “willingness topay” for air travel Different “fare products”offered to business versusleisure travelers Prevent diversion bysetting restrictions onlower fare products andlimiting seats available Increased revenues andhigher load factors thanany single fare strategy3
MITICATTraditional Approach: Restrictions onLower Fares Progressively more severe restrictions on low fareproducts designed to prevent diversion: Lowest fares have advance purchase and minimum stayrequirements , as well as cancellation and change fees Restrictions increase the inconvenience or “disutility cost” of lowfares to travelers with high WTP, forcing them to pay more Studies show “Saturday night minimum stay” condition to be mosteffective in keeping business travelers from purchasing low fares Still, it is impossible to achieve perfect segmentation: Some travelers with high WTP can meet restrictions Many business travelers often purchase restricted fares4
MITICATRestrictions Help to Segment DemandFare Dollar Advance Round Sat. NightCode Price Purchase Trip? Min. StayYBMQ 400-- 200 7 day Yes 150 14 day Yes 100 21 day Yes--YesYesPercent NonRefundable-50 %100 %100 % Businesspassengers unwilling to stay overSaturday night will not buy M or Q. RM system protects for Y, B demand but keepsM,Q classes open without losing revenue.5
MITICATExample: Restriction Disutility Costs6
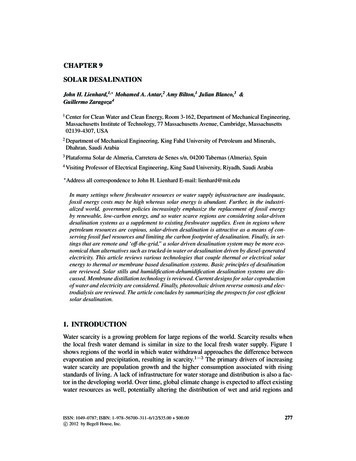
MITICATBOS-SEA Fare StructureAmerican Airlines, October 1, 2001Roundtrip Cls Advance Minimum ChangeFare ( )PurchaseStayFee?458N 21 days Sat. NightYes707M 21 days Sat. NightYes760M 21 days Sat. NightYes927H 14 days Sat. NightYes1001H 14 days Sat. NightYes2083B3 /Wed/SatTue/WedThu-MonTue/WedThu-Mon2 X OW Fare2 X OW FareFirst Class7
MITICATYield Management Revenue Management YM assumes a set of differentiated fare classes andavailable flight capacity as given: Forecast future booking demand for each fare product Optimize number of seats to be made available to each fare class Optimal control of available seat inventory: On high demand flights, limit discount fare and group bookings toincrease overall yield (average fare) and revenue. On low demand flights, sell empty seats at any low fare toincrease load factors and revenue. Revenue maximization requires a balance of yield and load factor Most airlines now refer to “Revenue Management”(RM) instead.8
MITICATTypical 3rd Generation RM System Collects and maintains historical booking data byflight and fare class, for each past departure date. Forecasts future booking demand and no-show ratesby flight departure date and fare class. Calculates limits to maximize total flight revenues: Overbooking levels to minimize costs of spoilage/deniedboardings Booking class limits on low-value classes to protect high-fareseats Interactive decision support for RM analysts: Can review, accept or reject recommendations9
MITICATThird Generation RM SystemRM DatabaseRevenueDataHistoricalBookingsNo ShowDataActualBookingsForecastingModelsBooking LimitOptimizationBookings okingModelBooking LimitsRM Models10
MITICATRevenue Management Techniques Overbooking Accept reservations in excess of aircraft capacity to overcomeloss of revenues due to passenger “no-show” effects Fare Class Mix (Flight Leg Optimization) Determine revenue-maximizing mix of seats available to eachbooking (fare) class on each flight departure Traffic Flow (O-D) Control (Network Optimization) Further distinguish between seats available to short-haul (oneleg) vs. long-haul (connecting) passengers, to maximize totalnetwork revenues11
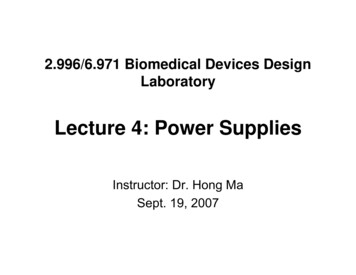
MITICATFlight Overbooking Determine maximum number of bookings to acceptfor a given physical capacity. Minimize total costs of denied boardings andspoilage (lost revenue). U.S. domestic no-show rates can reach 15-20 percentof final pre-departure bookings: On peak holiday days, when high no-shows are least desirable Average no-show rates have dropped, to 10-15% with more farepenalties and better efforts by airlines to firm up bookings Effective overbooking can generate as much revenuegain as fare class seat allocation.12
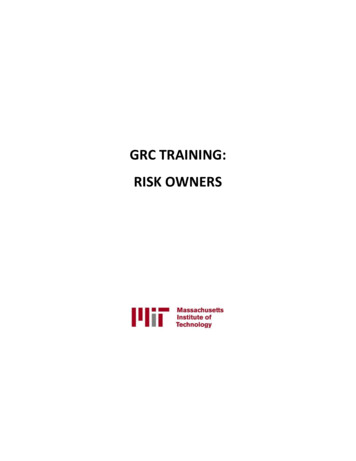
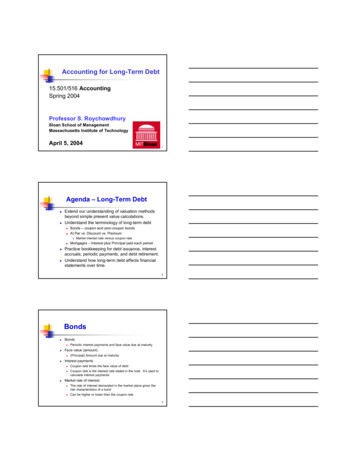
MITICATCost-Based Overbooking Model Find AU that minimizes :[Cost of DB Cost of SP] For any given AU:Total Cost DB * E[DB] SP * E[SP] DB and SP cost per DB and SP, respectivelyE[DB] expected number of DBs, given AUE[SP] expected number of SP seats, given AU Mathematical search over range of AU values to findminimum total cost.13
MITICATCost-Based Overbooking ModelMinimize total cost of expected Denied Boardings plus Spoiled SeatsDenied Boarding and Spoilage Costs 7,000 6,000OptimalAU 123COST 5,000DB 4,000SP 3,000TOT 2,000 1,000 0100105110115120125130135140145150AUTHORIZED LIMIT (AU)14
orthAmSotedAlaskaUniranBlueAirTJetMITICAT2007 US Involuntary DBs per 10,00032.521.510.5015
MITICATFlight Leg Revenue Maximization Given for a future flight leg departure date: Total remaining booking capacity of (typically) the coachcompartment Several fare (booking) classes that share the same inventory ofseats in the compartment Forecasts of future booking demand by fare class betweencurrent DCP and departure Revenue estimates for each fare (booking) class Objective is to maximize total expected revenue: Protect seats for each fare class based on revenue value, takinginto account forecast uncertainty and probability of realizing theforecasted demand16
MITICATBL1 CapSerially Nested Buckets}BL2Protected for class 1 from class 2,3,.,N}Protected for classes 1 and 2 fromclass 3,4,.,NBL317
MITICATEMSRb Model for Seat Protection:Assumptions Modeling assumptions for serially nested classes:a) demand for each class is separate and independent of demand inother classes.b) demand for each class is stochastic and can be represented by aprobability distributionc) lowest class books first, in its entirety, followed by the next lowestclass, etc.d) booking limits are only determined once (i.e., static optimizationmodel) Problem is to find protection levels for higher classes,and booking limits on lower classes18
MITICATEMSRb Model Calculations To calculate the optimal protection levels:Define Pi(Si ) probability that Xi Si,where Si is the number of seats made available to class i, Xi isthe random demand for class I The expected marginal revenue of making the Sthseat available to class i is:EMSRi(Si ) Ri * Pi(Si ) where Ri is the average revenue (or fare)from class i The optimal protection level, 1 for class 1 from class2 satisfies:EMSR1( 1) R1 * P1( 1 ) R219
MITICATExample CalculationConsider the following flight leg example:ClassMean Fcst. Std. Dev.FareY1031000B155700M207500Q3010350 To find the protection for the Y fare class, wewant to find the largest value of Y for whichEMSRY( Y ) RY * PY( Y ) RB20
MITICATExample (cont’d)EMSRY( Y ) 1000 * PY( Y ) 700PY( Y ) 0.70where PY ( Y ) probability that XY Y. Assume demand in Y class is normally distributed,then we can create a standardized normal randomvariable as (XY - 10)/3:for Y 7, Prob { (XY -10)/3 (7 - 10)/3 } 0.841for Y 8, Prob { (XY -10)/3 (8 - 10)/3 } 0.747for Y 9, Prob { (XY -10)/3 (9 - 10)/3 } 0.63 Y 8 is the largest integer value of Y that gives aprobability 0.7 and we will protect 8 seats for Y class.21
MITICATGeneral Case for Class n Joint protection for classes 1 through n from class n 1X1,n n Xii 1n ˆ 1 , n ˆ2i 1inR 1,n i 1Ri * XXi1,n We then find the value of n that makesEMSR1,n( n ) R1,n * P1,n( n) Rn 1 Once n is found, set BLn 1 Capacity - n22
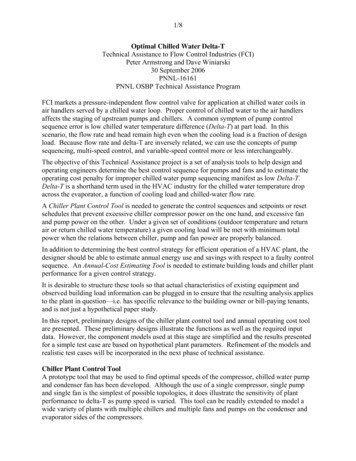
MITICATEMSRb Seat Protection ModelCABIN CAPACITY AVAILABLE SEATS BOOKING AVERAGECLASSFAREYMBVQL SUM670550420310220140135135SEATSBOOKEDFORECAST ROTECT LIMIT7869101462337629513512911298734023
MITICATDynamic Revision and Intervention RM systems revise forecasts and re-optimizebooking limits at numerous “checkpoints”: Monitor actual bookings vs. previously forecasted demand Re-forecast demand and re-optimize at fixed checkpoints or whenunexpected booking activity occurs Can mean substantial changes in fare class availability from oneday to the next, even for the same flight departure Substantial proportion of fare mix revenue gaincomes from dynamic revision of booking limits: Human intervention is important in unusual circumstances, suchas “unexplained” surges in demand due to special events24
MITICATRevision of Forecasts and Limits asBookings AcceptedCABIN CAPACITY AVAILABLE SEATS BOOKINGCLASSYMBVQLAVERAGEFARE SUM67055042031022014013563SEATSBOOKEDFORECAST GPROTECT LIMIT57256451927406363584436230Higher than expected Qbookings close L class25
MITICATNetwork RM: O-D Control Advanced airlines are developing O-D control afterhaving mastered basic leg/class RM controls Effective leg-based fare class control and overbooking alone canincrease total system revenues by 4 to 6% “The capability to respond to different O-D requestswith different seat availability.” Effective O-D control can further increase totalnetwork revenues by 1 to 2% Depends on network structure and connecting flows O-D control gains increase with average load factor But implementation is more difficult than leg-based RM systems26
MITICATO-D Control Example: Hub NetworkBOSNRTDeep Discount Q FareBOS-NRT 800Full Y FareBOS-ATL 500ATLDiscount M FareBOS-MEX 650MEXFull Y FareATL-MEX 40027
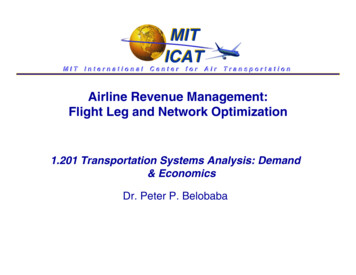
MITICATMarginal Value of Last Seat on a Leg Marginal value concept is basis of leg RM: Accept booking in fare class if revenue value exceeds marginalvalue of last (lowest valued) remaining available seat on the flightleg In network RM, need to estimate marginal networkvalue of last seat on each leg: Can be used as “displacement cost” of a connecting vs. localpassenger Or, as a minimum acceptable “bid price” for the next booking oneach leg2828
MITICATMarginal Network Value of Last SeatEMSR( )ODF #1ODF #1,2EMSRcODF #1,2,30AvailableSeatsSeats2929
MITICATDisplacement Cost Concept Contribution of an ODF to network revenue on a legis less than or equal to its total fare: Connecting passengers can displace revenue on down-line (orup-line) legs Given estimated down-line displacement, ODFs aremapped based on network value: Network value on Leg 1 Total fare minus sum of down-line legdisplacement costs Under high demand, availability for connecting passengers isreduced, locals get more seats30
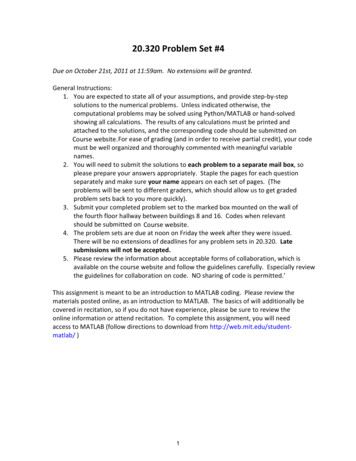
MITVirtual Class Mapping with DisplacementICATFARE VALUES BY ITINERARYNCE/FRACLASSYBMQVFARE (OW)NCE/HKG (via FRA)CLASSFARE (OW) 450 380 225 165 135YBMQVNCE/JFKCLASS 1415 975 770 590 499YBMQV(via FRA)FARE (OW) 950 710 550 425 325MAPPING OF ODFs ON NCE/FRA LEG TO VIRTUAL VALUE CLASSESVIRTUALCLASS12345678910REVENUERANGE1200 150-1990 - 149MAPPING OFO-D MARKETS/CLASSESY NCEHKGB NCEHKGY NCEJFKM NCEHKGB NCEJFKQ NCEHKGM NCEJFKV NCEHKGY NCEFRAB NCEFRAQ NCEJFKV NCEJFKM NCEFRAQ NCEFRAV NCEFRADisplacementAdjustment31
MITICATBid Price Concept Marginal value of last seat can also represent theflight leg “Bid Price”: A minimum “cutoff” value required to accept a booking request For a single-leg itinerary, a request is accepted if thecorresponding fare is greater than the bid price for the leg. For a multi-leg itinerary, the ODF fare must be greater than thesum of the bid prices of all flight legs used by the itinerary. Much simpler inventory control mechanism thanvirtual buckets: Simply need to store bid price value for each leg Must revise bid prices frequently to prevent too many bookings ofODFs at current bid price3232
MITICATExample: Bid Price ControlA ------- B ------- C ------- D Given leg bid pricesA-B: 34B-C: 201C-D: 169 Availability for O-D requests B-C:Bid Price 201Available?Y 440YesM 315YesB 223YesQ 197No3333
MITICATA-B: 34A-CYMBQBid Price 235 519 344 262 231Available?YesYesYesNoBid Price 404 582 379 302 269Available?YesNoNoNoA-DYMBQB-C: 201 C-D: 1693434
MITICATNetwork Optimization Methods Network optimization mathematics needed for bothbid price and value bucket controls. Several optimization methods to consider: Deterministic Linear Programming Dynamic Programming Nested Probabilistic Network Bid Price Simulated revenue gains are quite similar: ODF database, forecast accuracy and robustness under realisticconditions make a bigger difference35
MITICATNetwork Linear Program (LP)Maximize Total Revenue Sum [Fare * Seats] Summed over all ODFs on networkSubject to following constraints:Seats for each ODF Mean Forecast DemandSum[Seats on Each Leg] Leg CapacityOutputs of LP solution: Seats allocated to each ODF (not useful) “Shadow price” on each leg (reflects network revenue value oflast seat on each flight leg)36
MITICATO-D ControlSystemRev. ValueBucketsHeuristicBid PriceDisp. Adjust.Value Bkts.NetworkBid PriceO-D Control System AlternativesData andForecastsLeg/bucketLeg/bucketODFODFOptimization ControlModelMechanismLeg EMSRLeg/bucketLimitsLeg EMSRBid Price forConnex onlyNetwork Leg/bucketLeg EMSRLimitsNetwo
Airline Revenue Management: Flight Leg and Network Optimization 1.201 Transportation Systems Analysis: Demand & Economics Dr. Peter P. Belobaba. MIT MIT ICAT 2 Lecture Outline 1. Overview of Airline Pricing Differential Pricing Theory Fare Restrictions and Disutility 2. Revenue Management Systems 3. Overbooking Models 4. Single-leg Fare Class Seat Allocation Problem EMSRb Model for .