Transcription
S U M M I N G U P. . .GLOBAL CONTACT CENTREB E N C H M A R K I N G R E P O RTYO U R G U I D E T O CONTACT CENTRE PERFORMANCE AND DEVELOPMENT
The Global Contact Centre Benchmarking Report provides in-depth information on contact centres - howthey work; how they perform; and how they are likely to develop.The Global Contact Centre Benchmarking Report is compiled following a benchmarking study on contact centresfrom 42 countries. The Report reveals key topics and trends covering the entire scope of contact centre operations:from performance, processes, organisation and technology to your development strategy, financial and customermanagement. The Report also takes into consideration all historical tracking data acquired since it was firstpublished in 1997.
S U M M I N G U P. . .GLOBAL CONTACT CENTREB E N C H M A R K I N G R E P O RTYO U R G U I D E T O CONTACT CENTRE PERFORMANCE AND DEVELOPMENTGLOBAL CONTACT CENTRE BENCHMARKINGSUMMARY REPORT
YOUR GUIDE TO CONTACT CENTRE PERFORMANCE AND DEVELOPMENTOrder Form pg 14A Future Glimpse pg 11Participation Form pg 15Contact Details pg 16 GLOBAL CONTACT CENTRE BENCHMARKINGSUMMARY REPORTKey Findings pg 3REVIEW YOUR CONTACT CENTRE Use the findings presented in the Report as well as the commentary from leading specialists in the related fields,to review your operations against the published data. By gaining a holistic view of your position in comparison toglobal measures, your organisation can begin planning the strategic roadmap for your contact centre’s future.Sample Stats: Sample size: 403 contact centres Contact centres from 42 countries Industry representation (top five):1. Financial Services2. Service Providers & Telecommunications3. Government and Education4. Consumer Goods and Retail5. Business Services O ther industries include Automotive & Manufacturing, Healthcare & Pharmaceuticals, Media & Entertainment,Technology, Travel & Transportation and Utilities & Energy.
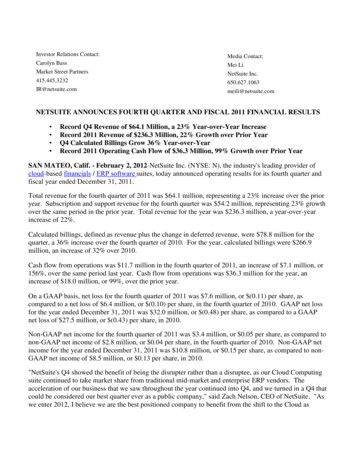
FUNDAMENTAL KPI SCORECARDThe following graph depicts a set of fundamental Key Performance Indicators (KPIs) that provide a brief summaryof key changes in performance across the contact centre industry. KPIs are discussed throughout the 2007 Reportand are explored in detail in Chapter 5 - Performance Measures and Metrics.FIGURE 1 FUNDAMENTAL KPI SCORECARD200520062007Cus tomer s at is fac t ion (% measu r ed in t he cont ac t cent r e)838268Fir s t cont ac t r esolut ion r ate (% call r esolved fir s t t ime)718381Agent ut ilis at ion (% t alk t ime)575959S t af f at t rit ion (% a n nual agent tu r nover)232124S t af f a bsenteeis m (% a n nual agent a bsenteeis m)81111A ba ndoned call r ates (% call r esolved fir s t t ime)13129S p e e d -to -a n swe r (% of c a l l a n swe r e d i n 10 s e c o n d s)717062Cost per productive hour (overall average USD)35The Global Contact Centre Benchmarking Report 2007 includes analysis on the following strategic and operationalareas in the contact centre:CONTACT CENTRE STRATEGY AND DEVELOPMENT PLANPERFORMANCEMEASURES AND METRICSFINANCIAL RATIONALEAND MANAGEMENTPROCESS AND PROCEDURESORGANISATIONTECHNOLOGY ENVIRONMENTSUMMARY REPORTCUSTOMER KNOWLEDGEAND MANAGEMENTGLOBAL CONTACT CENTRE BENCHMARKINGWHAT’S IN THE REPORT?
GLOBAL CONTACT CENTRE BENCHMARKINGSUMMARY REPORTKEY FINDINGS
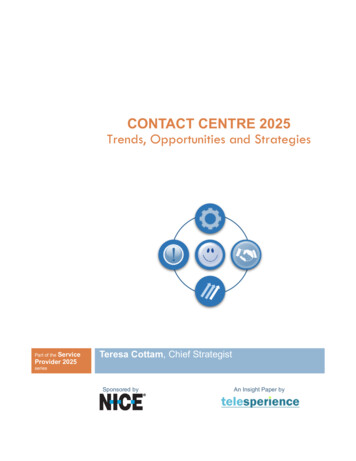
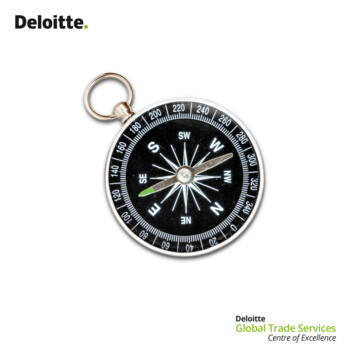
STRATEGY AND DEVELOPMENTDEVELOPMENT STRATEGY COMPONENTS BY INDUSTRYIf you have a defined contact centre development strategy, which of the following items are included in the strategy?93.8%92.0%83.3%76.5%85.7% 100.0%Quality / process 3%Staff 0%Technology el development / adcount t reduction ability / functionality %Service cost per les tomer base growth / retention tomer profitability / ce offering per %3.5%3.1%0.0%3.7%5.9%0.0%0.0%OtherUTILITIES & ENERGYSERVICE PROVIDERS& TELECOMMUNICATIONS85.9%TECHNOLOGY & MEDIAMANUFACTURING& PRODUCTS77.3%FINANCIAL SERVICESCustomer satisfactionBUSINESS SERVICESGOVERNMENT, EDUCATION& HEALTHTRAVEL & TRANSPORTATIONPercentage of contact centres n 403 Customer satisfaction consistently ranked highest of the development strategies (87.3%) followed by quality/process improvements (77.3%) and staff satisfaction (68.2%) The three most important current main commercial drivers for the contact centre are: to improve service (24.3),increase sales / revenues (15.7%) and to increase efficiency (14.9%) The top three issues in managing contact centres in different locations to the head office or regional operationsare: quality of service (26.3%), communication (15.7%) and uniformity of processes (12.4%) In terms of trends affecting contact centres, 23.4% of all contact centres ranked self-service channels as themost important trend. This is followed closely by process optimisation (21.5%) and following these are customerlifetime value (CLTV) management (10.5%) and extend service offering (10.2%)CONCLUSIONS: Customer experience management, or CEM, is emerging as a strong front runner in the race for serviceexcellence Staff satisfaction is an integral strategic driver for contact centres. The link between staff satisfaction andcustomer satisfaction is increasingly realised and valued Location factors in overall strategy are also shifting. Cost reduction is becoming less critical as a determiningSUMMARY REPORT Any powerful contact centre strategy must place customer service and service improvements goals centre stageGLOBAL CONTACT CENTRE BENCHMARKINGEXTRACT FINDINGS FROM THE STRATEGY AND DEVELOPMENT CHAPTER OF THE REPORT INCLUDE:factor, and other factors like staff availability are gaining prominence
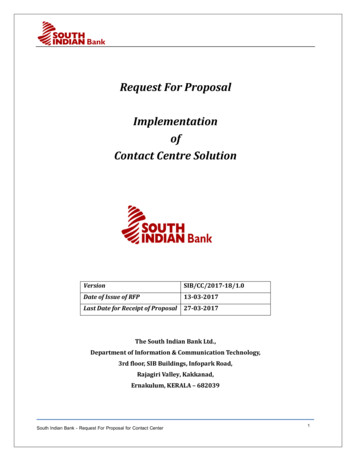
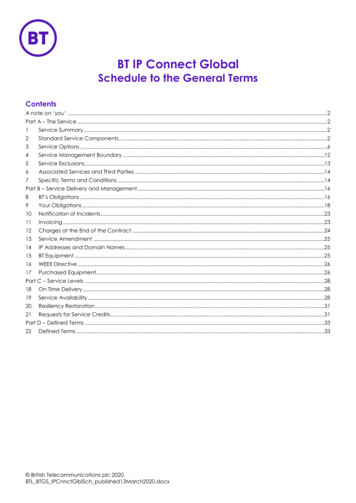
FINANCIAL MANAGEMENTCOST VERSUS PROFIT CENTRESI s t h e c o n t a c t c e n t r e a b l e t o m e a s u r e , o r d o e s i t c o n t r i b u t e t o w a r d s a n o t h e r d e p a r t m e n t ’sm e a s u r e m e n t of, t h e fo l l owi n g f i n a n c i a l i n d i c a to r s?Percentage of contact centres n 342Cost per customer contact per channel42.4Sales generated from leads identifiedwithin the contact centre28.9Customer profitability18.1Cost of customer acquisitionLifetime customer value8.516.1 7.0Actual collections against ‘promised to pay’16.1 1.89.6 4.69.917.021.126.644.434.231.3Yes, we measureYes, we partially measureYes, we contribute to another department measuringNo, we do not measureDon’t use this measureEXTRACT FINDINGS FROM THE FINANCIAL MANAGEMENT CHAPTER OF THE REPORT INCLUDE: 57.4% of contact centres are seen as cost centres, the same percentage as recorded last year and only onepercent down from the 58.4% recorded in the 2005 Report Respondents listed the top three operating expense items as total staff salary costs (69%), technology/systems/ telecoms infrastructure, hardware, software licenses (including support) (8%) and other operationalcosts (7.8%) The average fully loaded cost per agent per seat is just under USD 5,000. Africa and the Middle East is morethan a third (36%) less expensive than the overall global cost per seat. It’s also about 73% of the cost of a seat GLOBAL CONTACT CENTRE BENCHMARKINGSUMMARY REPORTin Asia-Pacific, 59% of the cost of a seat in Europe and less than half (49%) of the cost per seat in the NorthAmerican region Looking at channel cost and duration data, there is a large difference in the costs of different channels, withletters (USD 7,13), faxes (USD 7,06) and emails (USD 5,34) most expensive and self-service channels leastexpensive.CONCLUSIONS: The majority of contact centres are run as cost centres, not as strategic business units. Organisations andexecutive need to better understand the value of the contact centre. Contact centre management need to take amore active role in measuring and interpreting financial metrics as accurate measurement and tracking can be apowerful tool to demonstrate and quantify the value added to the organisation by the contact centre. Annual operating budget figures suggest that Africa and the Middle East and Asia-Pacific are likely to continueto be the most cost effective destinations, as these regions offer lower levels of salaries and therefore continueto remain attractive. Physical mail, faxes and emails are the most expensive contact centre channels; self-service channels are thelowest cost Effective multi-channel strategies demand that contact centres put measures and metrics in place to understandthe costs and interaction duration across all channels
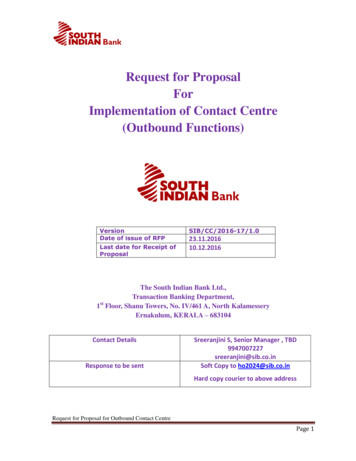
CUSTOMER KNOWLEDGE AND MANAGEMENTSEGMENTATION OF CUSTOMERS BY INDUSTRY SECTORH a v e y o u u n d e r t a k e n a n d d o y o u u s e a s e g m e n t a t i o n o f y o u r c o n t a c t c e n t r e ’s ( s ’ ) m a r k e t a n dc u s to m e r b a s e, w h e r e t h e s e g m e n t s h ave d e f i n e d c h a r a c te r i s ti c s a n d p a r a m e te r s?Percentage of contact centres n 334Overall13.8Business Services24.0Service Providers & Telecommunications16.3Technology & Media12.323.716.024.037.114.015.0Financial ServicesTravel & Transportation16.017.7Government, Education & HealthManufacturing & Products34.419.416.325.030.215.013.4 6.225.048.5 10.39.531.06.511.931.038.7 6.5Utilities and Energy11.328.621.415.920.014.523.320.021.616.745.2 314.335.7Yes, we have and use a specific contact centre customersegmentation that is not the same as the organisation'sYes, we have and use the same customer segmentation asour organisationYes, we have and use a customer segmentation that ismodified from our organisation'sNo, we do not have and use a customer segmentationNot applicable / necessary for our organisation / contact centreEXTRACT FINDINGS FROM THE CUSTOMER KNOWLEDGE AND MANAGEMENT CHAPTER OF THE REPORT INCLUDE: 24.4% of the sample segment their customer base by defined characteristics and parameters, compared to34.4% last year 30% of contact centres believe that developing a single view of the customer across channels, products/services, data/ customer information and transaction history does not apply to them The sample indicated that 69.3% have a policy in place for customer complaints, 38.5% for new customers(welcome calls), and 37.3% for lapsed payments 63% of the sample do not incentivise customers to use lower cost channels, compared to19% of the respondentswho has some kind of incentive in placeCONCLUSIONS To truly unlock the value of your contact centre, customer segmentation is a necessary science. This givesthe agent a complete, single view of the customer he or she is dealing with, drawn from the organisation’s fulldatabase, and across the multiple channels offered Contact centres should use segmentation models that are derived from the broader organisation, to ensure thatwith a siloed business unit approach. Cross channel visibility of customers should be at the core of contact centre strategy. As such, contact centresshould invest in understanding the channels their customers want to utilise to contact them, subsequentlyimplementing this single view of the customer.SUMMARY REPORTthey comply with overarching business processes and goals. It is no longer justifiable or practical to operateGLOBAL CONTACT CENTRE BENCHMARKING The average overall customer satisfaction score measured by contact centres is 68.3% compared to 82% in 2006.
PERFORMANCE MEASURES AND METRICSSALES SUCCESS BY CONTACT PURPOSEDo you implement outbound sales / marketing campaigns and if so, what call conversion rates doy o u a c h i e v e? P l e a s e i n d i c a t e y o u r c a l l v o l u m e s t a t i s t i c sAverage sales conver sion rate (indexed to conver sion rate calling from a prospect list) n 20 930000002500000200000015000005.11.00.0New customer welcome callDirect sales call (prospect base)Other call typeLapsed customer retention call 5.478.0Market research callLead qualification / generation call(followed up by field sales force) 13.8212.00Appointment setting call(followed up by field sales force)500000Upsell / cross-sellcustomer direct sales call 225.11000000Relative sales conversion rateDialling attemptsEXTRACT FINDINGS FROM THE PERFORMANCE MEASURES AND METRICS CHAPTER OF THE REPORT INCLUDE: It is 200 times more effective to direct cross-sell and up-sell campaigns at the existing customer base orqualified leads followed up by the field sales force. The proportion of contacts made through other, non-telephone channels has remained fairly steady at around GLOBAL CONTACT CENTRE BENCHMARKINGSUMMARY REPORTone in five contacts. This year, however, the data revealed a significant change to the mix of those contacts.The volumes of facsimiles and postal mail have dropped to a negligible level; while web self-service and SMSbased contacts have become dominant Overall, interaction volume statistics from this year’s Benchmarking data show that four out of five contactshandled in the contact centres are by phone. Non-phone based interactions constitute 22.0% of all contactcentre inbound and outbound contacts. Of those, just under half (48.6%) are web-based and the remainder aresplit between e-mail, fax, postal and SMS communications Less than half of contact centre management teams take the analyses of their contact centre’s data seriouslyand only one in six of the team leaders do so either. Contact centres in the 500-1,000 seat range use a dedicateddata analyst team and that in many cases, t
The Global Contact Centre Benchmarking Report is compiled following a benchmarking study on contact centres from 42 countries. The Report reveals key topics and trends covering the entire scope of contact centre operations: from performance, processes, organisation and technology to your development strategy, financial and customer management. The Report also takes into consideration all historical