Transcription
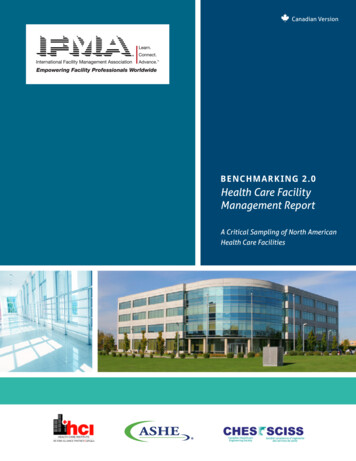
Canadian VersionBENCHMARK ING 2 .0Health Care FacilityManagement ReportA Critical Sampling of North AmericanHealth Care Facilities
BENCHMARK ING 2 .0Health Care Facility Management Report CommitteeLaverne Deckert, Product Manager, International Facility Management AssociationWilliam L. Gregory, IFMA Fellow, PE, CFM, Vice President Facility Management, Adelphoi USATodd Wilkening, CHST, Director of Facilities, Ridgeview Medical CenterSteve Rees, VP Capital Management, Edmonton Zone, Alberta Health ServicesDennis Smith, MS, CHFM, CEM, CCM, Director, Facilities Management, Catholic Health InitiativesYuanyuan Zhang, Ph.D., Market Researcher, International Facility Management Association Copyright 2013 by the International Facility Management Association. All rights reserved.This publication may not be reproduced, stored in a retrieval system or transmitted in whole or part, in any form or by anymeans, electronic, mechanical, photocopying, recording or otherwise without the written permission of the InternationalFacility Management Association.For more information, please contact:IFMA Research Department800 Gessner Rd, Suite 900, Houston, TX 77024-4257 USAPhone: 1-713-623-4362E-mail: research@ifma.orgISBN 978-1-883176-23-5
BENCHMARK ING 2 .0Health Care FacilityManagement Report
TABLE OF CONTENTS6 -12 INTRODUCTION677789-12IntroductionUsing this ReportAcknowledgementsAbout this ReportMethodologyDefinitions13-24 SECTION stitutions RepresentedFacility DescriptionRegional Climate ZonesFacility AgeFacility SettingOwnershipOwnership by InstitutionsDeveloped AcresDays and Hours of OperationsCentral PlantExterior Gross AreaAdjusted Patient Days and DischargesSpace per FTENon-ProfitData CentersFacility ParkingDevoted AreaAlternative Power25 -32 SECTION 2Utilities26-282930-31324Utility CostsUtility ConsumptionEnergy Use IndexBuilding Automation SystemB E NCHM A R K I NG 2 . 0 Health Care Facility Management Report IFMA 2013
TABLE OF CONTENTS33- 46 SECTION e CategoriesMaintenance CostsRoads and GroundsFacility Operating Current ReplacementValue (CRV) IndexMaintenance TrackingMaintenance Management System UsedMaintenance StaffingMaintenance ManagementAdministrative SupportTotal Maintenance StaffService Provision47-51 SECTION 4Environmental Services48-50 Environmental Services Costs50 Environmental Services Staffing51 Contractor Practices52-53 SECTION 5Waste54 -55 SECTION 6Linen Services56 - 64 SECTION 7Operations57 Cost of Operations58-60 Customer Satisfaction61-62 Productivity Measure63- 66 SECTION 8Risk Management64 Safety Initiatives65 Injury Claims66 Security67-70 SECTION 9Property, Real Estate andConstruction Management68-69 Management70 Project Delivery Models5B E NCHM A R K I NG 2 . 0 Health Care Facility Management Report IFMA 2013
INTRODUCT IONThank you for participating in the Benchmarking 2.0 survey. If you were a participantin the survey, you have the ability to customize, filter and review results online. Fromthis you can harvest a wealth of information to help you manage your facilities asefficiently and effectively as possible.Our goal has been and continues to be to help the health care facility manager addsignificant value to their organization and the populations they serve by bettercontrolling underlying drivers that impact their costs and quality of service delivery.We are pleased to have completed this significant benchmarking report for healthcare facility management operations as a joint effort by the Health Care Institute, anIFMA Alliance Partner, the American Society for Healthcare Engineers (ASHE), and theCanadian Healthcare Engineering Society (CHES). As a North American-wide effort,Benchmarking 2.0 sets the stage for an expanded international effort in our industryin the near future.One of the main areas of differentiation of Benchmarking 2.0 from other surveys is theinclusion of key business drivers that enable the facility manager to provide strategicinput to the core health care operation. Our survey guides the facility manager on thepath of continuous improvement by helping them identify information they need tocollect and know by formatting outputs into information they need to communicateto their superiors to be more effective in their roles.On behalf of the Health Care Institute, ASHE, and CHES, we would like to sincerelythank each and every one of our participants in this exceptional effort, as well as thesupport staff for their efforts to make this survey and report a success.We plan to continue to improve our surveys and processes to enhance the valueof our members’ efforts in their organizations and look forward to your feedback inachieving that goal.Ron KalichPresident, Health CareInstitute, an IFMAAlliance Partner6Dale WoodinExecutive Director,ASHEB E NCHM A R K I NG 2 . 0 Health Care Facility Management Report IFMA 2013John J. KnottPresident, CHES
INTRODUCT IONUsing this ReportAcknowledgementsThe information contained in the report representsa “self-report” from ASHE, IFMA and CHES members.All information was voluntarily provided and was notchecked with site visits. When interpreting the data, itis important to remember that every facility is different,and every organization operates using differentaccounting and measurement practices. The data listedin this report will not provide a perfect comparisonof your organization to that of another hospital, but itshould give you a good idea how your facility fits intothe range of performance.ASHE, IFMA and CHES rely on the willingness andgenerosity of their members to compile the data andcomplete this lengthy benchmarking survey. Without theirdata, there would be no report. We thank these dedicatedparticipants for their contributions and support.The percentile charts in this report allow you to seehow your operation ranks against other organizations.The arrows beside some charts show the “best-inclass” direction. Using your facility’s numbers for theperformance indicator, determine whether your buildingis above or below the median (50th percentile). If yourfacility falls way above or below the median, you maywant to examine your costs or procedures in that area.However, your hospital may differ from the median dueto type of facility, climate or labor market. The datashould help you identify areas where you can improveyour facility operation.Readers will see arrows pointing in an upward ordownward direction next to several of the percentilecharts in this report. In many cases the arrow pointstoward the lowest cost; however, the organizationwith the lowest cost may not profess to have the bestpractice. There may be a reason why a cost is so low. Forexample, a hospital building scheduled for demolitionwould likely apply minimal resources and thus costswould be lower.We would like to express our appreciation to thefollowing individuals who have dedicated countless hoursof passion to furthering the success of Benchmarking 2.0and those of their fellow facility managers:Steve Rees, CFM, Vice President, Capital ManagementEdmonton ZoneDale Woodin, CHFM, FASHE, Executive Director, AmericanSociety of Healthcare EngineersLastly, we need to express our sincere and deepappreciation to Shari Epstein, IFMA’s past ResearchDirector who was instrumental in the development ofBenchmarking 1.0. Shari recently lost her life in a tragicaccident. We know that her initial guidance has made ourcontinued benchmarking efforts possible.About This ReportThis year was the second year the Health CareFacility Management Benchmarking survey wasconducted in North America. To create this report, acommittee of ASHE, IFMA and CHES volunteers withexpertise in environmental services, maintenance andenergy management reviewed questions posed inBenchmarking 1.0 Health Care Facility ManagementSurvey and developed new questions to better matchtoday’s practices. Findings are discussed in the sectionsthat follow.Using this report is the first step in benchmarking. Afteryou have identified areas where your facility operationscould be improved, you should conduct additionalresearch before reengineering the process. One shouldnot immediately rush to find out which health careorganization is “best in class” and copy their practice.Instead you should look for a more homogeneous groupin which to compare.7B E NCHM A R K I NG 2 . 0 Health Care Facility Management Report IFMA 2013
INTRODUCT IONMethodologyThe Operations and Maintenance Benchmarking 2.0for Health Care Facilities survey was developed insummer of 2012. Based on the Benchmarking 1.0survey questionnaire, modifications were made andnew questions related to risk management, property,real estate and construction management were added.Committee members examined each question tomake sure they were clear, unambiguous, conciseand relevant. Questions were asked in an objectivefashion in order to obtain responses that were trulyrepresentative of industry practices.statistic. An example of this can be seen in the samplesize for facilities more than 50 years of age. As a result,data for this category of facility age was not reported.The survey was developed through IFMA’s online surveymanagement system entitled Benchmarks Exchange(BEX). In July 2011, IFMA, ASHE, and CHES membersreceived an e-mail directing them to a link to the onlinesurvey. Respondents were asked to provide informationon the facilities they manage for a 12-month period oftime. The majority chose to report the data for calendaryear 2011. A total of 262 hospitals participated in thesurvey during a five-month period. A survey completionrate of 80 percent or above was considered usable,yielding 184 surveys being included for analysis –compared to 151 in 2009.Operations and Maintenance Benchmarking 2.0 forHealth Care Facilities is a self-report survey. All data,including respondent identification, was voluntary. Aswith any research, readers should exercise caution whengeneralizing results and take individual circumstancesand experiences into consideration when makingdecisions based on the data. While IFMA is confidentin its research, it is important to understand that theresults presented in this report represent the sampleof organizations that chose to supply the requestedfacility information. A confidence level and margin oferror provide readers some measure of how much theycan rely on survey responses to represent all IFMA,ASHE and CHES member organizations. Given the levelof response to this survey, we are 95 percent confidentthat responses given by all responding organizationscan be generalized to all IFMA, ASHE and CHES memberorganizations, in general with a margin of error ofapproximately /- 7.0 percent. For example, 40 percentof the respondents reported that they conducted facilityrelated customer satisfaction surveys. With a 7 percentmargin of error for the sample size of 167, the readercan be 95 percent certain that between 33 percentand 47 percent of all managers within health caresettings collect some type of facility related customersatisfaction data. It is important to note that as thesample size decreases, which occurs in many of thetables, the margin of error increases. For example, asmaller sample of 115 increases the margin of error to /- 9 percent.To ensure high quality data, highly structured codingand data verification procedures were used. In addition,all variables and values were checked to verify thatthey were within appropriate ranges and inappropriateoutliers were corrected or removed. A full statisticalanalysis followed, using a professional software packagecalled IBM SPSS Statistics. Standardized data analysisprocedures included reviewing descriptive frequencycounts and cross tabulations of responses for variablesof interest.To maintain the real world usability of these researchfindings, statistics are most often provided in terms ofabsolute number of responses, percentages and meanaverages. Percentages may not add to 100 percent dueto rounding or the acceptance of multiple responses.In many cases, some respondents did not answer allquestions, so the base numbers differ among the findings.Several tables have blanks in lieu of a number becausethere were not enough responses to generate a valid8Additional calculations were made to determine costand utility consumption per square meter, square metersper FTE and cost per discharge. Utility consumption datawas changed to match the unit specified. The cost datawith U.S. currency was converted to Canadian dollars bydividing costs by a factor of 1.01, the currency exchangerate on Dec. 20, 2012. English measures were convertedto metric measures.B E NCHM A R K I NG 2 . 0 Health Care Facility Management Report IFMA 2013
INTRODUCT IONDefinitions for Benchmarking 2.0for Health Care Facility ManagementAdjusted Patient DaysBEXCentral Mechanical PlantThis figure is used as a way tostandardize the per unit measurebetween hospitals, allowing for morevalid comparisons. Adjusted patientdays is calculated by dividingtotal charges by inpatient charges,then multiplying by the number ofinpatient days and admissions.Benchmarks Exchange is the websitethat houses IFMA benchmarkingsurveys and results. Once a selectnumber of surveys have beenentered into a database, participantscan download customized reportsbased on their specific industry,facility type, geographic region,facility size and other needs.A plant that is owned by, and on thegrounds of, a multi-building facilitythat provides district heating, districtcooling or electricity to one or morebuildings within the same facility.The central physical plant may be byitself in a separate building or maybe located in a building where otheractivities occur.CADClimate ZonesComputer-aided design is the use ofcomputer technology to assist in thedesign and especially the drafting(technical drawing and engineeringdrawing) of a part or product,including entire bui
care facility management operations as a joint effort by the Health Care Institute, an IFMA Alliance Partner, the American Society for Healthcare Engineers (ASHE), and the Canadian Healthcare Engineering Society (CHES). As a North American-wide effort, Benchmarking 2.0 sets the stage for an expanded international effort in our industry
