Transcription
2006 Contact CenterIndustry Benchmarking ReportThe PhilippinesSponsored by:Endorsed by:
Introduction The 2006 Contact Center Industry Benchmarking Report – The Philippines, is researchedand published by callcentres.net. This report is part of a study of the contact center industries in six Asian countries: China, India,Malaysia, The Philippines, Singapore and Thailand. callcentres.net has produced the Asian Contact Center Industry Benchmarking Report since1997. 67 telephone and online interviews with contact center managers and decision makers in ThePhilippines were conducted in November 2006. The total number of contact center seats included in this study is 45,285 which is estimated tobe 43% of the total Philippines industry seat size. As such, this sample is sufficient to makegeneralisations of the results to the wider contact center industry in The Philippines.22006 CONTACT CENTER INDUSTRY BENCHMARKING REPORT – THE PHILIPPINES
Analysis All results in this report have been cross-tabulated by contact center size. Z-tests were conducted to test statistically significant differences between the subgroups.Where a difference is proven to be statistically significantly different these have beenhighlighted in orange in the relevant tables as shown below. 20 seats20-49 seats50-99 seats100 seats33%59%38%74%YesIndicates value is statistically significantly higherDefinitions of statistical terms: Mean (or average) – the sum of all values divided by the number of values. Median (or midpoint) – the number in a range of values that falls exactly in the middle so that50% of the cases are above or below. Mode – the most frequently occurring value in a range of values. Statistically significant difference - there is a difference between the means of two groups thathas a very low probability of having occurred by chance or error.32006 CONTACT CENTER INDUSTRY BENCHMARKING REPORT – THE PHILIPPINES
Sample In-house (captive) versus outsourcedcontact centers Industry Breakdown42006 CONTACT CENTER INDUSTRY BENCHMARKING REPORT – THE PHILIPPINES
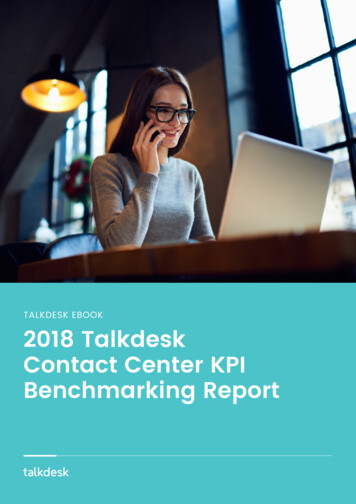
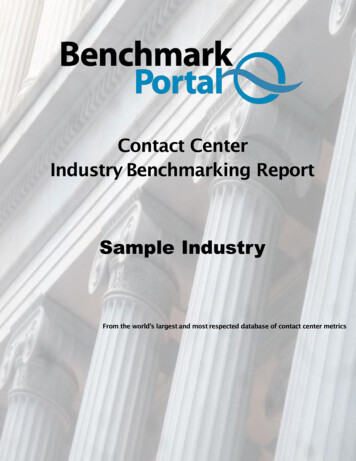
SampleIn-house (captive) versus outsourced contact centersOutsourced30%In-house (captive)70%N 6770% of the respondents’ contact centers in The Philippines are in-house(captive) centers.2006 CONTACT CENTER INDUSTRY BENCHMARKING REPORT – THE PHILIPPINES5
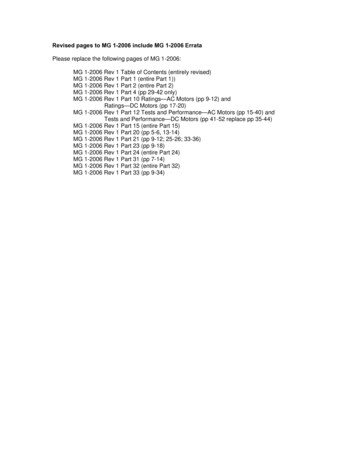
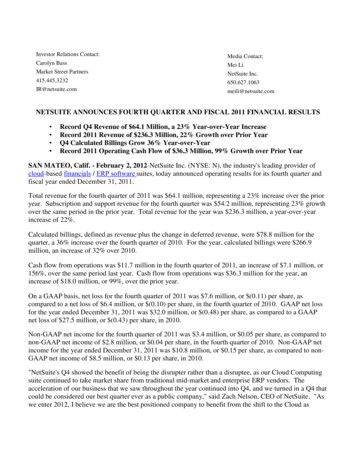
SampleIndustry30%Outsourced Contact Centre18%Banking, Finance, Insurance13%Transport & FreightRetail / Wholesale9%Hospitality / Tourism & Management9%Manufacturing5%Telecommunications / Utilities5%Information Technology5%Government, Education & Healthcare5%Business Services / Media3%N 672006 CONTACT CENTER INDUSTRY BENCHMARKING REPORT – THE PHILIPPINES6
Market Profile Number of contact center seats inThe Philippines and per organisation Number of contact centers perorganisation Countries serviced Languages spoken and required Opening days72006 CONTACT CENTER INDUSTRY BENCHMARKING REPORT – THE PHILIPPINES
Market ProfileThe total number of contact center seats in ThePhilippines in 2006 is estimated to be 105,000.This number is projected to increase to 140,000seats in 2007. This is a 33% growth rate.CountrySeats 2006Seats 2007(estimated)2006-2007Growth 6 CONTACT CENTER INDUSTRY BENCHMARKING REPORT – THE PHILIPPINES
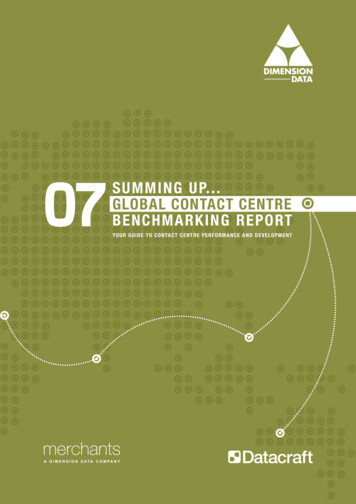
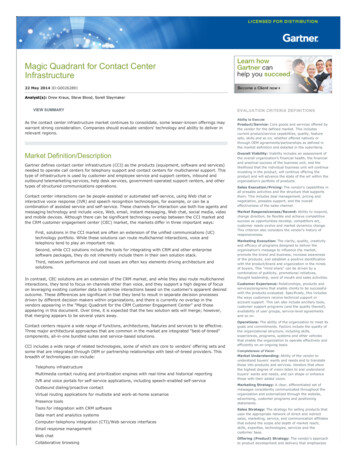
Market ProfileNumber of Contact Centers Per Organisation% of contact centers51%34%15%1 centerN 672 centersCountry1 Center2 Center3 The 9%2006 CONTACT CENTER INDUSTRY BENCHMARKING REPORT – THE PHILIPPINES3 centers or more51% of organisationshave 1 contact center,15% have 2 centers and34% have more 3 centersor more.9
Market ProfileNumber of Seats Per Organisation 20 seats21%100 seats42%50-99 seats7%20-49 seats30%In The Philippines, the meannumber of seats perorganisation is 676. This ispredicted to grow to a meannumber of 798 seats in 2007.Mean Seats perOrganisationMedian Seats ed)6767984855CountryMean 2006Mean The Philippines676798Singapore6077Thailand6583N 672006 CONTACT CENTER INDUSTRY BENCHMARKING REPORT – THE PHILIPPINES10
Market ProfileInternational versus Local Servicing% of centers54%46%InternationalN %67%Malaysia29%71%The Philippines46%54%Singapore37%63%Thailand3%97%2006 CONTACT CENTER INDUSTRY BENCHMARKING REPORT – THE PHILIPPINES46% of contactcenters in ThePhilippinesserviceinternationalmarkets.11
Market ProfileInternational versus Local ServicingServicing 20 seats20-49 seats50-99 seats100 85%There is a statistically significantly higher proportion of larger centers (100 seats)and outsourced contact centers servicing international markets.122006 CONTACT CENTER INDUSTRY BENCHMARKING REPORT – THE PHILIPPINES
Market ProfileCountries Serviced by Contact CentersPhilippinesUSASingaporeUKAustraliaChinaHong h KoreaNew 3%1%1%19%78% of contact centers in The Philippines currently service the domestic market.34% of contact centers service the USA and 13% service Singapore and the UK.N 672006 CONTACT CENTER INDUSTRY BENCHMARKING REPORT – THE PHILIPPINES13
Market Profile% of Calls that Require Agents to Speakin a Language other than the NationalLanguage50%% of calls49%MeanCountryMean %China19%India22%Malaysia45%The Philippines49%Singapore20%Thailand17%MedianOn average, 49% of calls require agents tospeak in a language other than the nationallanguage.N 672006 CONTACT CENTER INDUSTRY BENCHMARKING REPORT – THE PHILIPPINES14
Market Cantonese% of contact centersLanguages Spoken in Contact Centers100% of contact centers in The Philippines require a proportion ofagents to speak English to customers. 81% also require aproportion of agents to speak Tagalog to customers.N 472006 CONTACT CENTER INDUSTRY BENCHMARKING REPORT – THE PHILIPPINES15
Market ProfileOpening Days% of centers46%25%28%5 days or less6 days31%7 days24 hours x 7daysNearly half ofcontact centers inThe Philippinesoperate 7 daysper week and 31%operate 24 hoursa day, 7 days perweek.Country5 days or less6 days7 days24 X %The nd14%6%80%55%N 672006 CONTACT CENTER INDUSTRY BENCHMARKING REPORT – THE PHILIPPINES16
Market ProfileOpening DaysNo. days contact centeropen per week 20 seats20-49 seats50-99 seats100 seats5 days43%25%0%21%6 days50%25%60%14%7 days7%50%40%64%No. of days contactcenter open per weekIn-houseOutsource5 days32%10%6 days36%10%7 days32%80%24 X 723%50% There is a statistically significantly higher proportion of contact centerswith 20 seats or more that open 7 days per week. There is also a statistically significantly higher proportion of outsourcedcontact centers that open 7 days per week and 24 X 7.172006 CONTACT CENTER INDUSTRY BENCHMARKING REPORT – THE PHILIPPINES
Contact Handling Customer contacts per channel Primary work activity Transaction and channel volumes Inbound and outbound call percentage Agent call handling Up or cross-selling opportunities182006 CONTACT CENTER INDUSTRY BENCHMARKING REPORT – THE PHILIPPINES
Contact HandlingMean % of Customer Contacts per ChannelOver half of allcustomercontacts arehandled over thephone by thecontact center.% of centers57%16%15%13%Contact N 140center - Branch/ retail Contact center phonenetworkWeb based/EmailN 67Sales forceCountryCC PhoneBranch / RetailCC Web / EmailSales 11%10%The d75%9%4%10%2006 CONTACT CENTER INDUSTRY BENCHMARKING REPORT – THE PHILIPPINES19
Contact HandlingCustomer Contacts Per ChannelHandling of customer contactsIn-houseOutsourceContact Center - phone51%70%Branch/Retail network17%6%Sales force18%11%Contact Center - web based/Email15%14%There is a statistically significantly higher proportionof outsourced contact centers that handle customercontact over the phone by the contact center and astatistically significantly higher proportion of inhouse contact centers that handle customer contactthrough the branch/retail network and sales force.202006 CONTACT CENTER INDUSTRY BENCHMARKING REPORT – THE PHILIPPINES
Contact HandlingPrimary Activity at Contact Center% of centers52%13%18%13%3%CustomerServiceN e primary activityat over half ofcontact centers inThe Philippines isproviding 29%11%16%39%Malaysia76%6%5%10%The d75%12%11%2%2006 CONTACT CENTER INDUSTRY BENCHMARKING REPORT – THE PHILIPPINES21
Contact HandlingInbound vs. Outbound Functionality% of centers69%24%7%Inbound onlyOutbound onlyBlendedCountryInbound OnlyOutbound he 2%N 672006 CONTACT CENTER INDUSTRY BENCHMARKING REPORT – THE PHILIPPINESThe majority ofcontact centers inThe Philippineshave blendedfunctionality.22
Contact dia131,036Malaysia15,634The ber oftransactionsMean Weekly Transaction Volume perCenterNo. of contacts handledin an average weekMean 20 seats20-49 seats50-99 seats100 seats3,4195,89523,320384,100Each contact center handles an average of 160,399 transactions per week.N 672006 CONTACT CENTER INDUSTRY BENCHMARKING REPORT – THE PHILIPPINES23
Contact HandlingChannel VolumesPhone (agent)Phone (agent after IVR)EmailFaxLetterOtherPhone (IVR only)Phone (speech recognition)Product ordering via webWeb chat (text)49%18%67%13%8%4%3%2%1%1%1%CountryPhone (agent)Phone (agentafter IVR)China28%27%India45%39%Malaysia45%24%The Philippines49%18%Singapore63%18%Thailand61%19%The share of transactions through each channel shows a high reliance on agents.Agents handle 49% of all transactions that come through the contact center with noautomation, plus an additional 18% of transactions after some functions have beenhandled by the IVR.N 672006 CONTACT CENTER INDUSTRY BENCHMARKING REPORT – THE PHILIPPINES24
Contact HandlingContact Center TransactionsHandling contact centertransactions (mean %)In-houseOutsourcePhone (agent)50%45%Phone (agent after IVR)13%32%Email15%8%Fax10%2%Letter5%2%Phone (IVR)1%4%Product ordering via web1%2%Web chat (text)1%1%Phone (speech recognition)1%2%Web chat (voice)0%1% There is a statistically significantly higher proportion of outsourced contact centers handlingtransactions by phone (agent after IVR). There is also a statistically significantly higher proportion of in-house contact centers thathandle transactions by email and fax.252006 CONTACT CENTER INDUSTRY BENCHMARKING REPORT – THE PHILIPPINES
Contact HandlingInbound and Outbound % of Total Calls% of calls66%34%Inbound66% of total callshandled by contactcenters in ThePhilippines areinbound.N %48%Malaysia67%33%The Philippines66%34%Singapore81%19%Thailand83%17%2006 CONTACT CENTER INDUSTRY BENCHMARKING REPORT – THE PHILIPPINES26
Contact HandlingN 67Agent Call Handling no. of calls per agent per shiftNumber of Calls69286065Inbound agentOutbound agentInbound, outboundand blended agentsall handle between60 - 70 calls per shiftper day.41Blended hina969495India788254Malaysia827898The 06 CONTACT CENTER INDUSTRY BENCHMARKING REPORT – THE PHILIPPINES
Contact HandlingAgent Call HandlingNo. of calls handled by agentsIn-houseOutsourceInbound only4881Outbound only557445 inbound 28 outbound26 inbound 28 outboundBlendedInbound only agents in outsourced contact centers handle astatistically significantly higher number of calls than inboundonly agents in in-house contact centers.282006 CONTACT CENTER INDUSTRY BENCHMARKING REPORT – THE PHILIPPINES
Contact HandlingN 67% of Contact Centers that Report an Up or CrossSelling Opportunities from Inbound Calls71%26%3%Up or cross-sellingopportunities from inboundcallsNo opportunities from inboundcalls71% of contact centers in ThePhilippines report opportunities to upor cross-sell from inbound calls.Don't India22%78%Malaysia69%7%The 6 CONTACT CENTER INDUSTRY BENCHMARKING REPORT – THE PHILIPPINES
Contact HandlingN 67Mean % of Total Inbound Calls thatPresent an Up or Cross-SellingOpportunity52%Of those contact centers in ThePhilippines that report opportunities to upor cross-sell from total inbound, onaverage, 52% of all inbound calls presentan opportunity to up or cross sell.CountryMean %China13%India60%Malaysia25%The Philippines52%Singapore28%Thailand46%302006 CONTACT CENTER INDUSTRY BENCHMARKING REPORT – THE PHILIPPINES
Budgets and Costs Budget allocation Cost per seat and optimised cost pertransaction312006 CONTACT CENTER INDUSTRY BENCHMARKING REPORT – THE PHILIPPINES
Budgets and Costs% of budget allocated46%Budget Allocation20%Labor relatedOn average, 46% of thetotal contact center budgetin The Philippines isallocated to labor relatedexpenses. 20% of budgetis allocated to technologyexpenses and 19% isallocated ns15%OtherCountryLaborTechnologyTelecomm.Chi
Agent call handling Up or cross-selling opportunities. 2006 CONTACT CENTER INDUSTRY BENCHMARKING REPORT – THE PHILIPPINES 19 Contact Handling N 140 Over half of all customer contacts are handled over the phone by the contact center. Mean % of Customer Contacts per Channel 57% 13% 15% 16% Contact center - phone Branch/ retail network Contact center - Web based/ Email