Transcription
http://www.BetaMachinery.comE:\Marketing Communications\Papers and Presentations\Technical Papers\New Technical Papers\Machinery VibrationLimits#8.doc1Machinery Vibration LimitsandDynamic Structural ResponseByBrian C. Howes, P. Eng., M.Sc.Brian Howes is Manager of Engineering for Beta Machinery Analysis Ltd., Calgary. His previousexperience has included research and development in the area of pulsations and vibrations ofpiping systems, and troubleshooting of problems in a wide range of equipment including turbines,pumps, compressors, pulp refiners, ball mills, furnaces and piping systems. He has a Master ofScience in Solid Mechanics from the University of Calgary, and is a member of the VibrationInstitute.ABSTRACTChanges in case vibration readings are used to monitor rotating machinery condition. Absolutelevels of vibration are indications of condition except where structural resonances (e.g.: bearinghousings, or motor bases) amplify vibrations at certain frequencies (usually integer multiples ofshaft speed). Dynamic response at vibration test points can be measured on new installations toassist in establishing standards for absolute vibrations. Also, changes in dynamic response overtime can add to understanding of machine condition. Discussion of case history to illustratepoints is included.
http://www.BetaMachinery.com2Machinery Vibration LimitsandDynamic Structural ResponseVibration monitoring of rotating machinery has developed over the years to the point where it isan accepted maintenance tool. Much effort has been applied towards developing guidelinesregarding acceptable absolute levels of vibration. Discussions of some of these standards andtheir inadequacies are given in References 1, 2 and 3.The real intent of vibration monitoring, in our opinion, is to infer the absolute force levels or morebasically, the stress levels, acting in the monitored machine. Based on the conclusions reachedfrom the analysis of vibration levels, decision must be made to balance a rotor, redesign animpellor, shut a process down and open the case of a compressor, etc., all involving potentiallyexpensive downtime of the machine. Correct analysis of the cause of high vibration levels canpermit quick correction with consequent dollar savings.Case, shaft absolute and shaft relative-to-case vibration readings are all used for diagnosis.Structural resonances can produce local increases or decreases (Reference 1) in these vibrationlevels with no change in force level in the machine. It is important to distinguish between thepresence of large forces (eg: large unbalance, malalignment, high vane passing pulsations, etc.)and dynamic amplification of the internally generated forces by a structural resonance, as thetype of corrective measure will be different.Three classes of problem can be envisioned:-high vibration, acceptable forces, structural resonancehigh vibration, unacceptable forces, structural resonancehigh vibration, unacceptable forces, no structural resonance.Another aspect of vibration analysis involves the amount of prior knowledge. Two generalsituations occur:-troubleshooting a new problem or a newly started machine with no backgroundvibration data available for the machine.-trending of vibration levels over an extended period has been carried out and isused to assist in diagnosing the cause of a problem on a machine.Although this paper is written from the first point of view, trending of vibrations would generally bepreferred. Trending will detect changes in machine condition that may be very difficult to detectwithout historical information.
http://www.BetaMachinery.com3An example of this concept was recently observed on a centrifugal compressor. The vibrationlevels were within “guideline”. However, the compressor had recently lost a blade. The vibrationlevels before losing the blade were significantly less than “guideline”. Without the historicalinformation a case could not be made for shutting the unit down, bearing in mind the high cost oflost production during shutdown.Knowledge of the dynamic stiffness of machines at the various vibration test points can reducethe need to rely on historical data. The following case histories are provided as examples toshow situations where simple measurement of vibrations and comparison with standards wouldhave or did cause confusion and lost time in the correct diagnosis of the problem.Consider the situation in which a machine has unbalance generating 1000 lb. shaking force atoperating speed of 3600 rpm. If the bearing housing has a dynamic stiffness of 1,000,000 lb/in,then the vibration amplitude will be:or:10001,000,000inch .001.001 inchx3600x60inch2 2 mil p-pradsec .377 in pksecNow consider a similar machine with a bearing housing having a stiffness of only 500,000 lb/in.The same unbalance would produce 4 mils p-p or .75 in/sec peak.The quality of the balance of each machine is the same, yet according to the vibration standardsthe second machine is in “worse condition”. That is “has poorer balance”.If one accepts that stress is proportional to vibration, the second machine should be balanced totwice as stringent a standard as the first. This might require balancing twice as often as the firstmachine with proportionately higher costs of downtime.Alternatively, an increase in the dynamic stiffness of the bearing housing would make themachine less sensitive to changes in balance (eg: due to wear or buildup on the rotor over aperiod of time) producing operating savings at the cost of an initial “capital” expense.
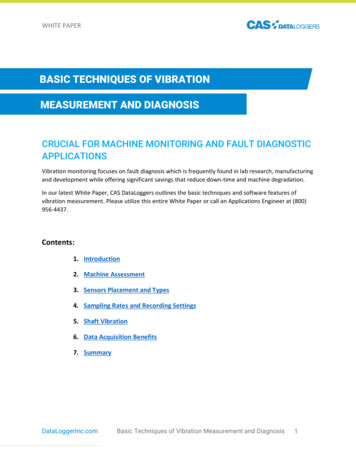
http://www.BetaMachinery.com4Case History 1:High Vibrations, Acceptable Forces,Structural ResonanceA newly installed boiler feedwater pump was started up and found to have excessive radialvibrations on the bearing housings of the pump (over 0.5 in/sec pk) primarily at vane passingfrequency as well as high radial and axial vibrations on the motor at shaft frequency.We were requested to analyze the problem and make recommendations. The pump purchaserwas holding up the order for two more of the pumps until the problems were resolved.Upon arrival at site, we were informed that the pump had been tested at the factory (in Europe)before shipment. Vibration levels less than 0.2 in/sec peak were observed and consideredacceptable during the factory test. However, due to the fact that standard European powerfrequency is 50 Hz versus 60 Hz in North America, the factory tests had been at 3000 RPMversus 3600 RPM on site.It was concluded, after our testing, that the pump impellor design was acceptable. Severalresonances were shown to be amplifying otherwise acceptable force levels.Possible courses of action for reducing the vibrations were presented to the pump end-user, whothen presented our findings to the manufacturer.Description of System:The system schematic layout and operating conditions are presented in Figure 1.The pump had plain journal bearings cantilevered from the main pump about 10 inches. Theimpellor had 4 stages with 7 vanes on each impellor. The diffusers had 6 vanes.The pumps were operating at a head of about 2160 feet of water during our tests. Based on thePump Characteristics Curves supplied with the pump, the pump flow rate was about 800 US gpmand the pump efficiency was near optimum at 70 to 75%. No flow measurement was available inthe system to confirm the flow rate estimates.The induction motor had rolling element bearings and operated at 59.5 Hz (3570 RPM). Vanepassing frequency was approximately 417 Hz.
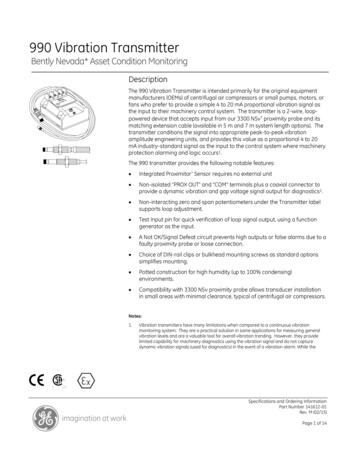
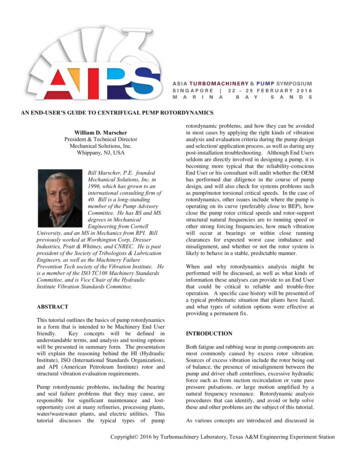
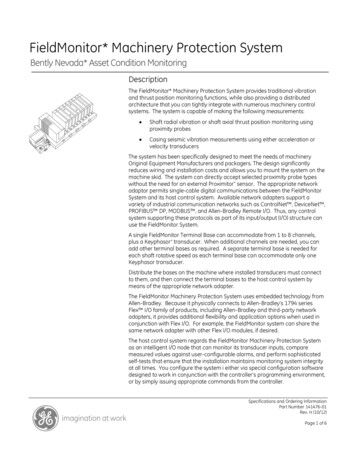
http://www.BetaMachinery.com5Testing:The vibration levels at or near the four bearings were recorded initially. The unfiltered readingsshowed high vibrations, particularly on the pump inboard. These data are presented in Table 1 interms of both velocity and acceleration. They are also presented in Figure 2 in spectral form.The coupled motor vibrations were high also as show in Figure 2. Uncoupled, the motor did notrun very much smoother. The uncoupled motor vibration data are presented in Table 2 andFigure 3.The majority of the vibrations on the pump bearings were observed to be at 7 times shaft speed.This frequency coincides with vane passing frequency on the impellor. The pump body did notshow high levels of vibration. Immediately, suspicion fell on the impellor design. The pumpcharacteristics had been extrapolated from 3000 RPM tests. Could an error have been made inthe design? Were the impellors not staggered on the shaft? The buyer believed that theimpellors were staggered, but we did not see the impellor to confirm this point.In an attempt to further our understanding of the pump, we measured pressure pulsations at theoutlet of the pump. The spectrum of these pulsations is presented in Figure 4.Also shown on Figure 4 are dimensions associated with the pulsation measurement. Thepressure transducer was located at least 43 inches from the pump impellor.Calculating the speed of sound in water at 330 degrees Fahrenheit inside a pipe of non-uniformwall thickness (due to the presence of the valve) gives an approximate value of 4000 to 5000 feetper second. The wavelength of 420 Hz pulsation (7 times shaft speed) will be in the range of 150to 100 inches, making the distance from pump to pressure transducer close to a half-wave length.Assuming the pump is a velocity source, the pressure transducer was probably near a pressureminimum in the standing wave pattern at 420 Hz throughout the discharge piping system. Thismeans that pulsations elsewhere in the system, including in the pump could have been muchlarger than measured. Unfortunately, the test valve used was the only one available in thedischarge piping.Reference “4” suggests that pulsations less than 3% of line pressure are acceptable in centrifugalpumps. Pulsations were less than this limit at the measurement point.The results of the pulsation measurements did not prove that the impellor design wasunacceptable, nor that there was an acoustical resonance in the piping. They did not prove thatthe impellor design was adequate either.
http://www.BetaMachinery.com6In summary, at this point in the analysis the impellor design was still suspect. Without furtherinformation the manufacturer would have had to review all facets of the hydraulic design of thepump.Dynamic structural testing (using impact techniques) on the bearing housings of the pump(stopped) was performed at this stage. Figures 5 to 9 show plots of transfer functionsrepresenting a ration of vibration velocity to input force for the bearing housings on the pump andthe pump body itself.The coherence functions represent the statistical accuracy of the transfer function (T.F.)measurements (coherence close to 1.0 indicates “good” data). The vertical scale for coherencefunctions varies from zero to one as shown in Figure 5.Peaks in the transfer function plots represent resonances. That is, vibration velocity is shown toincrease without any change in the driving force. The absolute flexibility is not shown in the plots.Note that Figures 5 and 7 have a vertical sensitivity reduced by an order of magnitude comparedwith Figures 6, 8 and 9.Phase angle measurements give further confirmation of the presence of resonances. The verticalscale for the phase plots is always 100 degrees per 10 divisions as shown.Analysis of Figures 5 and 6 shows a horizontal structural resonance on the outboard bearinghousing at 424 Hz (approximately equal to vane passing frequency) which does not appear onthe pump body. Figure 7 shows the vertical structural resonance of the outboard bearing to besomewhat below vane passing frequency.Figures 8 and 9 show a broader frequency range with high flexibility for the inboard bearing thanfor the outboard bearing. Again, however, the resonant region is clearly present at vane passingfrequency for a 7 vane pump operating at 3600 RPM. At 3000 RPM, no such problem wouldappear.At this stage of the analysis, several courses of action were possible.(a)Have the manufacturer change the number of impellor vanes to removecoincidence of vane passing frequency with the structural resonance. Thiscourse would have been costly and time consuming.(b)Accept the pumps, confident that the hydraulics of the impellor design wereacceptable. Knowing that the resonance was present to amplify response atvane passing plus the low pulsation measurements made the conclusion of goodimpellor design reasonable. However, the relationship between stress levels andvibration leads one to be wary of accepting such high levels of housing vibrationon a new pump.(c)Attach vibration absorbers to the pump bearing housings.(d)Require modifications to the pump to lower vibration levels. These modificationsin simplest terms could be increased stiffness or increased mass to raise or lowerthe structural resonances of the bearings and thus avoid coincidence with vanepassing frequency. This course was followed. Several modifications were testedto find a correction for the resonance problem.
http://www.BetaMachinery.com7MOD 1 A hydraulic jack resting against the pump body was used to stiffen the outboard bearingin the horizontal direction. The housing static deflection was limited to .001”, measured with adial indicator relative to the pump body.MOD 2The static deflection was increased to .002”.MOD 3A second jack was added on the opposite side and was loaded to reduce thedeflection to zero.Figures 10 to 13 show the “as found” and resulting transfer functions measured at each step inthe modifications discussed above. The expected reduction in vibrations at 424 Hz can becalculated from the reduction in measured dynamic flexibility in the plots. The best reductionobtained was a factor of 2 for MOD 3.Modifications to reduce resonant frequencies were attempted next.MOD 4The jacks were removed and weights totaling 20.5 lbs. were clamped to theoutboard bearing housing.MOD 5The weight was increased to 50 lb.Figures 14 to 16 show the as found and resulting transfer functions measured on the pump. Notethat Figure 16 is for the vertical direction. The best expected reduction in vibrations for MOD 5appears to be greater than a factor of 20 in the horizontal direction.Figures 17 and 18 show the spectra of running vibrations on the pump with various sets ofweights added to the bearings.Figure 17 shows vibrations at A, first with 38 lbs. clamped on bearing A, and then with 38 lbs.,also on bearing B. Note the further reduction at A due to lower vibrations at B.Figure 18 shows vibrations at B, first with 38 lbs. added only on bearing A, then with 38 lbs. alsoon bearing B.Figure 19 shows vibrations across the machine with 47.5 lbs. of weight clamped on both of thebearing housings. Note that the vertical vibrations have increased at bearing B at vane passingcompared with the 38 lb. weight results in Figure 18, while the horizontal vibrations havedecreased.The motor vibration remained to be analyzed. Further structural response tests were made onthe motor in the horizontal and axial directions. Refer to Figures 20 and 21. These Figures showstructural resonances present at the same frequencies that show high response on the motor inFigures 2 and 3.The skid showed signs of poor design which would explain the structural resonances. The skidwas concrete filled, but the concrete was not connected to the steel due to shrinkage.Our recommendation for vibration reduction on the motor was to rebuild the skid.
http://www.BetaMachinery.com8Case History 2:High Vibrations, Unacceptable Forces,Structural ResonanceHigh vibration levels were observed on a steam turbine driving a centrifugal compressor. Theunit had been in operation for about 17 years without incident.The problem appeared as an increase of vibration on the turbine inboard bearing housing. Theowner decided that a problem had developed with the turbine. The spare rotor was installed, butno change in vibrations resulted. Next, a new coupling was ordered (at premium rates). Twoweeks later, it was installed. No change was observed in vibrations. Alignment was changed butagain, no decrease in vibration was produced. Balancing on the coupling was performed withmixed results. Vibrations were reduced on the turbine inboard bearing but were increased on thecompressor inboard.At this stage, we were brought into the job. Our analysis showed that the turbine inboard bearingwas resonant at the problem frequency. The case vibrations were reduced to acceptable levelsby installing stiffeners under the turbine bearing. Realignment and trim balancing further reducedvibrations. However, we concluded that the sudden change in vibrations was still significant andrecommended that the compressor be inspected at the earliest convenience time. It wassuspected that cracks were present on the rotor and small pieces of metal were being lost.Later inspection proved the analysis to be correct. The compressor balance changed. Theturbine inboard bearing was the most sensitive structural component and showed the highestlevel of vibration on the unit. The compressor bearing housings were much stiffer and showedlittle case vibration before or after the change in rotor balance. Shaft-relative readings alsoshowed larger shaft motion at the turbine inboard than at the compressor inboard.Proper analysis of this machine problem in the beginning could have saved much time and lostproduction, not to mention unnecessary changes to the unit.
http://www.BetaMachinery.com9Case History 3:High Vibrations, Unacceptable Forces,No Structural ResonanceHigh vibration levels were observed on a wood pulp refiner. It was noted that the vibrations wereparticularly high in the axial direction and that the axial motion of the motor (8000 HPsynchronous, 3600 RPM) was out of phase with respect to the refiner motion. High levels ofvibration were noticed after the grinding plates on the rotor had been replaced.An analysis was performed for the owner and it was suggested that the alignment should berechecked because of the high axial vibration and the “out-of-phase” motion. The ownerrequested an additional analysis by us.We observed that the motor-refiner combination was mounted on an inertia block (concrete, 10 ftx 30 ft x 3 ft). Shaker tests by us on similar units had shown that the flexible mode of vibration ofthe inertia block was consistent with the phase relationship of the axial motion of the motor andthe refiner. The system was not resonant, however.The refiner was run with the replaceable disc removed from the rotor. Vibrations decreased toacceptable levels.It was concluded that the total problem related to imbalance of the replaceable disc on the rotordue to a lack of concentricity between the factory jig and the centre of the disc, or between thedisc and rotor centres. The mode shape of the vibration converted radial forces at the refiner discinto axial motion at the bearings due to flexing of the inertia block.This case is an example of the problem one has using phase measurements alone to diagnosethe presence of misalignment. Understanding the mode shape of the system is required.Trending Structural Response ChangesAnother use for structural dynamic measurements is the determination of changes in a structure.An intriguing example of this is mentioned in Reference 5, for use on offshore structures. Theresponse to wave action is used to detect cracks in struts supporting the platform. Vibrationtrends have been used regularly in the past, but the assumption is usually made that the rotor isthe only thing changing.Vibration trends have been used regularly in the past, but the assumption is usually made that thechange in forces generated by the rotating components is the cause of changes in vibration. Ofcourse, structural changes such as loose bolts, cracked legs, failed grout or loose bearing caps,to mention a few possibilities, could equally well be the cause of vibration changes. One way tocheck for this possibility would be to compare dynamic response data.
http://www.BetaMachinery.com10Conclusions:The diagnosis of machinery faults should be based on as many pieces of information as possible.Different sensors should be used wherever possible. Past history is extremely valuable andshould be reviewed when available.The dynamic structural response of all vibration test points should be a basic part of vibrationanalyses. These data should be recorded when the unit is newly commissioned and periodically(eg: at shutdowns) afterwards. The structural response includes the mode shapes of vibration atkey frequencies.Structural response and vibration readings permit the estimation of forces in the machine.Decisions regarding how to solve problems can be made more rationally with this information,thus reducing downtime and saving money.
http://www.BetaMachinery.com11References1.“Some Considerations in Adopting Machinery Vibration Standards”A. Stewart Maxwell, Preprint for presentation to Vibration Institute.2.“Machinery Vibration Criteria”Lionel M. Lortie, Vibration Institute.3.“Program Machine Maintenance by Measuring Vibration Velocity”Steve Maten, Hydrocarbon Processing – Sept. 1970 pp 291 – 2964.Survey of Feed Pump Outages” FP-754Prepared by Energy Research and Consultants Corporation,Morrisville, Pennsylvania, April, 1978.5.“Accelerometers used in Platform Inspection Method”pg. 92 Oil & Gas Journal – June 21, 1982
http://www.BetaMachinery.com12Figure 1: Layout & Operating ConditionsLayout:4 Stage Pump with 7 vanes on each impellor and6 vanes on the diffusersPumpGearCouplingInduction Motor3570 RPM, 700 HPOperating Conditions – “As Found”:TSuction330 dg.F. (variable)Pump Bearing TemperaturePSuction75 psigA: 40 dg.CTDischarge325 dg.F. (variable)B: 42 dg.C.P940 psigPump Head 2160 ft. H20Pump BearingOil Pressure20 psigBalancing Press.88.5 psig (203 f.o.w.)Discharge
http://www.BetaMachinery.com13Table 1“As Found” Vibration Data 7.19.21.631.3.64.6.48Din/sec pk.g pk.
http://www.BetaMachinery.com14Table 2Test M1TestPointMotor Vibration-UncoupledDirectionVibrationOverall in/sec pk*1Phase(WAT C. rticalAxial.22.19.17000NOTE;2X0138180180180*1 – See plots of spectra*2 – “1X” and “2X” refers to “shaft frequency” and“twice shaft frequency”.Test M2Loosening front left and back right anchor bolts (facing drive end of motor).This produced a 15% decrease in C, Horizontal when back right bolt was loosened.
http://www.BetaMachinery.com15“As Found” VibrationBoiler Feed Pump and MotorFigure 2
http://www.BetaMachinery.com16Vibration Data on the MotorUncoupled from the PumpFigure 3
http://www.BetaMachinery.com17Boiler Feed Pump PulsationMeasured on the DischargeFigure 4
http://www.BetaMachinery.com18Transfer Function MeasurementsBoiler Feed Pump, Outboard BearingFigure 5DirectionTest Point
http://www.BetaMachinery.com19Figure 6
http://www.BetaMachinery.com20Transfer Function MeasurementsBoiler Feed Pump, Outboard BearingFigure 7
http://www.BetaMachinery.com21Transfer Function Measurement on Boiler FeedPump, Inboard Bearing, HorizontalFigure 8Transfer Function Measurement on Boiler FeedPump, Inboard Bearing, VerticalFigure 9
http://www.BetaMachinery.com22Outboard Bearing, Horizontal, Transfer FunctionMeasurement. Repeated for Comparison withModified SystemFigure 10
http://www.BetaMachinery.com23Transfer Function Measured forMOD 1 (Stiffening)Figure 11DirectionTransfer Function Measured forMOD 2 (Stiffening)Test PointFigure 12DirectionTransfer Funtion Measured forMOD 3 (Stiffening)Test PointFigure 13DirectionTest Point
http://www.BetaMachinery.com24Transfer Function Measured forMOD 4 (Added Mass)Figure 14DirectionTest PointTransfer Function Measured forMOD 5 (Added Mass)Figure 15DirectionTest Point
http://www.BetaMachinery.com25Transfer Function Measured forMOD 5, Vertical (Added Mass)Figure 16Running Vibrations on Boiler Feed PumpOutboard Bearing with weights clampedto Bearings A and with weights clampedto Bearings A and BFigure 17DirectionTest Point
http://www.BetaMachinery.com26Running Vibrations on Boiler Feed PumpInboard Bearing with weights clampedto Bearing A and with weights clampedto Bearings A and BFigure 18DirectionTest Point
http://www.BetaMachinery.com27Running Vibrations on Boiler Feed Pumpand Motor with 47.5 lb weights clampedto Pump BearingsFigure 19
http://www.BetaMachinery.com28Horizontal Transfer Function and RundownResponse on MotorFigure 20Axial Transfer Function Measured on MotorFigure 21
Machinery Vibration Limits and Dynamic Structural Response Vibration monitoring of rotating machinery has developed over the years to the point where it is an accepted maintenance tool. Much effort has been applied towards developing guidelines regarding acceptable absolute levels of vibration. Discussions of some of these standards and