Transcription
WHITE PAPERBASIC TECHNIQUES OF VIBRATIONMEASUREMENT AND DIAGNOSISCRUCIAL FOR MACHINE MONITORING AND FAULT DIAGNOSTICAPPLICATIONSVibration monitoring focuses on fault diagnosis which is frequently found in lab research, manufacturingand development while offering significant savings that reduce down-time and machine degradation.In our latest White Paper, CAS DataLoggers outlines the basic techniques and software features ofvibration measurement. Please utilize this entire White Paper or call an Applications Engineer at (800)956-4437.Contents:1. Introduction2. Machine Assessment3. Sensors Placement and Types4. Sampling Rates and Recording Settings5. Shaft Vibration6. Data Acquisition Benefits7. SummaryDataLoggerInc.comBasic Techniques of Vibration Measurement and Diagnosis1
WHITE PAPER1. IntroductionTypical vibration monitoring applications include: Machine monitoringGenerator air gap measurementsVibration/damage diagnostics in transmissions, bearings and shaftsTest stands and individual partsShaft/bearing vibration in hydro & gas turbines/generators Air compressors/ fans/blowers Gearboxes and enginesAll of the above pieces of machinery and equipment have rotating parts that are vulnerable todamage. When machinery is run at a resonant frequency, any damage it sustains is increasedover time; therefore personnel need to detect developing failures as early as possible. With theaid of a handheld meter or data acquisition system, operators can setup a system and give theinformation to an engineer or senior technician for later analysis or presentation.In order to monitor vibration and decide on a measurement system, you first need to identifythe key parameters of interest in your specific application. For example, a technician willmonitor vibration on a blower differently than he or she will monitor vibration on a 1-megawattpiece of equipment.Once you know the specific frequency bands of interest in your application, you’ll set anyappropriate alarms for these. For example after recording data, you can view the peak-to-peakvalues along with the RMS signal, i.e. the average level of the vibration.Basic KnowledgeMachines are exposed to many different vibrations (amplitudes, frequencies) originating fromeither the equipment’s moving parts or from other external sources. Sensor measurementsprovide users with information about a combined time signal. The objective is to extract thesedifferent harmonic vibrations from the combined wave.DataLoggerInc.comBasic Techniques of Vibration Measurement and Diagnosis2
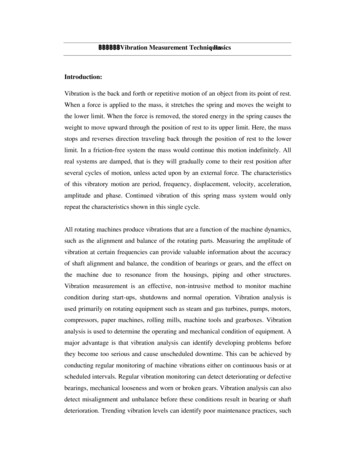
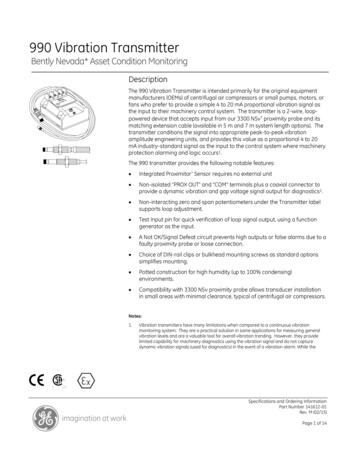
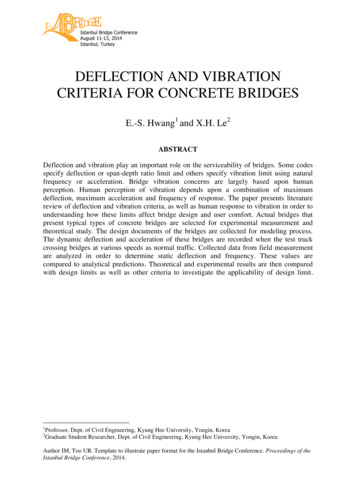
WHITE PAPERHarmonic Wave is defined by: Phase Angle (Phi) Amplitude (A) Frequency (f, Hz) (f 1/T) T (Time) Duration for One WavePopular Characteristics:Sm Peak ValueSpp Peak-to-Peak valueSm Mean ValueSeff TRMS (True Root Mean Square)The TRMS (Veff [mm/s]) is a very important characteristic used to classify the condition of theequipment. Reference tables are commonly available.DataLoggerInc.comBasic Techniques of Vibration Measurement and Diagnosis3
WHITE PAPERVibration MeasurementsThe most common measurements users take in vibration monitoring applications are: Acceleration g 9.81 [m/s2]. Acceleration is an object’s rate of change of velocity.Acceleration shows the direction and rate at which velocity is changing. Velocity V [mm/s]. Velocity is an object’s rate of change in position. Average Velocity isDisplacement divided by Time. Displacement (aka Deflection) S [µm]. Displacement is a measure of the overall changein position of an object.In another common application, Shock measurement, users record data and later view itsearching for a single event.Machine Condition Monitoring:Machine condition monitoring is one of the most critical vibration monitoring applications.Based on the physics of the given machine/equipment, users can determine the data they’relooking for, i.e. their frequency ranges of concern. In a typical application, users are looking forcharacteristic signals of machine failures, for example in hydroturbines, engines, etc. Thisrequires collecting vibration data and viewing the peak-to-peak values.For example when monitoring a hydroturbine, a technician can look at its specific design ormachine datasheet and identify, given its listed RPM, (i.e. blade passing frequency), thefrequencies of concern.Given that there are frequencies beneath our hearing, personnel can’t always detect imminentmachine failure just by listening for noise. Additionally, in many instances, if you hear a bearingrumbling, this is an indication that it won’t last much longer—sometimes just a matter of daysor even hours. Therefore, condition monitoring is best performed using a vibration recordingdevice.DataLoggerInc.comBasic Techniques of Vibration Measurement and Diagnosis4
WHITE PAPER2. Machine AssessmentEffective machine assessment encompasses: Shaft Vibration Bearing Vibration Bearing ConditionVibration Measurement devices:Data is in analog signal form in vibration monitoring applications, although users can distill thisdown to one signal to summarize the data. Depending on the vibration data of interest,personnel may or may not want to use a simple handheld vibration meter to view a singlecharacteristic value while displaying data trends. Alternately, users may just want to view thebaseline value and a trend, so they’ll use one or two analog signals.Meters and modules are ideal for simple applications such as monitoring a factory motor byrecording machine vibrations and reducing them to a single analog output. Moreover, a 4-20mAsignal can then lead out to a PLC for effective process monitoring. This method gives users aquick way to loosely determine machine condition, but omits a great deal of information bycondensing it in this fashion.By contrast, in more complicated cases such as a 10 MW wind turbine, technicians will need touse a vibration monitoring system to accurately capture their data of concern. Advancedvibration measurement incorporates technology such as a built-in DSP for local analysis,multiple trigger inputs to handle different sample rates, and expansion support to include othersignal types such as temperature.Process Steps: Measurement of Vibration Data Calculation Characteristics FFT (Fourier Fast Transform) Spectrum Analysis Diagnostic Considerations: Operator Experience, Machine Datasheets, Trending overTime, Comparison to StandardsDataLoggerInc.comBasic Techniques of Vibration Measurement and Diagnosis5
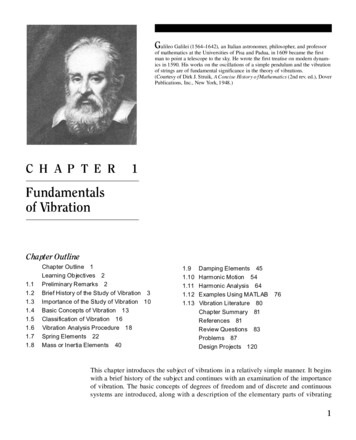
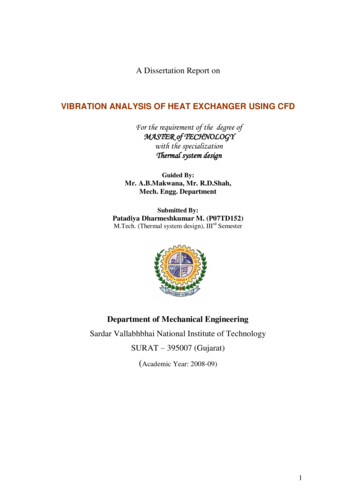
WHITE PAPERThere are two vibrations of concern to be measured: Periodic: A periodic signal is a constant waveform, so analysis and interpretation arehandled differently according to the individual machine. Every rotation conforms to acertain frequency. Many systems are designed to record periodic measurements formachine monitoring purposes. Non-periodic: An example of non-periodic, i.e. non-constant, signals is found when twopieces of metal collide in a machine. This type of vibration requires more engineeringanalysis than periodic signals do, owing to their spontaneous nature.3. Sensors Placement and TypesSensor placement:Correct sensor placement is critical to gathering accurate, usable vibration data. As an example,when monitoring a generator, users can mount or bolt a few sensors onto the output shaft of aturbine, a few inside the generator, and a few more between the shaft and generator. Twosensors are typically mounted at 90 angles to get the X Y axes.To measure the vibration of equipment, the following two sensors can be used:A. For Shaft Vibration: (Relative Vibration): Eddy current displacement sensors [µm]B. For Bearing Vibration (Absolute Vibration):o Accelerometer a [m/s2]o Velocity sensor s [mm/s]DataLoggerInc.comBasic Techniques of Vibration Measurement and Diagnosis6
WHITE PAPERShaft Eddy measurement:Current probes are used to measure the displacement of the shaft eddy.One possibility is to measure perpendicularly against the shaft center line. The maximumexpansion that can be measured with eddy probes is about 8mm.Another possibility is to measure against cones. The advantage here is that expansions of morethan 8mm can be measured. The common cone angle of 14 provides a ratio of 1:4.To process the Eddy Current signal, two options are possible: Option 1: Take the analog signal of the eddy probe and measure the gap voltage with avibration data logger. Option 2: Take the analog signal of the eddy probe and process the signal using thevibration data logger. Configure a characteristic channel for Mean Value and use thisvalue to calculate the expansion on cone level. Afterward apply the SIN calculation.Characteristic Monitoring:Characteristic Frequencies:Typically users have one or several known characteristic frequencies which they need tomonitor. For example, a bearing’s frequency characteristics include particulars such as thediameter of the bearing’s rollers, or in the case of a shaft, it turns at a certain frequency.For the analysis of a large and defined spectrum (e.g. from 10Hz to 0.001Hz), all differentcomponents are considered in the calculation of the characteristics.4. Sampling Rates and Recording SettingsSampling Speed:When looking for a device to record vibration, the speed at which you want to sample data(sampling speed expressed in Hz) depends on the equipment you’re monitoring. Commonexamples include:DataLoggerInc.comBasic Techniques of Vibration Measurement and Diagnosis7
WHITE PAPER Large turbine 10 Hz (revolutions) per second Standard electric motor: about 1700 RPM 30Hz per second Air compressor 1700-3600 RPM Large gas turbine Can rotate as fast as 40,000 RPM, with frequencies around 1,000 Hz.It is important to choose the appropriate sampling rate according to the given application. Therate should be 5-10 times faster than the highest process frequency to have a proper timesignal curve. As a rule, sample at least 2 times faster than the maximum frequency of theprocess.Note that if the sample rate is equal to or smaller than the process frequency, users will getunusable results.The Alias Effect is an expression for measuring a frequency which does not exist in reality dueto low sampling rates. Some data acquisition software has an Alias Filter that can be activatedfor every sensor input.Speed Measurement:The best way to measure speed is to use a frequency input on a data logger. This requires adigital signal.The other option is to take an analog signal from an eddy current probe’s input to the datalogger and create a characteristic channel in the datalogger’s software called ‘Rotation Speed.’A level of 900 µm is considered a good level to detect the peak of each revolution.Limitations of Analog Rotation Speed Measurements:The disadvantage of measuring speed from an analog signal is in attempting to configure thecorrect sample rate. The speed measurement only works correctly for certain sample rates forcertain speed intervals.DataLoggerInc.comBasic Techniques of Vibration Measurement and Diagnosis8
WHITE PAPERRecording Settings:Sensors: Vibration Severity sensors: These measure acceleration and provide the TRMS forvelocity. Displacement sensors: Displacement sensors use the Eddy Current principle to measurethe distance between the sensor head and e.g. the rotating shaft. Thus they are usefulfor monitoring shaft displacement on large pieces of equipment or for measuring rotorvibration.Raw measurement data is directly processed on a vibration data logger or data acquisitionsystem which can then transfer calculated data to a PC for later analysis using specializedsoftware.Time Signal:The time signal is the initial and original input from the sensor. Data from the sensors will beused to calculate all characteristics (indicators) afterwards.The TRMS value is calculating using the Time Signal.Based on the Time Signal, the FFT-Spectrum can also be calculated.DataLoggerInc.comBasic Techniques of Vibration Measurement and Diagnosis9
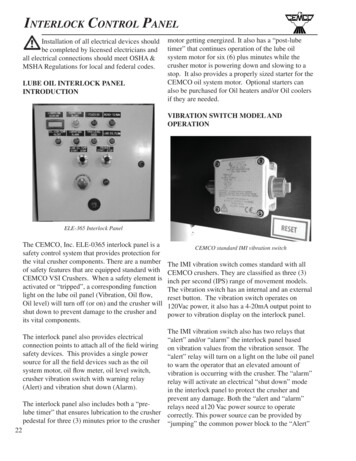
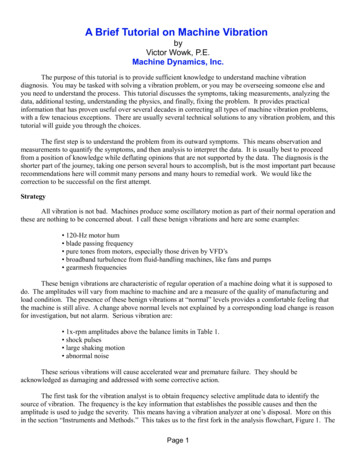
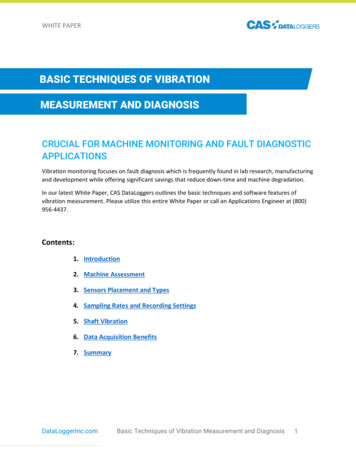
WHITE PAPER5.Shaft VibrationShaft vibration measurement is very useful for monitoring turbines in condition monitoring andfault diagnostics applications. The connected sensors measure the gap (distance µm) betweenshaft and bearing.If two sensors are installed at a 90 angle, it is possible to visualize the eccentricity (movement)of the shaft center.Continuous Sampling:Non-Continuous Sampling:DataLoggerInc.comBasic Techniques of Vibration Measurement and Diagnosis10
WHITE PAPERFourier Fast Transform (FFT):Using the FFT algorithm, users can take a signal within a time domain and reference it with afrequency domain. Using a data acquisition system with a built-in FFT function, users performthe transform to extract the information from the raw signal. By taking a time signal andrunning it through an FFT algorithm, users can divide it into frequency bins. In this way, userscan view the time/frequency resolution, i.e. process the data in real-time.During configuration, many systems allow you to set parameters for the FFT or to pick FFToptions from a software library.Rotation Speed:The Rotation Frequency should be obtained from a digital pulse.RMS value:It is possible to calculate the RMS values for up to 3 individual frequency ranges from the FFTspectrum. It is also possible to link the frequencies to different rotation speeds.Main Frequency and Amplitude:From the FFT-Spectrum, users can also extract the characteristic Main Amplitude and MainFrequency.Phase of Main Amplitude:To calculate the phase angle, users must record/detect a clean trigger signal after eachrevolution of the shaft.From the time signal, the phase angle of the main amplitude can be calculated.Maximum of Vector Sum:With the phase angle, the position of the maximum amplitude is indicated.With the maximum of vector sum, it is possible to calculate the height of the amplitude.DataLoggerInc.comBasic Techniques of Vibration Measurement and Diagnosis11
WHITE PAPERWaterfall/Cascade Charts:Waterfall (aka cascade) diagrams display an entire range of frequencies changing over time.This provides users with a high level of detail over the long term.6. Data Acquisition BenefitsUsing a Data Logger for Expansion Calculation:You can use a calculation channel to calculate the differential expansion on cone level.You can also apply SIN calculation to know the absolute expansion in shaft center line direction.Special Data Logger Trigger Features:Using a data logger, it is possible to analyze signals before certain trigger events happen.The pre-trigger can be configured in individual rates (expressed as percentages) which will thenapply to all sensor inputs. This feature is very useful for fault tracing.Advanced Measurement System Software:Many systems on the market are designed specifically for vibration measurement and allowusers to simply input their frequencies, while other devices have a vibration option. As a highend example, modern systems are capable of sampling speeds of 1,000 samples/second and ofcomputing 1,024-pt FFT, while monitoring vibration on 4 channels. Users can then give the infoto whoever needs it for analysis or presentation.Data acquisition software includes several vibration-specific analysis functions including: Polar diagramsFFT charts of magnitude and phase vs. frequencyShaft centerline chartsBode plotsSpectrograms and waterfall chartsThe different diagnostic characteristics can be used to configure individual control screensaccording to customer needs.DataLoggerInc.comBasic Techniques of Vibration Measurement and Diagnosis12
WHITE PAPER7. SummaryWith effective vibration monitoring, operators can monitor every characteristic in regard tolimit values in order to visualize alarms. Depending on the parameters, the engineer canmonitor and fully analyze equipment status for preventive maintenance actions. After someinitial setup and configuration, technicians can rely on vibration monitoring as an effective earlydetection method for machine damage or failure.Contact Information:CAS DataLoggers, Inc.8437 Mayfield Rd, Unit 104Chesterland, Ohio 44026(440) 729-2570(800) omDataLoggerInc.comBasic Techniques of Vibration Measurement and Diagnosis13
A. For Shaft Vibration: (Relative Vibration): Eddy current displacement sensors [µm] B. For Bearing Vibration (Absolute Vibration): o Accelerometer a [m/s. 2] o Velocity sensor s [mm/s] DataLoggerInc.com Basic Techniques of Vibration Measurement and Diagnosis 6