Transcription
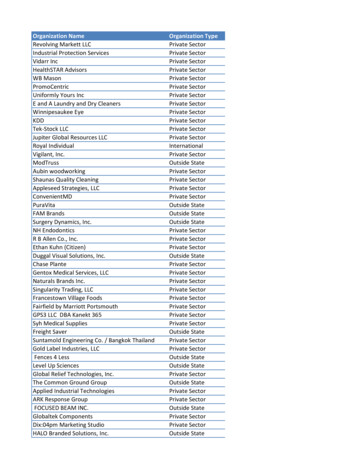
B.Achieve the State’sGreenhouse GasEmission’s Limits281. WashingtonState Emissions292. Pathways toDecarbonization323. Modeling Implicationsfor Washington'sEnergy Policy45Washington 2021 State Energy StrategyTransmission tower, Bonneville Lock and Dam.Clean Energy Transition Institute
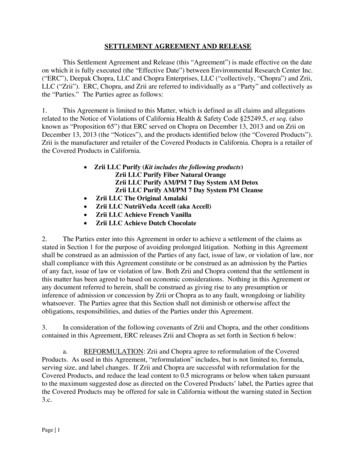
B. Achieve theState’s Greenhouse GasEmission’s Limits1. Washington State EmissionsWashington’s residents and businesses were responsi-greenhouse gas emissions in 2018 were from theble for 98.9 million metric tons of greenhouse gas emis-electricity sector. Buildings and industry comprisedsions in 2018, the year of the most recent state emissionsnearly a quarter of emissions, and non-energy/non-CO2inventory. Nearly half (45%) of the emissions were fromemissions were approximately 15%. (See Figure 6.)transportation. The state’s transportation emissionsapproximate the U.S. average per capita: compared toother states, Washingtonians drive slightly less per capita26Washington’s greenhouse gas emissions have grownby roughly 10% since 1990, the baseline year from whichbut consume more fuel for freight, air and ship travel.to calculate the state’s emissions limits. Consequently,The reason transportation is dominant in Washington’s1990 translates to a 53% reduction relative to emissionsgreenhouse gas emissions profile is due to the state’s rela-in 2018. (See Figure 8.)the 2030 emissions target of a 45% reduction relative totively clean electricity supply. Only 16% of Washington’sFIGURE 6. WASHINGTON STATE 2018 GREENHOUSE GAS EMISSIONS INVENTORY BY SECTOR10090ElectricityEmissions CO2e (MMT)807060Transportation50Energy andIndustry CO240302010Residential/Commercial/Industrial (RCI)Industrial CO2Non-CO20Source: Washington State Department of Ecology Greenhouse Gas Inventory.26U.S. VMT Per Capita By State, 1981-2017,” 2019, -capita-by-state-1981-2017/.Washington 2021 State Energy Strategy29
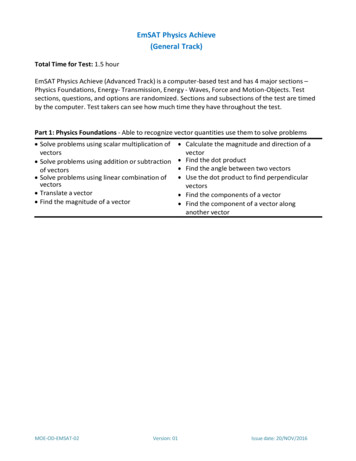
The state’s 2018 emissions result from energy consump-Washington's emissions have growntion as depicted in Figure 7 below, which shows an esti-roughly 10% since 1990, the baseline yearmate of Washington’s energy consumption in 2018 usingEnergy Information Agency data.27from which reductions are calculated.FIGURE 7. ESTIMATED WASHINGTON ENERGY CONSUMPTION IN 2018Source: LLNL June, 2020. Data is based on DOE/EIA SEDS (2019). Lawrence Livermore National Laboratory and the Department of Energy, under whose auspices the work was performed.Distributed electricity represents only retail electricity sales and does not include self-generation. EIA reports consumption of renewable resources i.e., hydro, wind, geothermal and solar) forelectricity in BTU-equivalent values by assuming a typical fossil fuel plant heat rate. The efficiency of electricity production is calculated as the total retail electricity delivered divided by theprimary energy input into electricity generation. End use efficiency is the estimated as 65% for the residential sector, 65% for the commercial sector, 49% for the industrial sector, and 21% forthe transportation sector. Totals may not equal sum of components due to independent Rounding. ties/energy27“Estimated Washington Energy Consumption in 2018,” Lawrence Livermore National Laboratory, accessed December 1, 2020, charts/Energy/Energy 2018 United-States WA.png.30Washington 2021 State Energy Strategy
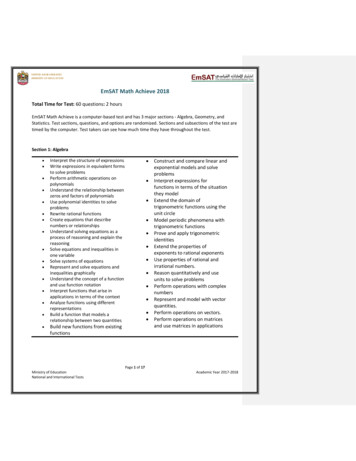
1.1. Pathway to Zero Net Emissions in 2050This strategy focuses on the CO2 emissions that resultThe objectives of the 2021 State Energy Strategy arefrom energy use, but the statewide emissions limits coverdirectly linked to the revised greenhouse gas emissionsall types of greenhouse gas emissions, including non-CO2reductions limits established by the Legislature in 2020.emissions, such as methane from agriculture, waste, andUpdating limits set in 2008, the Legislature establishednatural gas leakage, and perfluorocarbons in aluminumambitious economy-wide goals: a 95% reductionproduction. While reductions in non-CO2 emissions arebelow 1990 levels by 2050, with interim economy-widepossible, the solutions are highly uncertain.emissions limits of 45% below 1990 levels by 2030and 70% below 1990 levels by 2040.For the purpose of modeling for this strategy, we assumeIn addition, the state committed to net zero emissionswill be offset by biological or geological sequestration,by 2050, which means that the residual 5% (or 5 MMTCO2thereby achieving the net zero limit of state law. Thise) of emissions in 2050 will need to be balanced by anmeans that, in 2050, energy and industrial CO2 emissionsequivalent amount of biological or geological emissions(referred to as energy emissions in the rest of this section)removal from the atmosphere. These limits are estab-must be zero. This allows for the use of carbon-neutralthat all of the non-CO2 greenhouse gas emissions in 2050lished in statute and are based on scientific assessmentfuels, including zero net emissions biofuels and syntheticof the pace of emissions decline needed globally tofuels that capture carbon from the atmosphere andkeep warming to within 1.5 degrees Celsius aboverelease it again. Figure 8 shows the trajectory of limits topre-industrial levels.be achieved by 2050 based on Washington State’s 201828greenhouse gas emissions.FIGURE 8. WASHINGTON STATE 2030-2050 GREENHOUSE GAS EMISSION LIMITS(Assumes residual 5% of 1990 emissions remaining in 2050 will be offset by biological or geological sequestration)Emissions CO2e (MMT)1001990 Levels: 8.5% reductionElectricity from 2018806045% below 1990 levelsTransportation4070% below1990 levelsRCI20Industrial Process CO2Non- CO295% below 1990 levelsand net zero0201828Chapter 70A.45.020 RCW.29Chapter 70A.45.020 RCW.2020203020402050Source: Washington State Department of Ecology andWashington State.29Appendix A –Deep Decarbonization Pathways Modeling TechnicalReport, December 11, 2020 (p. 15).Washington 2021 State Energy Strategy31
ments to energy-using technologies in buildings, transportation and industry and displacing fossil fuel use, primarilyin transportation, with clean fuels.The challenge for Washington will be implementing adecarbonization strategy integrated across all sectors ofthe economy that reduces energy-related greenhouse gasemissions in half by 10 years.2. Pathways to DecarbonizationTo examine potential paths to meet the 2030 and 2050emissions limits, the Department of Commerce commissioned deep decarbonization pathways modeling. Thiseffort analyzed alternative decarbonization scenarioswithin a modeling framework to inform the selection ofpolicies and actions to decarbonize the state’s energysector over the coming decades.Evolved Energy Research conducted this analysis usingthe EnergyPATHWAYS and RIO modeling suite. EarlierBeakers with algae used to create biofuels. lilohversions of these models supported decarbonizationmodeling for the region and the state.30, 31 The modeling forthe state energy strategy incorporates current technology1.2. Washington’s 2030 Emissions Challenge:Cutting Energy Emissions in HalfMeeting the state’s emission reduction limit for 2030 is atleast as challenging as reaching the deeper 2050 limit andwill require all sectors of the economy to reduce emissionsat a rapid pace.and economic data; the state’s clean electricity and emissions limits; state and regional assumptions developed inconsultation with stakeholders; and a set of scenarios thatcapture the effect of potential strategies. The full technical report for the 2021 State Energy Strategy deep decarbonization modeling can be found in Appendix A. In thissection, we address the modeling’s key conclusions.Translated proportionately to the energy emissions, the2030 limit is equivalent to removing 45 million tons of the85 million tons of CO2 emitted from energy in 2018. The2.1. Decarbonization Scenariosstate starts from a 69% clean electricity grid that contrib-The deep decarbonization modeling explores oneuted 16 million tons of CO2 in 2018. If all electricity emis-Reference Scenario and five decarbonization scenariossions were removed, Washington’s 2018 emissions woulddescribed in Table 2. The results tease out the key oppor-have to drop a further 29 million tons to meet the 2030tunities and challenges in decarbonizing all sectors ofstate limit.the energy economy at the pace indicated by the state’sAdditional emission reductions will need to come frommeasures other than decarbonizing electricity. Theseemissions limits. All five decarbonization scenariosmodeled meet those limits.measures include electrification and efficiency improve-30“Deep Decarbonization,” accessed November 2, 2020, nvironment/deep-decarbonization.31Northwest Deep Decarbonization Pathways Study”, 2019, accessed December 1, 2020, https://tinyurl.com/y42w3a6v.32Washington 2021 State Energy Strategy
TABLE 2. REFERENCE AND FIVE DECARBONIZATION SCENARIOS ANALYZEDScenarioSummaryKey QuestionsPolicy MandatesReferenceBusiness as usualAssumes no emissions target and that currentpolicy is implementedNo constraints onemissionsElectrificationInvestigates a rapid shiftto electrified end usesWhat if energy systems achieve aggressiveelectrification and aggressive efficiency, and relativelyunconstrained in-state and out-of-state technologywere available?Transport FuelsInvestigates reachingdecarbonization targetswith reduced transportation electrificationWhat alternative investments are neededwhen larger quantities of primary fuels remainin the economy?Gas in BuildingsInvestigates reachingdecarbonization targetsby retaining gas usein buildingsWhat is the difference in the cost of decarbonization ifgas appliances are retained in buildings?ConstrainedResourcesInvestigates a futurethat limits potential fortransmission expansioninto WashingtonWhat alternative investments in in-state resourceswould Washington make if transmission expansion islimited due to siting/permitting challenges?Behavior ChangesInvestigates how lowerservice demands couldimpact decarbonizationWhat if policy-driven or natural behavior changes(i.e., more telecommuting post COVID-19) lowerservice demands?Meets 2050 netzero emissionstargetSource: Appendix A – Deep Decarbonization Pathways Modeling Report, December 11, 2020 (p. 21).Washington 2021 State Energy Strategy33
In each decarbonization scenario, the model finds thements and overall costs of decarbonizing the economy inlowest cost way of supplying energy to meet the 2030 andeach scenario inform the policy choices in the 2021 State2050 emissions limits. Technology costs are based onEnergy Strategy.the best publicly available projections. Actions to reduceThe Electrification Scenario explores the impacts of a rapidemissions cross the sectors of the economy. Comparingshift to electrified end uses. The Transport Fuels Scenariothe scenarios provides useful information about the bestmodels a slower transition to electrification in transpor-strategies for decarbonization, targeting the lowest costtation, either due to policy driving a more gradual shift, oractions first. Projected Reference Scenario emissions frombecause of slower than expected electric vehicle adoption.energy use and the energy emissions limits for the decarbonization scenarios are shown in Figure 9.The Gas in Buildings Scenario models a future wheredemand for gas in the built environment, such as forThe Reference Scenario reflects future developmentsheating and cooking, remains through 2050. Gas suppliedconsistent with the U.S. Department of Energy’s Annualthrough the pipeline can include a blend of differentEnergy Outlook’s Reference Scenario, as well as currenttypes of gas. This blend is referred to as “pipeline gas”policy in the region. For example, the state’s 100%throughout the remainder of the strategy. Pipeline gasclean electricity law (CETA) is reflected in the Referencecan be partially or even fully decarbonized by replac-Scenario. Even with the elimination of emissions froming fossil gas with cleaner alternatives such as biogas,electricity under CETA, Washington’s overall emissions dosynthetic gas or hydrogen.not decrease in the Reference Case because without newpolicies fossil fuel consumption will increase as fast asThe Constrained Resources Scenario models the impact ifthe electricity sector phases out fossil fuels.Washington were unable to expand transmission intertiesto other states. Finally, the Behavior Change Scenario eval-The decarbonization scenarios investigate differentuates the impact of consumer choices to decrease theirpathways toward reaching the state’s greenhouse gasenergy consumption by driving less and reducing theiremission limits, with each scenario reflecting differentdemand for energy services in buildings.32policy priorities and/or uncertainties in future outcomes.Comparisons between and among the different invest-FIGURE 9. WASHINGTON STATE TRAJECTORY TO 2050, BY ENERGY CONSUMPTION INEACH SECTOR90Total Emissions (MMT)807045% below 1990 levels60TransportationEnergy Decarbonization Limits5040Transportation30IndustrialRCI22.3 MMT2010095% below 1990 levelsand net zeroResidentialCommercial #2020202570% below1990 levels40 MMT20302035204020450 MMT2050Source: Appendix A – Washington State Energy Decarbonization Modeling 2020, Evolved Energy Research (p.17).32For the assumptions behind all six scenarios, please see Appendix A – Deep Decarbonization Modeling Technical Report, December 11, 2020.Appendix B – Data accompanying Deep Decarbonization Modeling Technical Report, December 11, 2020.34Washington 2021 State Energy Strategy
2.2. Changes in Energy DemandHowever, improvements in efficiency cannot happen over-In all five decarbonization scenarios, electrification andnight. Retiring existing equipment — a late model gasolineefficiency drive lower total final energy demand than invehicle for example — is expensive. Replacing equipmentthe Reference Scenario, where energy demand in 2050on that scale would be infeasible all at once. Therefore,increases by 6% relative to 2023, the year we assume thewe assume, conservatively, that customers invest in moreeconomy has recovered from the COVID-19 pandemicefficient equipment only at the end of the useful life of their(see Figure 10). In all scenarios other than Behaviorexisting equipment, a time when they would have boughtChange, customers have the same demand for energynew equipment anyway. The total stocks of equipmentservices. For example, they heat their homes to the samein homes, businesses and on the road is of varying agetemperature and drive the same number of miles.at any given time. It takes time to roll over total stocks ofequipment to more efficient and cleaner versions.Final energy demand varies because of differences inthe energy efficiency of the different types of equipmentUsing energy more efficiently through electrification andcustomers can use to provide these services. For example,other measures reduces overall demand and the invest-a battery electric vehicle requires less energy per mile thanment needed in energy supply infrastructure and fuels.an internal combustion engine fueled by gasoline.The costs of the new equipment necessary to lower finalFIGURE 10. FINAL ENERGY DEMAND 2020-2050COVID-19: 10% dropin demand in 2020due to COVID impactElectrification: 90% growth inelectricity sector over 2020levels, displacing fuelsReferenceElectrificationTransport Fuels:Demand for fuelsremains in 2050Buildings: Higherdemand for gas due toless electrificationTransport FuelsGas in BuildingsBehavior: Fewerenergy servicesdrive demand lowerBehavior ChangeFinal Energy Demand 400400200200002020 2030202020302040204020502020 20302050 2020Diesel FuelGasoline FuelDiesel FuelGasoline Fuel2030204020402050 2020 20302050 2020Jet FuelPipeline GasJet FuelPipeline GasElectricitySteamOtherBiomass2030204020402050 2020 20302050 2020ElectricitySteam2030OtherBiomass204020402050 2020 20302050 202020302040204020502050HydrogenResidual Fuel OilHydrogenResidual Fuel OilSource: Appendix A – Deep Decarbonization Pathways Modeling Report, December 11, 2020 (p. 28).Washington 2021 State Energy Strategy35
energy demand is likely greater than the cost of lessThis puts an even finer point on the need to encourageefficient equipment. However, reducing supply infrastruc-less energy use wherever possible.ture and fuel investments saves money. How a scenariocompares in total cost to any other depends on its relativedemand- and supply-side costs. Differences in the paceof electrifying transportation accounts for the largest2.3. Modeling the Supply SideThe previous section presents the demands for energydifferences in demand across all the scenarios.33in Washington with different assumptions about the typesIn the Electrification Scenario, total energy demandThe next step of the modeling determined the least-costdrops 28%. Electricity demand grows 90% over 2020way of providing that energy through investments in andlevels by 2050, displacing fossil fuels in buildingsoperations of Washington’s energy supply. This includesand transportation through assumptions that drivethe infrastructure to produce, store and transport fuelsreplacement of existing equipment with electrifiedand electricity.appliances and vehicles at the end of their useful lives.The Constrained Resources Scenario shares the samefinal energy demand as the Electrification Scenarioof equipment customers would adopt on the demand side.Section 1.2 introduced the challenge of reducing emissions by 2030. The relatively small amount of emissionsand is therefore not shown in Figure 10.from electricity in Washington means that if we were toTotal energy demand drops the least in the Transportreductions in other forms of energy use would still beFuels Scenario (23%). Demand for fuels is still significantneeded. By 2030, the system will look different, dependingin 2050 because greater numbers of internal combustionon the scenario, as described in the previous section.engines will remain on the roads. These vehicles havedecarbonize all electricity production, additional emissionslower energy efficiency than electric alternatives.Adopting electrified energy uses and more efficientThe Gas in Buildings Scenario sees a 24% drop in totalshare of the total demand, but overall total energy demandenergy demand by 2050. In contrast to the Electrificationwill be less. Due to the limits on how fast equipment canScenario, customers replace gas-consuming appliancesbe replaced with these more efficient options, reachingwith more efficient modern gas appliances.the target also requires reducing emissions by using cleanThe Behavior Change Scenario achieves the greatestdrop in demand for energy (32%) with less use of theservices that energy provides in transport and buildings.This scenario illustrates the benefits if policy makers actequipment means electricity demand will increase as afuels. Clean fuels in this section refers to fuels producedfrom biogenic feedstocks (biofuels) and fuels derived fromhydrogen production through electrolysis (synthetic fuels),including hydrogen itself.to encourage driving cars less and using fewer energyThis section explores these two top-line strategies inservices in buildings. As we will see, achieving the levels ofenergy supply:electrification required to hit the 2030 emission reductionlimit presents several technical and economic challenges.Greater interconnection among the11 Western states is a key part of allscenarios and points to the importanceexpanding electric loads2.Decarbonizing fuels to meet the short-termemission limitsof expanded regional coordinationand transmission to lower overallTotal demand for electricity nearly doubles by 2050 inSee Appendix A – Deep Decarbonization Modeling Technical Report, p. 2936Building a clean electricity sector to supply2.3.1. Building a Clean Electricity Sector to SupplyExpanding Electric Loadsdecarbonization costs.331.Washington 2021 State Energy Strategythe Electrification Scenario and expands significantly inthe other scenarios. Supplying this electricity from clean
electricity sources is cheaper than other alternatives, suchas decarbonizing fuels. Washington’s electricity supply isalready 69% clean because of the state’s significant hydroresource, however we assume there is no opportunity toexpand hydroelectricity supply in the future, so wind andsolar resources provide the additional energy needed.In 2020, Washington is a net exporter of energy. As renewable generation fills the state’s additional energy needs,Washington becomes a net importer, bringing in 43% of itselectricity by 2050 in the Electrification Scenario, 36% ofwhich comes from Montana and Wyoming wind. To understand where imports into Washington derive from throughout the West, please see page 39 of the technical report inAppendix A. The lower relative cost of these out-of-stateresources versus in-state opportunities limits the growthof new renewable capacity in state until 2040 when Washington starts to build solar and offshore wind.34Quantities of resources built in Washington are relatively similar across the decarbonization scenarios withthe exception of the Constrained Resources Scenario.By constraining transmission expansion into Washington, more clean electricity must come from in-stateresources. Prior to 2040, electricity needs are largelymet with increased imports of renewable energy fromother states as in the other decarbonization scenarios.Wind turbines seen from Steptoe Butte State Park, WA.However, in 2040 to 2050, significantly more in-statesolar and offshore wind are built as the capacity to importmore from elsewhere is exhausted. In-state solar capac-regional coordination and transmission to lower overallity in 2050 is 18 GW versus 12 GW in the Electrificationdecarbonization costs. Six GW of new transmission (theScenario, and offshore wind capacity is 10 GW versusmaximum permitted in the model) are added between4 GW in the Electrification Scenario.Montana and Washington and 5 GW between Idaho and35In all decarbonization scenarios, wind is the dominantWashington by 2050.36form of energy in the Western U.S. by 2050, followed byPart of the increase in electric loads in all scenariossolar. This drives expansion of transmission across thecomes from new flexible loads, including from electrolysisWest to take advantage of both renewable and geographicand electric boilers. Synthetic fuels derived from hydro-resource diversity. Northwest wind and Southwest solargen, such as clean diesel, gasoline and jet fuel, can beare relatively complementary resources, and energycheaply stored. This allows electrolysis loads to ramp upflows across the West increase to take advantage of thisduring periods of plentiful renewable energy productiondiversity to lower total system costs. Greater intercon-and reduce or go offline during times of lower renewablenection among the 11 Western states is a key part ofoutput. This novel, large flexible load helps balance theall scenarios and points to the importance of expandedgrid and shore up reliability.34Ibid, p. 29.35Ibid, p. 36.Ibid, p. 40.36Washington 2021 State Energy Strategy37
2.3.2. Decarbonizing Fuels to Meeting the Emissions LimitsThe need for clean liquid fuels to meet the 2030 emissionsAnother critical finding is the importance of clean fuels tolimits is driven in part by restrictions on the rate at whichachieving the 2030 and 2050 greenhouse gas reductionthe transportation fleet can be converted to battery electriclimits. In all decarbonization scenarios, liquid fuels are notor hydrogen vehicles and the rate that end uses in build-eliminated, but they are fully decarbonized by 2050 withings can be electrified. The 2030 limit requires significanta combination of synthetic fuels, biofuels and hydrogen.expansion of the clean fuels industry to reduce emissionsThese fuels are produced using renewable electricity,from transportation. Figure 11 shows how fossil fuels arebiomass or other biogenic feedstocks and, in some cases,decarbonized in three of the decarbonization scenarioscarbon captured from industrial processes. Clean fuelscompared to the Reference Scenario.substitute for fossil-based gasoline, diesel and jet fuel.FIGURE 11. CLEAN FUELS ARE IMPORTANT TO REACH DECARBONIZATION LIMITSFuels (TBtu)Run NameLiquid FuelsPipeline elsTBtu600400200Gas nH238Synthetic FuelsBiofuelsFossil FuelsSource: Appendix A – Deep Decarbonization Pathways Modeling Report, December 11, 2020 (p. 42).Synthetic FuelsWashington 2021 State Energy 252020200
2.4. Costs and Benefits of DecarbonizationAdditional equipment costs for decarbonization areEnergy costs include investments in supply-sidelargely offset by savings from the avoided purchase ofequipment, such as wind and gas turbines, transmissionfossil fuels. The decarbonization costs are the net differ-and clean fuels production infrastructure, and operatingence in costs between the decarbonization scenarios andcosts of the equipment, such as operations and mainte-the Reference Scenario. There are additional costs andnance and fuel. In the decarbonization scenarios, energybenefits not included in this calculation — the analysiscosts also include investments in more efficient orconsiders only direct infrastructure and operating costselectrified demand-side equipment, such as electricand does not include other categories, such as growthvehicles and heat pumps.in jobs. Health benefits to Washington residents fromThe costs of decarbonization include investments inimproved air quality are also not included in these totals.these categories that are greater than in the ReferenceAnnual energy spending37 as a percentage of GDPScenario. For example, expanding the electricity sectoraveraged over the 30-year period from 2020 to 2050 iswith rapid electrification of end uses requires moreonly slightly higher than the Reference Scenario for theinvestment than in the Reference Scenario, where loadsdecarbonization scenarios as Figure 12 shows. Rapidstay relatively consistent.electrification and efficiency measures, transmissionexpansion and access to out-of-state resources achievethe lowest costs in the Electrification Scenario.FIGURE 12. AVERAGE ANNUAL ENERGY EXPENDITURE 9%4.2%4.0%3.9%TransportFuelsGas ceElectrificationSource: Appendix A – Deep Decarbonization Pathways Modeling Report, December 11, 2020 (p. 52).37Annual energy spending is reported in this section as the levelized investment in infrastructure plus operating costs, such as for fuels and operations and maintenance.Washington 2021 State Energy Strategy39
The Transport Fuels Scenario, where fewer vehicles areEven in the Constrained Resources Scenario, Washing-electrified or transition to hydrogen, requires more cleanton relies on large quantities of imported energy. Basedfuels, which drives higher costs. But the slower transitionon forecasted prices additional investments in offshoreto EVs means fewer demand-side equipment costs. Notwind in 2045 and 2050 are reasonably competitive againstpursuing building electrification in the Gas in Buildingsout-of-state onshore wind and the investment in transmis-Scenario avoids investments in electricity distribution butsion to access it.relies on higher consumption of more costly clean fuels.Leaving gas in buildings in the short term will require evenmore clean fuel investment in the future.2.4.1. Decarbonization Spending across the ScenariosThe Constrained Resources Scenario yields cost resultsrelative to the Reference Scenario, based on the assumedthat are approximately the same as the Electrificationresource prices used in the model. DecarbonizationScenario, albeit with different investments in differentrequires a significant investment between 2020 and 2030locations. The Electrification Scenario invests in newto reach the stringent 2030 emissions reductions target,transmission capacity to access high-quality windbut energy spending in the lowest cost Electrificationand solar resources in other states. The ConstrainedScenario drops below the Reference Scenario in theResources Scenario invests less in transmission2040s (Figure 13).Net direct economic benefits exceed costs by the 2040sbut spends more to build renewable resources inand off-shore from Washington.FIGURE 13. TOTAL LEVELIZED ENERGY SYSTEM COST AS A PERCENTAGE OFWASHINGTON GDP RELATIVE TO HISTORICAL10%9%8%Historical7%% of 01520252035Source: Appendix A – Deep Decarbonization Pathways Modeling Report, December 11, 2020 (p. 55).40Washington 2021 State Energy Strategy2045
Demand for clean fuels drives cost increases in thebonizing the economy acts as a hedge against future fuelshort term, but the projected decrease in decarbonizationprice volatility by reducing the fraction of energy spendingtechnology costs results in savings over the Referenceon fossil fuel imports and therefore reducing exposure.Scenario in 2050 as seen in Figure 14. Decarbonizationcosts are projected to remain below the historical averageClean fuels are the key to achieving the 2030of energy spending.and 2050 greenhouse gas reduction limits.The economy is forecasted to grow at a faster rate thanThe rate at which vehicles can be convertedenergy consumption between 2020 and 2050 lower-to battery electric and building energy usageing energy costs as a share of total GDP. Price spikes incan be electrified is the critical factor.energy spending in the last two decades are caused byfuel price volatility a
1.1. Pathway to Zero Net Emissions in 2050 The objectives of the 2021 State Energy Strategy are directly linked to the revised greenhouse gas emissions reductions limits established by the Legislature in 2020. Updating limits set in 2008, the Legislature established ambitious economy-wide goals: a 95% reduction