Transcription
Short is LongSHORT IS LONGUsing dark pool short sales as a proxy for buying activityMarch 2018SqueezeMetricsResearchWe're going to do three things in this paper.First, we're going to tell you why a short sale in a U.S. exchange-traded stockis actually a meaningful indicator of buying activity. Then we're going todemonstrate this using only data that is freely available. Finally, we're goingto invite readers to replicate our results (and extrapolate) using the samedata, to which we will provide a URL.Why Short Is LongA short sale is the sale of a security that the seller does not own.Traditionally, short sales are associated with speculation―traders bettingthat a stock will go down.* See “Short SalePosition andTransactionReporting” in theReferences.† This is why MMsare exempt rch@sqzme.coBut according to the SEC, trades marked with the seller “short” compriseabout 49% of equity share volume.* In other words, about half of all sellingvolume in the market is short selling. Unless we actually believe that half ofmarket volume is speculative short selling, this demands an explanation.To understand, you need to know how market-makers (MMs) do business.Traditionally, market-makers make their money by “quoting a spread.” Thismeans placing a bid at, say, 19.95, and an offer at 20.00. Since the MMshave no position in the stock, the offer at 20.00 is necessarily entered as ashort sale―they don't own it, so they can't actually sell it.†Now imagine the common scenario where one investor sells to the MM at 19.95 and another buys from the MM at 20.00. Knowing that MMs placeshort sales at the offer, we know that only one of these trades will bereported as “short”―the one where the investor is buying stock at 20.00.InvestorMarket makerSale reported asBuysSellsShortSellsBuysLong (not short)March 20181
Short is LongThis means that whenever a market-maker fills an investor's buy order, theMM is facilitating the trade by shorting shares. Thus, short volume is actuallyrepresentative of investor buying volume, and non-short volume isrepresentative of investor selling volume. It's no coincidence that shortvolume is predictably half of total volume―short sales represent the buyinghalf of the market, and long (non-short) sales represent the selling half.Maybe you don't find this convincing. What about those speculative shortsellers? Don't they throw the number off? (No. That volume is tiny.) Whatabout passive sell orders from traders who aren't market-makers? Wouldn'ttheir sales show up as not short? (Yes. But they'll still be selling to a MM, sowe would correctly interpret them as sales.) The U.S. equities market isinfamous for its complexity―how can we make such sweeping assertions?Granted, it does seem that the market is too multifaceted, and opaque, forshort volume to simply equate to investor buying volume, but there's apractical reason that today's market is more transparent than you mightimagine. In a word, rebates. Here's the story.* Later in 1997, thetightest spreadactually changedfrom ⅛ to ₁₆, orfrom 0.125 to 0.0625.Back in 1997, when the U.S. market's tightest spread was 12.5 cents,* theIsland ECN (an off-exchange trading venue for NASDAQ stocks) started doingsomething different: They paid market-makers to do what market-makersalready do―quote a spread. Whenever a trader “took” the liquidity that theMM posted at the bid or offer, that trader would pay a small fee, and most ofthat fee would be given, as a “rebate,” to the MM.As a result, Island attracted all kinds of MMs, ending up with tighter spreads,and more depth, than their competitors. Naturally, customers liked this, andwithin two years, Island had gone from 3% to 13% market share of NASDAQvolume. The idea caught on and other exchanges, public and private, startedusing the “maker-taker” model and offering rebates. So spreads tightenedeverywhere.By 2005, when the SEC's Regulation NMS officially made sub-penny pricing areality, nearly everyone had adopted the maker-taker model. By then, MMsmade more money by collecting rebates than their traditional business ofquoting spreads. This was a new environment. There were tiny margins, andno margin for error―only the very fastest MMs would get that rebate.† While we don'tdeny the existenceof some“predatory” HFTs,they are High-frequency trading (HFT) is primarily the story of the mad scramble forthese rebates. If you submit an order to buy 100 shares of XYZ at the market,you will buy those shares from an HFT market-maker. If you later submit apassive limit order to sell 100 shares of XYZ at the offer, you will sell thoseshares to an HFT market-maker (once someone buys 100 shares from him ata higher price elsewhere). Call it “frontrunning” if you like, but competitionby MMs to garner the rebate has actually been a boon for the averageinvestor.†March 20182
Short is LongHere's why it matters to us: The competition to provide liquidity guaranteesthat the vast majority of orders go through MMs, because with spreads at apenny or less, they can't afford to let anyone else collect those rebates.Thanks to this state of affairs, there is a middle-man for just about everyorder that is executed on the market. Lucky for us, this middle-man alwaysleaves a trail―he is compelled to sell short whenever he fills a buy order.This decades-long struggle to collect a liquidity rebate, culminating inaggressive HFT market-making, is why short volume has become such astrong indicator of buying activity.* More on tick-levelshort sale data inthe Appendix.† This was pursuantto an SEC requestas part ofRegulation SHO.More on this in theAppendix.Testing the HypothesisWhat we would hope to find from a test is that high short sale volume ispositively correlated to intraday stock gains. Unfortunately, there is no realtime short sale reporting requirement, and so we cannot simply dig throughthe ticker tape to find the volume of short sales.* Luckily, we can use a proxy,and even better, it's free.Ever since 2010, FINRA has collected short sale volume data from their TradeReporting Facilities (TRFs).† The TRFs receive data from exclusively offexchange, or “dark,” venues. Some of these venues are Alternative TradingSystems (ATSs), or “dark pools” and some are “internalizers.” Since ouranalysis doesn't need to distinguish between types of off-exchange venues,we'll refer to all data from the TRFs as “dark pool” data.The only thing that's “dark” about a dark pool is that there is no pre-tradedata, i.e., there is no visible order book or quoting. The one thing that'sparticularly appealing about dark pools for the customer is that you can buyor sell stocks between the bid and ask prices, usually at the midpoint. This candramatically reduce trading costs.‡ The materialspresented inBarclays' 2014lawsuit made itclear that liquidityproviders are astandard feature ofdark pools.For a market-maker in a dark pool (don't be fooled, dark pools have MMs)‡this only changes one thing―midpoint trades mean spreads become eventighter (it's sub-penny). But for our purposes, this is irrelevant. The rebate isstill king, and the MMs will still buy what's sold to them and short sell what'sbought from them, just like they do on the lit exchange.With all of this In mind, the only suitability concern about using short volumedata from dark pools as a proxy for the whole market is that it just isn'tenough data. Fortunately, off-exchange volume accounts for about a third ofall trade volume. This should be more than enough to get a picture of thecorrelation between short volume and intraday stock gains―if there is one.Our approach to test short volume is simple: First, find the average intradayreturn (open to close) of all exchange-listed U.S. stocks, preferreds, CEFs,ETFs, ETNs, etc., from 2010 to present. This is the baseline return. Then,break down those intraday returns according to the ratio of dark pool shortvolume to long (i.e., not short) volume on any given day. Naturally, we expecthttp://sqzme.coresearch@sqzme.coMarch 20183
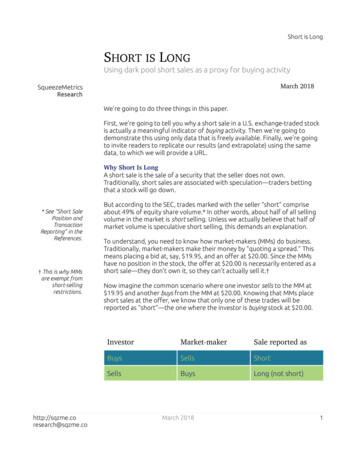
Short is Longto see that a higher short volume―representative of buying activity―iscorrelated to higher intraday returns. Here's what we found:Across a universe of 11,254 securities, listed between 2010 and the present,we are able to sample a total of 12.74 million discrete days of returns. Themean intraday return of this data is 0.003%―an average gain of threethousandths of a percent from open to close.When we subsequently halve the data according to dark pool short volumecomposition, the lower quantile being 0–49% short and the upper being 50–100% short, we find that the mean intraday return of the lower quantile is-0.0593%; the upper, 0.1184%.While this is already supportive of our hypothesis, we can see much moredetail when we average returns by percent, dividing the data into 101 parts,0 to 100%. In the following figure, intraday returns are plotted by theirrespective dark pool short volume percentages (blue) alongside datafrequency (green). The data is unfiltered and unedited.We think that it is difficult to dispute that higher short volume correlates togreater intraday returns. As short volume rises above 35%, average intradayreturns are uniformly positive. Similarly, below 35%, returns grow steadilymore negative, and remain so.http://sqzme.coresearch@sqzme.coMarch 20184
Short is Long* A few large blockorders originatingin dark pools islikely the cause oflower-than-average( 40%) aggregatedark pool shortvolume.† There is a highincidence of datawhere 100% ofvolume is short.This is likely abroker-dealershorting shares intoa customer accountas one leg of atransaction in avery illiquid stock.Especially if we focus on that part of the figure where data is most abundant(and thus the section of data that is most relevant), starting around 20% andending at 60%, we see a nearly linear relationship between short volume andintraday returns.Outside of this band of data, we encounter what could mostly becharacterized as “unusual” volume composition. Exceptionally low shortvolume will often be linked to days with large block trades between twoparties with no market-making intermediary.* Exceptionally high shortvolume will often be linked to either large buy orders facilitated by a brokeror a high volume of speculative short sales.†But, a few outliers aside, we expect that the figure above is able to speaksufficiently about the basic tendency of the data. For more information onthe source and nature of the data, see the Appendix.ExtrapolatingNaturally, we view this market phenomenon with more than academicinterest, and we expect that readers are similarly interested in practicalapplications. To that end, adventurous souls can retrieve the short volumedata used in this analysis directly from FINRA. A URL is provided in theappendix.The data is, of course, provided without warranty, and requires somewrangling. For advice or assistance in replicating the data we've used here,message us at the email address in the footer of this page.‡ As of this writing,DIX data isavailable athttp://dix.sqzme.co.Our own research suggests that there is, at least, longer-term predictivevalue in short volume data when aggregated. The Dark Index (DIX ) haschronicled, in dollar-weighted terms, dark pool short volume across allcomponents of the S&P 500 since 2011.‡ Because the index is dollarweighted, volume is multiplied by share value, giving more weight to largerand more frequently traded stocks.Very high relative percentages ( 45%) of dollar-weighted short volume areassociated with mean 60-market-day returns of 5.3%, as compared to amean of 2.8% across the whole dataset.Since DIX tends to rise into corrections, we are left to believe that it reflectsa broad willingness of investors to accumulate S&P 500 component stocks atlowered valuations, and that high levels of short volume correspond topositive medium-to-long term investor outlooks. This has certainly beenreflected in the data.The following scatter plot illustrates this relationship between DIX and S&P500 returns.http://sqzme.coresearch@sqzme.coMarch 20185
Short is Long* See “Short SalePosition andTransactionReporting” (2015)in References.† Ibid, pp. 19–20.More on“transaction-leveldata” in Appendix.It is unfortunate that we have less than 10 years of data to perform thesetests, but the SEC has been reluctant to make more, or more detailed, dataavailable. Among cost feasibility concerns, the SEC worries that providing toomuch data to the public may facilitate strategies disruptive to liquidityproviders (MMs).*Furthermore, they go on to say that:Market participants, including issuers and investors, do not appear towidely monitor or use this data, and data vendors informed theDivision [of Economic and Risk Analysis] that they had not createdproducts utilizing this data. The Division is unaware of the transactionlevel data being widely used by any group other than academics.†Given what we see as potentially valuable information, this may come as asurprise. How can this data have been overlooked? (Academics don't count.)Our suspicion is that the explanation is simple: The conceptual link betweenshort sales and investor buying activity―the key to understanding what“short volume” really means―has never been clearly drawn before.And so, armed with this fresh understanding, we hope that the reader mightfeel compelled to explore this new avenue of market data. And perhaps tobe more receptive, generally, to the value of unconventional data andmethods in the investment process.http://sqzme.coresearch@sqzme.coMarch 20186
Short is LongAppendixThe data used to test intraday short volume to stock returns is FINRA's “Reg SHO Daily Files.” The mostrecent year of this data can be found at the following URL.http://regsho.finra.org/regsho-Index.htmlThe Reg SHO Daily Files come from two separate TRFs, NYSE and NASDAQ. There is no meaningfuldistinction between the two (reporting is rather arbitrary), and they should be added together togenerate total off-exchange short volume and total volume numbers. We ignore “short-exempt”volume for our analysis.Even less known than the daily files are FINRA's “Monthly Short Sale Transaction Files,” which providedetailed trade activity (including timestamps) of all off-exchange short sale transactions. The data canbe found at the following on-sho-2018A more thorough evaluation of short volume data would include data from lit exchanges. While theCBOE (formerly BATS) exchanges have made their short volume data freely available, NASDAQ andNYSE charge exorbitant fees. CBOE data can be found at the following URLs. These links include boththe broader daily files as well as the detailed transaction files.https://markets.cboe.com/us/equities/market statistics/short sale/?mkt bzxhttps://markets.cboe.com/us/equities/market statistics/short sale/?mkt byxhttps://markets.cboe.com/us/equities/market statistics/short sale/?mkt edgahttps://markets.cboe.com/us/equities/market statistics/short sale/?mkt edgxOf interest to would-be data-wranglers is that lit exchanges will tend to have fewer large institutionalcross trades and thus higher short volume. Taken together, they will add up to around the SEC'saforementioned 49% figure.For clarification regarding any of this data, reach out to our research team at March 20187
Short is LongReferencesBartlett, Robert P. and McCrary, Justin, Dark Trading at the Midpoint: Pricing Rules, Order Flow andHigh Frequency Liquidity Provision (June 10, 2015).https://eml.berkeley.edu/ jmccrary/Bartlett McCrary June2015.pdfCardella, Laura and Hao, Jia and Kalcheva, Ivalina, Liquidity-based Trading Fees and Exchange Volume(August 1, 2017). https://ssrn.com/abstract 2149302 or http://dx.doi.org/10.2139/ssrn.2149302SEC, Key Points About Regulation SHO (April 18, SEC DERA, Short Sale Position and Transaction Reporting (June 15, n-and-transaction-reporting%2C0.pdfYe, Linlin, Understanding the Impacts of Dark Pools on Price Discovery (October 1, 2016).https://ssrn.com/abstract 2874957 SqueezeMetricsAll rights reserved.http://sqzme.coresearch@sqzme.coMarch 20188
that a stock will go down. But according to the SEC, trades marked with the seller "short" comprise about 49% of equity share volume.* In other words, about half of all selling volume in the market is short selling. Unless we actually believe that half of market volume is speculative short selling, this demands an explanation.