Transcription
The state of incidentmanagement report2021
Table of contents3Executive summary5Survey methodology and demographics6Who took the survey?9Chapter 01: Perception vs. reality10The maturity of the incident management process11Chapter 02: Frameworks and tooling12Frameworks13Use of tools during incidents17Who manages incidents?18Who goes on call?19Incident prevention21Source of truth during incidents22Measuring success after the incident23Chapter 03: Areas for improvement24Main pain points25Barriers to change25What influences change?26Chapter 04: Increased focus on automation27Automation30Chapter 05: What’s next?31Tools used, versus tools planned32What’s next for incident management?36In conclusion
Executive summaryWe conducted Atlassian’s first incident management benchmark report in 2020,at the start of the COVID-19 global pandemic. As a result of stay at home ordersand health concerns, the world changed quickly and so did consumer habits.With many people spending more time at home than ever before, industries likestreaming, food and grocery delivery, and at-home fitness solutions experiencedmassive growth. This year’s report saw the aftermath of extended socialdistancing and quarantining.Companies like Delivery Hero and UberEats reported 96% and 152% year-overyear growth respectively. Peloton, known for their online courses and spinningbikes saw a 94% jump in subscriptions. In-person visits were replaced with videoand phone chats so folks could stay in touch with loved ones. As such Zoom, avideo conferencing solution, saw over 300 million daily meeting participants inApril 2020, compared to 10 million in December 2019.The increase in demand for digital, always-on services meant that companieshad to scale, fast. Even companies not traditionally thought of as softwarecompanies, were building up their online apps and expanding capacity to keepup. This increased demand on digital, always-on services and had a downstreamimpact on incident management.This year’s report showed that in 2021, companies are more willing to spend onincident management so they can ensure a positive service experience for theircustomers. We surfaced many other findings to help you benchmark against yourown processes. Here’s what you can expect: A general observation of incidentmanagement processes and practices Focus on collaboration andcommunication preferences Discussion around process automation Future plans and MENTMANAGEMENTREPORTREPORT20212021THE3
Downtime costs more than just dollars, it can also cost you quality employeesand damage your reputation. Leverage these findings to make sure you’re stayingahead of the curve, and investing in future growth. Incident Management is anever-evolving practice, we can expect incidents to happen, but the key is in arapid, organized response.THE STATE OF INCIDENT MANAGEMENT REPORT 20214
Survey methodologyand demographicsTHE STATE OF INCIDENT MANAGEMENT REPORT 20215
Who took the survey?Atlassian’s 2021 State of Incident Management research study surveyed over500 software developers and IT professionals across the US about IT ServiceManagement (ITSM), with a focus on the practice of Incident Management. Thesurvey was fielded by CITE Research, on behalf of Atlassian and required thatrespondents were:·····Employed full timeIn either a software development or IT roleWorking at an organization that practices DevOpsAt manager level or aboveWorking at a company of 101 employees or Only 20% of respondents were women which highlights the gender disparityamongst IT and Dev professionals. We did see a slightly larger disparity last year.While there was a 4% increase in female respondents which is encouraging, it’stoo small of an increase to make any assumptions. It will be interesting to see ifthis trend continues next year.THE STATE OF INCIDENT MANAGEMENT REPORT 20216
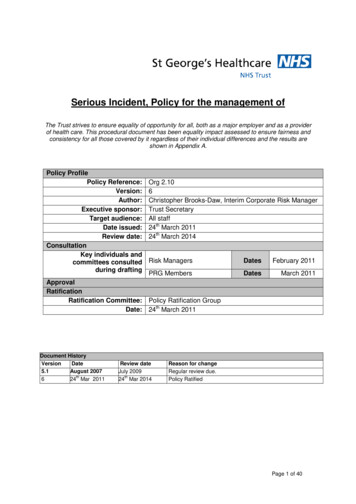
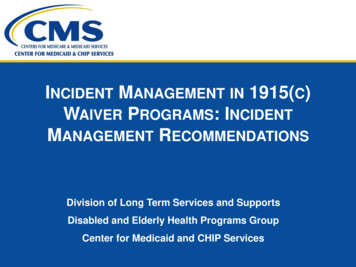
Age10%Over 61% of respondentswere between 35-44years of age. Twenty-fourpercent were 25-34, andonly 10% were between45-54 years of age.24%61%BETWEEN 45-54BETWEEN 25-34BETWEEN 35-44Company SizeThe majority ofrespondents workedat small to mediumsized companies, with15% working at 1-4,9995,000-10,000THE STATE OF INCIDENT MANAGEMENT REPORT 20217
Title and departmentUnlike last year’s survey, thisyear’s respondents were a50/50 split betweenDev and IT, compared to lastyear’s 78% / 22% split.50%DEV50%ITIT OPSMANAGERSENIOR SOFTWAREDEVELOPEROTHER7%17%31%15%30%DIRECTOR OF ITIT MANAGERTHE STATE OF INCIDENT MANAGEMENT REPORT 20218
01Perception vs. realityTHE STATE OF INCIDENT MANAGEMENT REPORT 20219
The maturity of the incidentmanagement processTo define an organization as proactive, we concluded that the use ofmonitoring, alerting, and communication tools were required, as well asincident response training and automation in at least one aspect of theirincident management process.50%overwere listed asproactive80%35%qualified as proactiveby our standardsTHIS YEARTHE STATE OF INCIDENT MANAGEMENT REPORT 2021LAST YEAR10
02Tools and processesTHE STATE OF INCIDENT MANAGEMENT REPORT 202111
FrameworksWhile only respondents who were practicing some form of DevOps movedforward in the survey, we wanted to know which additional frameworks wereinfluential. DevOps took the lead, followed by Agile and ITIL 4. This is especiallytelling since this year’s survey had a 50/50 split between folks who worked inSoftware Development and IT, versus last year’s survey where 78% of peoplesurveyed worked in IT.INFLUENCE OF FRAMEWORKSHIGHLY INFLUENCEDSOMEWHAT L 4LEANINFLUENCE OF FRAMEWORKSHIGHLY INFLUENCEDSOMEWHAT INFLUENCEDNOT VERY INFLUENCEDNOT AT ALL INFLUENCEDLEAN38%48%ITIL 4AGILE21%76%DEVOPS45%36%THE STATE OF INCIDENT MANAGEMENT REPORT 20212%9%9%45%47%4%13%4%12
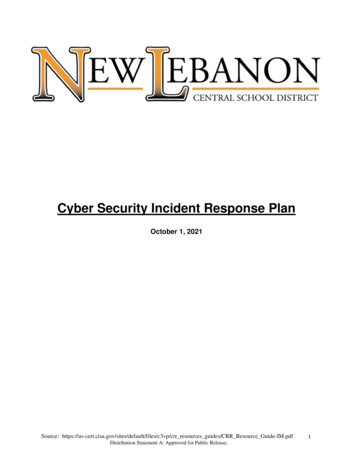
Use of tools during incidentsIncident DiscoveryIncident responders are notified through various ways — with two-thirds gettingemail or automated phone calls or texts. More than half receive a notificationvia ChatOps tool and/or mobile app. As expected, phone trees and NetworkOperations Centers are much less common. Practitioners are especially likely toreport using email (72%) and less likely to report automated call/text (58%) ascompared to decision makers.Those that use 5 tools end-to-end are more likely to use all notificationmethods tested. To understand the full impact of the incident, responders rely onevent history the most, followed by recent code deployments/enhancements.NOTIFICATIONS OF INCIDENT RESPONDERS68%63%59%53%38%EmailAutomated phone call or text messageChatOps tool notification (Slack, MS Teams)Mobile app push notificationsPhone tree (NOC)INFORMATION ACCESSED TO DETERMINEFULL IMPACT OF INCIDENTIncident/Alert/Event historyRecent code deployments/ enhancementsRecent infrastructure changesLive service health infoCMDB or other asset repositoryTHE STATE OF INCIDENT MANAGEMENT REPORT 202171%63%59%53%38%13
Use of tooling during the incidentThe COVID-19 Pandemic has shifted consumer behavior. Incident managementwas not untouched by this trend. Video conferencing is now the most used toolthroughout the incident management process, followed closely by monitoring,CI/CD tools, and chat.20202021VIDEO CONFERENCING75%79%MONITORING69%56%CONTINUOUS INTEGRATION/CONTINUOUS DELIVERY69%49%CHAT63%49%DOCUMENTATION/ WIKI58%55%ALERTINGOTHER48%1%0%Other notable findings include the significant increase in usage of ContinuousIntegration, Continuous Delivery (CI/CD), chat and documentation tools since2020. Adding CI/CD tooling to the incident management process could indicatethat as companies’ processes mature, they’re seeking ways to be more proactiveand shorten incident resolution time. These findings also speak to the need foran integrated tool chain for seamless incident response, reporting, andfollow-up. But this could be the result of having a larger Dev audienceresponding to the survey this year, as compared to last year.THE STATE OF INCIDENT MANAGEMENT REPORT 202114
On average, organizations use 3.8 tools throughout the end-to-end incidentmanagement process. Decision-makers (4.0) report higher tool usage thanpractitioners (3.6). This is down from 2020’s findings of 5.2 tools tocommunicate internally, 4.2 to communicate externally, and 4.3 to collaboratewith their team during an incident. Since various data points indicate amore mature incident process, it’s likely the reduction in tooling is a result ofstreamlining and consolidating.Communication and collaborationEmail is still the most used tool for communication and collaboration butusage decreased by 11-16% over last year. According to the answers respondentsgave, software developers may be shifting to chat, using it most for teamcollaboration (54%) — and nearly as much as email for internal communication(56%). This highlights the demand for ITSM tooling with deep ChatOpsintegrations.Another finding that stands out, despite the fact that incident managementtooling has increased, usage of nearly all communication tools has gone downsince 2020. This could be an indication of communication/screen fatigue as aresult of the pandemic, or point to the fact that most respondents are usingmore integrated tooling with clear audit trails and actionable information,putting less burden on the need for communication.THE STATE OF INCIDENT MANAGEMENT REPORT 202115
l56%34%Ticketingsystem56%Website32% 34%StatuspageCOMMUNICATEEXTERNALLYCOLLABORATEWITH TEAM202158%55%54%43%Email37% tmanagement50%51%45%45% 47%ChattoolVideoconferencing50% 47%38%WebsiteCOMMUNICATEINTERNALLYTHE STATE OF INCIDENT MANAGEMENT REPORT 202145% 42%41%HelpDesk47%32% 3%37%MobileappCOLLABORATEWITH TEAM16
Who manages incidents?Last year’s survey found that IT Operations were the most heavily involvedin Incident Management, this is still true. But involvement has increasednotably across the board — with more involvement from Marketing, Legal, andExecutives. This cross-functional involvement could mean there is more focus ontransparency and communication with all stakeholders.Also similar to 2020, IT professionals are more likely to report IT operationsinvolvement (92% vs. 85% of software developers), while SoftwareDevelopers are more likely to report Engineering involvement(54% vs. 38% of IT professionals).2020202193%38%26%89%46%34%IT OPERATIONSENGINEERINGSITE RELIABILITY18%13%31%2%29%16%44%0%LEGALMARKETINGTHE STATE OF INCIDENT MANAGEMENT REPORT 2021EXECUTIVES(C-SUITE)OTHER17
Who goes on call?This year IT is still on-call the most with 87% of survey respondents reportingthat IT goes on-call. At the same time, 63% of respondents reported thatDevelopers were on call too. Only 1% of those surveyed do nothave an on-call procedure, and the majority have automated the scheduleprocess through a tool, like Opsgenie. Eighteen percent of respondents are stillusing manual processes like spreadsheets. Last year, only 93% of respondentshad an on-call process, versus 99% this year.WHO GOES ON CALL87%63%44%1%IT OPERATIONS/SERVICE DESKDEVELOPERSPRODUCT MANAGERSHOW ON-CALL SCHEDULESARE CREATED64%18%17%AUTOMATEDPROCESS THROUGH ATOOL (LIKE OPSGENIE)SPREADSHEETHR TOOLING/SCHEDULINGDON’T HAVE ON-CALLTHE STATE OF INCIDENT MANAGEMENT REPORT 202118
Incident preventionThe majority of organizations (87%) provide incident management training.Slightly less reported conducting war games than last year. This year we alsoasked about Chaos Engineering, which 75% of respondents participate in. Themore tools an organization uses for the end-to-end incident process the morelikely they were to engage in war games, chaos engineering, and incidentmanagement training.2020202188%87%75%55%53%CONDUCT WARGAMESPROVIDE INCIDENTMANAGEMENT TRAININGPRACTICE CHAOSENGINEERINGProactive incident management tools are the norm, with more than 50% usingall techniques tested. Capacity monitoring and user transaction monitoring arethe most common. Organizations that use AI to trigger incidents are statisticallymuch more likely to report usage of all proactive techniques tested (with theexception of user transaction monitoring, where the difference is directional).Those who use 5 tools end-to-end are also significantly more likely to use alltools tested. This could indicate that AI is utilized by more mature companies, orthat AI empowers these organizations to be more proactive.THE STATE OF INCIDENT MANAGEMENT REPORT 202119
USE OF PROACTIVE INCIDENTTECHNIQUES/TOOLS71%67%57%52%50%Capacity monitoringUser transaction monitoringSynthetic testingAI for incident trainingChange induced trends/correlationSimilarly to 2020, monitoring tools are used by the majority to discover incidents.Internal discovery has decreased, but this is likely due to a wording change in thequestionnaire. In 2020, we referred to “internal/employee discovery” as opposedto internal discovery in 2021.2021202083%86%MONITORING TOOLSCUSTOMER EMAIL72%61%HELP DESK70%69%INTERNAL1%71%DISCOVERYOTHER0%1%THE STATE OF INCIDENT MANAGEMENT REPORT 202120
Source of truth during incidentsA two-thirds majority say that ticket or issue tracking tools are the source oftruth during incidents. Those who use AI to trigger incidents are especially likelyto say the tracking tool is the source of truth (64%) compared to those who don’tuse AI (50%).In 2020, 88% were using an issue tracking tool like Jira or Jira ServiceManagement as a source of truth with 65% using a chat or collaboration tool.In 2021, 62% leveraged an issue tracking tool as their source of truth, while 38%used a chat or collaboration tool like Slack or Microsoft Teams. We can’t say forsure what caused the shift, but it seems that more and more ChatOps tools arebeing leveraged for issue tracking.SOURCE OF TRUTH DURING INCIDENTS38%Ticket or issuetracking tool (i.e.Jira, Jira ServiceDesk, etc.)Chat orcollaborationtool (i.e. Slack,MicrosoftTeams, etc.)62%THE STATE OF INCIDENT MANAGEMENT REPORT 202121
Measuring success after the incidentSimilar to last year’s findings most run postmortems on incidents. Thosewho use AI are especially likely to do so (89%). This could speak to theoverall maturity of their processes, or indicate that leveraging AI mayautomate this process for them.2020202185%78%19%YES11%3%NO4%UNSUREThe top measure of success is still mean time to resolve. There is a noticeabledecrease in folks paying attention to mean time to respond compared tolast year. We asked respondents to provide an estimate for how much eachincident costs their organization, the average cost per incident based on theiranswers comes to 14,985. A study by Gartner found the average cost ofdowntime to be 5,600 per minute, but cost can vary depending on the sizeand vertical of a company.202079%202177%66%53%57%46%1%MTTR(MEAN TIME TO RESOLVE)MTTA(MEAN TIME TOACKNOWLEDGE)THE STATE OF INCIDENT MANAGEMENT REPORT 2021MTTR(MEAN TIME TO RESPOND)0%OTHER22
03Areas for improvementTHE STATE OF INCIDENT MANAGEMENT REPORT 202123
Main pain points16%20%EXTREMELY EASY38%41%SOMEWHAT EASY28%34%SOMEWHAT DIFFICULT12%11%EXTREMELY DIFFICULT2020When asked if it was difficult toget stakeholders involved 61%said it was easy and 39% said itwas difficult. Respondents whoreported using 5 tools end-to-end,said they were responsible for bothdevelopment and operations.2021The biggest issue in the incident management process is a lack of full visibilityacross IT infrastructure. As can be expected, those with fewer end-to-end tools(0-4) are more likely to cite this as a problem (28%).BIGGEST PAIN POINT IN INCIDENT MANAGEMENTLack of full visibility across IT infrastructureLack of coordination across departmentsLack of integration with a chat tool(Slack, Microsoft Teams)Lack of context during an incidentIll-defined processesLack of change management/change recordsLack of plans to address incidentsLack of automated responsesOther (please specify)THE STATE OF INCIDENT MANAGEMENT REPORT 202124%11%11%11%11%11%10%9%1%24
Barriers to changeWe wanted to get an idea of what respondents felt prevented change, or werebarriers to improving the process. Respondents cited change risk, managementresistance, and cost as the most prominent — with c-level resistance being lessof a concern.BARRIERS TO IM IMPROVEMENT OR CHANGES29%28%Resistance at themanagement levelRisk of changing26%17%1%CostResistance atthe C levelOtherWhat influences change?Overall the main driver to adapting a quality incident management process isproviding a positive customer experience, followed by protecting the companyreputation with loss of profit being the lowest factor. Software Developersplace slightly more importance on preventing loss of customers/profits than ITprofessionals (23% say this is a driver, compared to only 15% of IT professionals).TOP DRIVERS OF INCIDENT MANAGEMENT32%Providing a positivecustomer experience21%Protecting thecompany reputationTHE STATE OF INCIDENT MANAGEMENT REPORT 202119%Preventing loss ofcustomers/profits25
TOP BARRIERS TO INCIDENT MANAGEMENT IMPROVEMENT OR CHANGES29%Risk of changing28%26%Resistance at themanagement levelCostDRIVERS OF INCIDENT MANAGEMENT32%21%Providing a positivecustomer experienceProtecting thecompany reputation19%14%14%Preventing loss ofcustomers/profitsCompliance andauditingCompany culture& philosophyTHE STATE OF INCIDENT MANAGEMENT REPORT 202126
04Increased focus on automationTHE STATE OF INCIDENT MANAGEMENT REPORT 202127
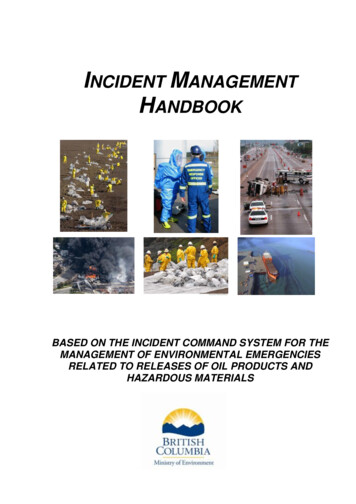
AutomationIt’s no surprise that automation continues to be a big focus, especially forinternal communication and incident creation. More than half have automatedtemplates for external communication as well. Decision-makers are more likelythan practitioners to report automation of templates for internal communication(71%) and external communication (58%). Those who report using 5 toolsend-to-end are more likely to have automated. It’s no surprise that those whoautomate incident creation with templates (68%) also report that it’s easier toget stakeholders involved.66%Templates for internal communication63%Templates for automated incident creation54%Templates for external communication43%Public-facing status pageTHE STATE OF INCIDENT MANAGEMENT REPORT 202128
The automation of ticket creation has decreased significantly, from 66% in2020, to 52% in 2021. One possibility for this decrease, is that oftentimes whenautomating ticket creation, it’s not implemented or filtered properly which leadsto a lot of noise. Organizations that use 5 tools are more likely to automateall communications and processes tested. Those who report easy stakeholdercommunication are more likely to report automated communication with internalemployees (85%) and automated processes for on-call notifications (62%),incident communications (68%), and chat channel creation (62%).AUTOMATED INCIDENT EESEXTERNALCUSTOMERS6%NONE OFTHE ABOVEAUTOMATED INCIDENT MANAGEMENT PROCESSES2021202067%63%INCIDENT COMMUNICATION(I.E. STATUSPAGE,EMAIL,ETC.)CHAT CHANNEL CREATION(I.E. SLACK, MICROSOFT TEAMS)53%59%ON-CALL NOTIFICATIONSFROM MONITORING TOOLS58%57%TICKET CREATION(I.E. JIRA, JIRA SERVICE DESK, ETC.)52%CHANGE RECORD CREATIONFOR STANDARD CHANGES46%33%28%POSTMORTEM CREATIONNONE OF THE ABOVETHE STATE OF INCIDENT MANAGEMENT REPORT 202166%3%1%29
The vast majority of respondents reported leveraging a tool that uses AIto trigger incidents. 85% report using on incidentmanagement tool leverages AIto trigger incidents.15%Of those who do not use a tool,lack of organizational buy-in,budgetary constraints, and lackof expertise are the top barriers.36%34%No85%Yes34%28%24%1%LACK OFORGANIZATIONALBUY-INDISTRUSTOF AIBUDGETARYCONSTRAINTSTHE STATE OF INCIDENT MANAGEMENT REPORT 2021LACK OFEXPERTISECONTENT WITHTRADITIONALSOLUTIONSOTHER30
05What’s next?THE STATE OF INCIDENT MANAGEMENT REPORT 202131
Tools used, versus tools plannedTwo-thirds or more of organizations report using the following toolscurrently: alerting, incident management, monitoring, project management,communications, and chat. Of those who do not use tools currently, most planto within the next 12 months.NO PLANS TO USE INNEXT 12 MONTHSPLAN TO USE INNEXT 12 MONTHS72%CURRENTLY erting6%Continuous integration /Continuous deliveryTHE STATE OF INCIDENT MANAGEMENT REPORT 202136%9%CMDB /Asset management32
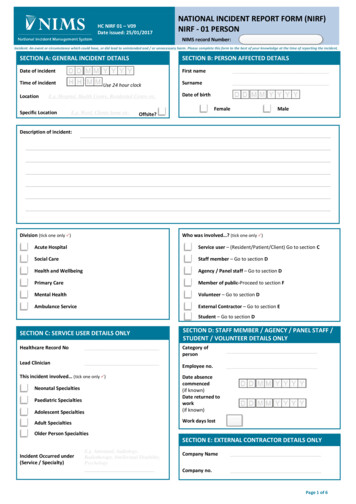
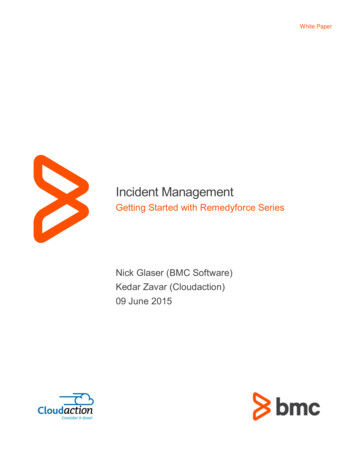
What’s next for incident management?Looking ahead organization are prioritizing increasing automation (54%), andimproving documentation and processes (52%). Both of these tactics can cutdown on incident resolution time, which supports the finding that mean time toresolve is currently the most used metric for success. Organizations using 5 end-to-end tools are more likely to invest in all areas the survey asked about. It’sno surprise that organizations with higher revenues of 100.1M are especiallylikely to purchase new tools (49%), as they have the resources to do so.STRATEGIES ORGANIZATIONS WILL INVESTIN WITHIN THE NEXT YEARIncreasing automation54%Improving documentation and processes52%Purchasing new tools to addressincident managementHolding training sessions for employeesIncreasing the number of employeesworking on incident managementIncreasing the context for each incidentReorganizing departmentreporting structuresPaid incentives for reduced incidentfrequency and durationMy organization has no plans toinvest in the incident managementprocess in the next 12 monthsUnsureTHE STATE OF INCIDENT MANAGEMENT REPORT 202144%44%44%44%40%38%2%0%33
INCIDENT MANAGEMENT PROCESS AUTOMATION12 MONTHS FROM NOWLess than 1-70%Between11-40%* This chart shows what percentage of processes respondents plan to automate.THE STATE OF INCIDENT MANAGEMENT REPORT 202134
Organizations will focus on automationof incident management in the future,but few expect to reach over70% automation.Increasingautomatıon54%Improving documentationand processes52%Purchasing new tools toaddressincident management44%Holding training sessionsfor employees44%Increasing the number ofemployees working onincident management44%Increasing the contextfor each incident44%Reorganizing departmentreporting structures40%Paid incentives for reducedincident frequencyand duration38%My organization has noplans to invest in the incidentmanagement processin the next 12 months2%Unsure0%THE STATE OF INCIDENT MANAGEMENT REPORT 202135
While increasing automation in the incident management process emerges asthe top strategic plan for the next year, only 5% expect a fully automated processwithin the next 12 months. Most expect between 11-40% (29%) or 41-70% (46%)automation in the next year.Six-in-ten prefer best-in-class point products over unified toolchain to handleincidents. Those who are responsible for both developing and operations areespecially likely to prefer best-in-class (66%). This means that they are morelikely to choose different products that integrate well together, rather thanchoosing a single product that does it all.BEST-IN-CLASSPOINT PRODUCTSUNIFIEDTOOLCHAINTHE STATE OF INCIDENT MANAGEMENT REPORT 2021UNSURE36
In conclusionNow, with two years of incident management benchmarking data to reflect onit’s safe to say that there’s a large focus on maturing the incident managementprocess, mostly driven by providing a good customer experience. Whiledemand placed on infrastructure and online exploded due to folks spendingmore time than ever at home, it also increased the need and rapidity for whichorganizations needed to digitally transform and scale.Key trends to look out for in 2021 are changes in collaboration methods andan even larger emphasis on automation. While this year’s more even splitbetween IT folks and Dev folks as respondents certainly contributed to some ofthe changes we saw reported, like the decrease in use of monitoring tools, andticketing as a source of truth, most of our key findings were not a surprise. Aswe emerge from this pandemic and folks slowly have the option to return to theoffice, it will be interesting to see what impact that has on our communicationand consumer habits.THE STATESTATE OFOF INCIDENTINCIDENT MANAGEMENTMANAGEMENT REPORTREPORT 20212021THE37
Want to dig deeper ?www.atlassian.com/incident-managementHave questions?Contact us at sales@atlassian.com 2021 Atlassian. All Rights Reserved. ITMKT-956 DRD-05/21
Atlassian's 2021 State of Incident Management research study surveyed over 500 software developers and IT professionals across the US about IT Service Management (ITSM), with a focus on the practice of Incident Management. The survey was fielded by CITE Research, on behalf of Atlassian and required that respondents were: · Employed full time