Transcription
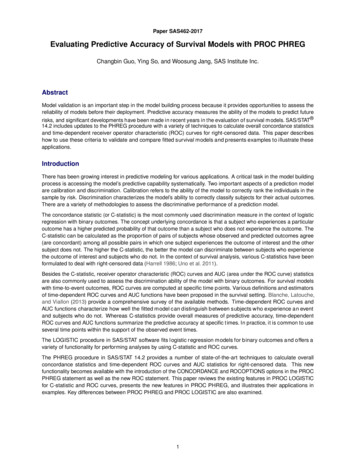
Paper SAS462-2017Evaluating Predictive Accuracy of Survival Models with PROC PHREGChangbin Guo, Ying So, and Woosung Jang, SAS Institute Inc.AbstractModel validation is an important step in the model building process because it provides opportunities to assess thereliability of models before their deployment. Predictive accuracy measures the ability of the models to predict futurerisks, and significant developments have been made in recent years in the evaluation of survival m odels. SAS/STAT 14.2 includes updates to the PHREG procedure with a variety of techniques to calculate overall concordance statisticsand time-dependent receiver operator characteristic (ROC) curves for right-censored data. This paper describeshow to use these criteria to validate and compare fitted survival models and presents examples to illustrate theseapplications.IntroductionThere has been growing interest in predictive modeling for various applications. A critical task in the model buildingprocess is accessing the model’s predictive capability systematically. Two important aspects of a prediction modelare calibration and discrimination. Calibration refers to the ability of the model to correctly rank the individuals in thesample by risk. Discrimination characterizes the model’s ability to correctly classify subjects for their actual outcomes.There are a variety of methodologies to assess the discriminative performance of a prediction model.The concordance statistic (or C-statistic) is the most commonly used discrimination measure in the context of logisticregression with binary outcomes. The concept underlying concordance is that a subject who experiences a particularoutcome has a higher predicted probability of that outcome than a subject who does not experience the outcome. TheC-statistic can be calculated as the proportion of pairs of subjects whose observed and predicted outcomes agree(are concordant) among all possible pairs in which one subject experiences the outcome of interest and the othersubject does not. The higher the C-statistic, the better the model can discriminate between subjects who experiencethe outcome of interest and subjects who do not. In the context of survival analysis, various C-statistics have beenformulated to deal with right-censored data (Harrell 1986; Uno et al. 2011).Besides the C-statistic, receiver operator characteristic (ROC) curves and AUC (area under the ROC curve) statisticsare also commonly used to assess the discrimination ability of the model with binary outcomes. For survival modelswith time-to-event outcomes, ROC curves are computed at specific time p oints. Various definitions and estimatorsof time-dependent ROC curves and AUC functions have been proposed in the survival setting. Blanche, Latouche,and Viallon (2013) provide a comprehensive survey of the available methods. Time-dependent ROC curves andAUC functions characterize how well the fitted model can distinguish between subjects who experience an eventand subjects who do not. Whereas C-statistics provide overall measures of predictive accuracy, time-dependentROC curves and AUC functions summarize the predictive accuracy at specific t imes. In practice, it is common to useseveral time points within the support of the observed event times.The LOGISTIC procedure in SAS/STAT software fits logistic regression models for binary outcomes and offers avariety of functionality for performing analyses by using C-statistic and ROC curves.The PHREG procedure in SAS/STAT 14.2 provides a number of state-of-the-art techniques to calculate overallconcordance statistics and time-dependent ROC curves and AUC statistics for right-censored data. This newfunctionality becomes available with the introduction of the CONCORDANCE and ROCOPTIONS options in the PROCPHREG statement as well as the new ROC statement. This paper reviews the existing features in PROC LOGISTICfor C-statistic and ROC curves, presents the new features in PROC PHREG, and illustrates their applications inexamples. Key differences between PROC PHREG and PROC LOGISTIC are also examined.1
ROC Analysis in PROC LOGISTIC: A ReviewAssume that the binary response, E, of an individual or an experimental unit can take one of two possible values,denoted for convenience by 0 and 1. Suppose Z is a vector of explanatory variables and D Pr.E D 1 j Z/ is theresponse probability to be modeled. The logistic model has the form D C ˇ0Z1 where is the intercept parameter and ˇ D .ˇ1 ; : : : ; ˇs /0 is the vector of s slope parameters.logit. / logThe LOGISTIC procedure fits the model by the method of maximum likelihood.Receiver Operating Characteristic (ROC) CurvesReceiver operating characteristic (ROC) curves display the discrimination potential of fitted logistic models byevaluating the trade-offs between true positive rate (sensitivity) and false positive rate (1 – specificity). If you havea cutoff value, you can classify the subjects as being positive or negative according to their predicted probabilities.Hence a 2 2 classification table can be constructed to show the relationship between the predicted outcomes andthe actual outcomes. Sensitivity is the fraction of positive subjects who are predicted as positive, and specificity is thefraction of negative subjects who are correctly predicted as negative.The ROC curve plots the sensitivity against one minus the specificity for a series of cutoffs for the fitted probability.The ROC plot is a unit square plot, and the higher the curve rises above the 45-degree line, the more desirable it is.The 45-degree line corresponds to an area under the curve (AUC) of 0.5 and represents where the fractions of truepositives and false negatives are equal. PROC LOGISTIC implements a nonparametric test to compare correlatedROC curves that was proposed by DeLong, DeLong, and Clarke-Pearson (1988). You can construct linear contraststo perform comparisons by using the empirical ROC curves of specified models.The ROC methodology has become a standard tool for assessing predictive accuracy because it provides a comprehensive evaluation of a fitted model. In practice, it is sometimes more convenient to use the so-called area underthe ROC curve (AUC), which summarizes the entire curve. AUC is connected to a variety of well-known statisticalmeasures; the concordance statistic (C-statistic) is the most obvious one, because the two measures are equivalent.As an estimator of the probability of concordance, the C-statistic estimates the concordant probability in a randomlyselected pair of subjects. Concordance is the phenomenon that if one subject of the pair experiences the positiveoutcome and the other does not, the subject with the positive outcome also has a higher predicted probability of thepositive outcome than the subject with the negative outcome. This provides the AUC with a convenient interpretationin terms of concordance probability.Example: Using PROC LOGISTIC for ROC AnalysisThis example illustrates the features of the C-statistic and ROC curves in PROC LOGISTIC.The data set Liver consists of data about 418 patients who have primary biliary cirrhosis (PBC), an autoimmunedisease of the liver. Each observation represents a patient. The variable Time represents the follow-up time in years(the time from registration to liver transplantation, death, or study termination, whichever comes first); the variableStatus is the censoring indicator (1 for death, 0 for censored); and the explanatory variables are Age (age, in years),Albumin (serum albumin level, in g/dl), Bilirubin (serum bilirubin level, in mg/dl), Edema (presence of edema, orswelling), and Protime (prothrombin time, in seconds).data Liver;input Time Status Age Albumin Bilirubin Edema Protime @@;label Time "Follow-Up Time in Years";Time Time / 365.25;Outcome (Time 5);datalines;400 1 58.7652 2.60 14.5 1.0 12.2 4500 0 56.4463 4.14 1.1 0.01012 1 70.0726 3.48 1.4 0.5 12.0 1925 1 54.7406 2.54 1.8 0.51504 0 38.1054 3.53 3.4 0.0 10.9 2503 1 66.2587 3.98 0.8 0.01832 0 55.5346 4.09 1.0 0.0 9.7 2466 1 53.0568 4.00 0.3 0.02400 1 42.5079 3.08 3.2 0.0 11.051 1 70.5599 2.74 12.6 1.03762 1 53.7139 4.16 1.4 0.0 12.0 304 1 59.1376 3.52 3.6 0.03577 0 45.6893 3.85 0.7 0.0 10.6 1217 1 56.2218 2.27 0.8 1.0210.610.311.011.011.513.611.0
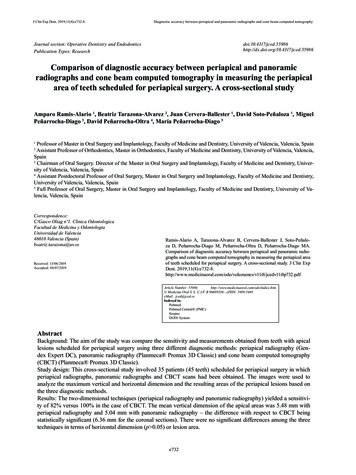
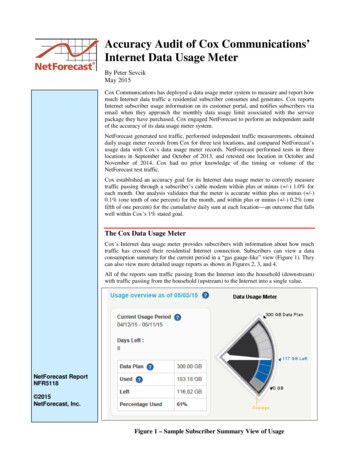
. more lines .989 0 35.0000 3.231103 0 39.0000 3.83691 0 58.0000 3.75;0.7 0.0 10.8 681 1 67.0000 2.960.9 0.0 11.2 1055 0 57.0000 3.420.8 0.0 10.4 976 0 53.0000 3.291.2 0.0 10.91.6 0.0 9.90.7 0.0 10.6The response variable, Outcome, is defined according to whether the subject is still at risk at year 5. The followingstatements use the LOGISTIC procedure to fit the logistic regression model that uses Bilirubin, Age, and Edema asexplanatory variables:ods graphics on;proc logistic data Liver plots(only) roc;model Outcome Bilirubin Age Edema;run;Figure 1 displays the ROC curve that is produced by the PLOTS option.Figure 1 Receiver Operating Characteristic CurveThe AUC (area under the ROC curve) is estimated by the statistic c in the “Association of Predicted Probabilities andObserved Responses” table shown in Figure 2. In this example, the AUC is 0.7432.Figure 2 Association TableAssociation of Predicted Probabilities andObserved ResponsesPercent Concordant74.3 Somers' D 0.486Percent Discordant25.7 Gamma0.4860.0 Tau-a0.243Percent TiedPairs43537 c30.743
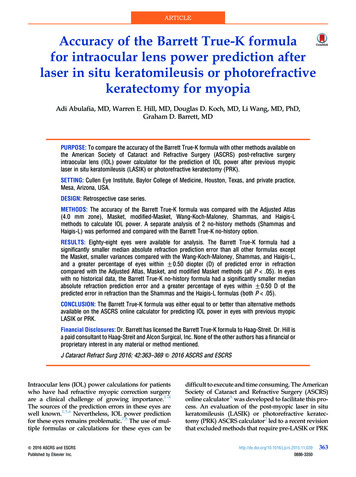
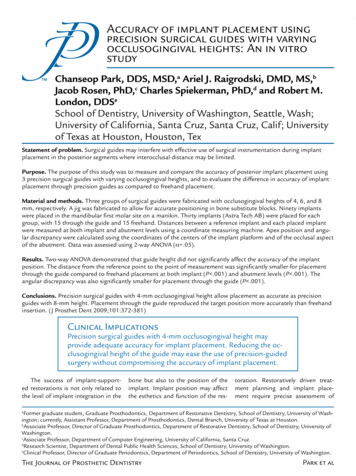
You can use PROC LOGISTIC to compare the ROC curves of different models. Consider three submodels of thepreviously fitted logistic model, each of which contains two of the three covariates Bilirubin, Age, and Edema. Youcan assess the difference in the ROC curves among these submodels in PROC LOGISTIC. In the following statements,three ROC statements are specified, one for each submodel:proc logistic data Liver plots roc;model Outcome Bilirubin Age Edema / nofit;roc 'Bilirubin Age' Bilirubin Age;roc 'Age Edema' Age Edema;roc 'Bilirubin Edema' Bilirubin Edema;roccontrast reference('Age Edema') / estimate e;run;The ROCCONTRAST statement implements the nonparametric test of DeLong, DeLong, and Clarke-Pearson (1988)to compare the three ROC curves, the REFERENCE option specifies that the Age Edema curve is used as thereference curve in the contrast, the E option displays the contrast coefficients, and the ESTIMATE option computesthe AUC and tests each comparison.Figure 3 displays the ROC curves of the three submodels and their AUC statistics.Figure 3 ROC Curves for the Three ModelsFigure 4 displays the area under the ROC curve along with its standard error and a confidence interval for each modelin the comparison. None of the three confidence intervals contain 0.50, indicating that the model-based prediction issignificantly different from random guessing, which is represented by the diagonal line in the ROC plots in Figure 3.Figure 4 ROC Association TableROC Association StatisticsMann-WhitneyROC ModelStandard95% WaldAreaError Confidence Limits Somers' D Gamma Tau-aBilirubin Age0.73810.02450.69000.78620.47620.4762 0.2379Age Edema0.59900.02760.54490.65320.19800.1983 0.0989Bilirubin Edema 0.74590.02380.69920.79260.49180.5026 0.24574
Figure 5 shows that the contrast used ’Age Edema’ as the reference level. This table is produced by specifying the Eoption in the ROCCONTRAST statement.Figure 5 ROC Contrast CoefficientsROC Contrast CoefficientsROC ModelRow1 Row2Bilirubin AgeAge EdemaBilirubin Edema10-1-101Figure 6 shows that the 2-degrees-of-freedom test that ’Age Edema’ is different from at least one other test issignificant at the 0.05 level.Figure 6 ROC Test Results (2 Degrees of Freedom)ROC Contrast Test ResultsContrastDF Chi-Square Pr ChiSqReference Age Edema222.7198 .0001Concordance Statistics for Survival ModelsIn SAS/STAT 14.2, PROC PHREG provides two versions of concordance statistics—Harrell’s C-statistic and Uno’sC-statistic—for dealing with right-censored data. These new statistics can be considered generalizations of theC-statistic for binary outcomes as implemented in PROC LOGISTIC. This section discusses how these new statisticsare formulated and how to request them in PROC PHREG. Their differences from the conventional C-statistic andsome computational issues concerning their usage are also discussed.Two DefinitionsThe conventional C-statistic is defined for binary outcomes and cannot be directly applied to time-to-event data. Bycontrast, Harrell’s and Uno’s versions of the C-statistic are defined specifically for right-censored data. A fundamentaldifference between Harrell’s method and Uno’s method is how survival times are ordered in the presence of censoring.Harrell’s method offers a straightforward approach by discarding the pairs that have become incomparable because ofcensoring. This approach, although it is simple, has the shortcoming that the estimates depend on the censoringvariable. Uno’s method (Uno et al. 2011) is a new formulation that models the censoring distribution and uses it toweight the uncensored observations in the estimation, making the estimates censoring-independent. For a detaileddescription of these methods, see the section “Estimating Concordance Statistics” in the Appendix.Syntax in PROC PHREGThe new CONCORDANCE option in the PROC PHREG statement is designed to perform analyses related to overallconcordance. The default method is Harrell’s C-statistic, which you can request by specifying the CONCORDANCE orCONCORDANCE HARRELL option in the PROC PHREG statement. To compute the standard error, you can specifythe CONCORDANCE HARRELL(SE) option.To request Uno’s C-statistic, specify the CONCORDANCE UNO option in the PROC PHREG statement. To computethe standard error, specify the CONCORDANCE UNO(SE) option. The standard error estimator is based on aperturbation-resampling method proposed by Uno et al. (2011). You can control the perturbation process by specifyingthe options in Table 1.Table 1 Options for PerturbationOption NameFunctionDefault ValueITER SEED DIFFSpecify number of perturbationsSpecify seed for random
ROC Analysis in PROC LOGISTIC: A Review Assume that the binary response, E, of an individual or an experimental unit can take one of two possible values, denoted for convenience by 0 and 1. Suppose Zis a vector of explanatory variables and ˇ DPr.E 1j /is the response probability to be modeled.