Transcription
HOW FIBONACCI CAN IMPROVE YOURACCURACY AND PROFITABILITY INDAY AND POSITION ion Copyright 2018 Fibonacci Trading Institute. All rights reserved.
CONTENTSIntroductionSection 1.0 - A Brief History Of FibonacciSection 2.0 - Fibonacci vs Technical Indicators2.1 – Fibonacci2.2 – Technical Indicators2.3 - Characteristics of Fibonacci & IndicatorsSection 3.0 - Fibonacci Price Retracement Ratios3.1 Fibonacci Price Retracement Example in a Rising Market3.2 Fibonacci Price Retracement Example in a Falling MarketSection 4.0 - Fibonacci Price Extension Ratios4.1 Fibonacci Price Extension Example in a Rising Market4.2 Fibonacci Price Extension Example in a Falling MarketSection 5.0 Fibonacci Trading Institute5.1 Fibonacci Trading Institute Proprietary Fibonacci Levels5.2 Fibonacci Trading Institute Proprietary Method5.3 Contact Fibonacci Trading ation Copyright 2018 Fibonacci Trading Institute. All rights reserved.
An IntroductionTrading within the financial markets can be undertaken in many different ways and today’s traderhas a whole host of different tools at their disposal. One of the more popular techniques that tradersuse is Fibonacci Retracements and Extensions.Fibonacci is the only Natural Predictive Mathematical Sequence (it does not require any math skills)that is used to analyse market structure and accurately identify key market areas of support andresistance. Knowing where key Fibonacci levels are will identify the best area for trade entry andshow with high accuracy profit targets on any instrument and any platform.Fibonacci Strategies can be applied to Futures, Forex, Stocks, ETF’s and essentially every liquidmarket instrument. They can also be traded on any timeframe, which makes them available to alltypes of traders. Whether you are a scalper, swing trader or position trader, Fibonacci Studies will beapplicable and effective.Fibonacci techniques are powerful and whilst not a standalone trading system in their own right,they can be a very effective component of a trading strategy. Fibonacci Strategies must be tradedwith a strict set of rules. This E-Book will explain how Fibonacci can be used in trading any marketson any time frame with a Fibonacci Retracement n Copyright 2018 Fibonacci Trading Institute. All rights reserved.
1.0 - A Brief History Of FibonacciFibonacci numbers were derived from an Italian mathematician Leonardo Pisano and documentedinitially in the 13th Century. Pisano was considered by some as the most talented Westernmathematician of the Middle Ages and made many of the original contributions within complexcalculations.It was whilst journeying with his father that Pisano began to develophis mathematical skills and solve problems relating to merchant tradeand price calculations. He started to observe that certain ratios of anumber series can describe the natural proportions of the Universeincluding price data.With this in mind Pisano devised a series of numbers that werederived by starting at 0 and 1 and then adding the two previousnumbers to create the next number in the series. This series reachesall the way out to infinity and the start of the sequence looks like thefollowing:0, 1, 1, 2, 3, 5, 8, 13, 21, 34, 55, 89, 144, 233, 377, 610, 987 . and so on to infinity.The ‘Golden Ratio’ is a term that is associated with Fibonacci and the ratio is determined by a specialrelationship found within the number series. After the commencement of the first few numbersthere is found to be a ratio multiplier of 1.618 between each number for example:55 x (1.618) 89,89 x (1.618) 144,144 x (1.618) 233 and so on.Further work has been done on the Fibonacci ratios to provide yet another sequence which is usedin today’s Fibonacci Analysis. Without going too deep into the square roots, reciprocals or othermathematical formulas of these numbers the list of values which are in use are:PRICE RETRACEMENT RATIOS0.236, 0.382, 0.500, 0.618, 0.764PRICE EXTENSION RATIOS0, 0.382, 0.618, 1.000, 1.382, 1.618To further understand what is meant by Price Retracement and Price Extension Ratios, some practicalexamples are provided in the following tion Copyright 2018 Fibonacci Trading Institute. All rights reserved.
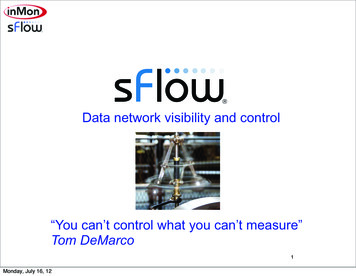
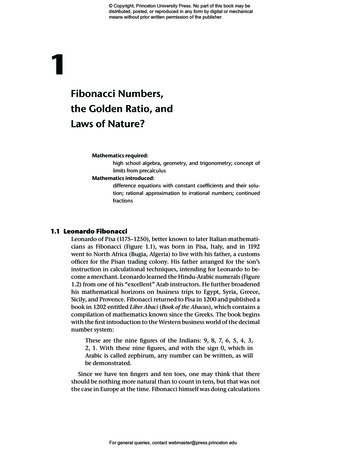
2.0 - Fibonacci vs Technical Indicators2.1 – FibonacciFibonacci is a powerful tool for determining price corrections and key levels of support andresistance. Based upon mathematical concepts of the Fibonacci Sequence, Fibonacci can determinethe extent of price movements and corrections within the markets. Fibonacci is naturally predictiveand the only tool, which can identify price levels far in advance of current prices. The accuracy ofFibonacci lends itself to finding key entries of support and resistance within the markets thusfacilitating trade entry and profit target prices.Technical Indicators do come with limitations in that they are often expensive, work only on certainplatforms and lag behind the markets. Fibonacci Tools on the other hand are common to the vastmajority of trading platforms, work on any instrument, any timeframe and are predictive in nature.It is worth noting however, that Fibonacci Tools do not provide a trading strategy in their own right.The levels of support and resistance must be traded in conjunction with a strict set of rules for acomplete trading strategy. The markets will eventually break support and resistance and it isessential that price action at the Fibonacci levels will support any decision to enter or exit the market.In the diagram on the right, price hasrisen in an uptrend respecting theFibonacci Extension levels predictedfrom the price structure of Wave 1.Price has also respected theFibonacci Retracement levels as themarket corrected itself and retracedthe length of prior swings by 50%and 61.8% respectively.The predictive nature of Fibonaccilends itself to identifying key turningpoints within the markets with ahigh degree of ation Copyright 2018 Fibonacci Trading Institute. All rights reserved.
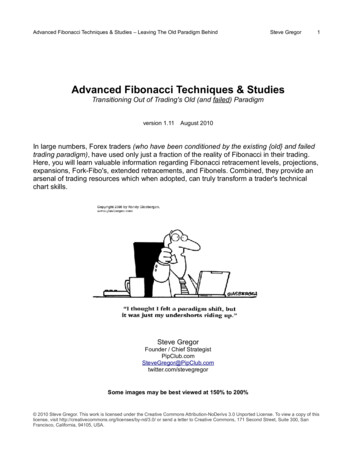
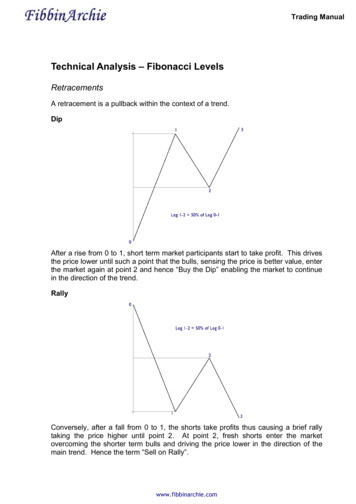
2.2 - Technical IndicatorsMany traders who utilize technical analysis rely heavily on trading indicators to help them maketrading decisions. The internet is awash with many types of indicators that are designed to help atrader enter or exit the markets based on some form of visual interpretation. Whether it be relativestrength, momentum oscillators, fractals or any other type of indicator they all have their owninherent problems.Generally speaking, many technicalindicators look at how the market behavedand apply a mathematical formula to anumber of prior periods to plot some formof visual representation that assists a traderin making a decision.The diagram on the right is plotting simplemarket pivot points. The mathematicalformula requires 6 candles before it can plotthe green pivot point and this is after themarket has already moved away from thepivot.2.3 - Characteristics of Fibonacci & IndicatorsFIBONACCI Naturally Predictive Mathematical Sequence Can be used on: Any Platform Any Instrument Any Timeframe INDICATORSDelayedArtificialCan only be used on: Specific Platforms Specific TimeframesCost can be entation Copyright 2018 Fibonacci Trading Institute. All rights reserved.
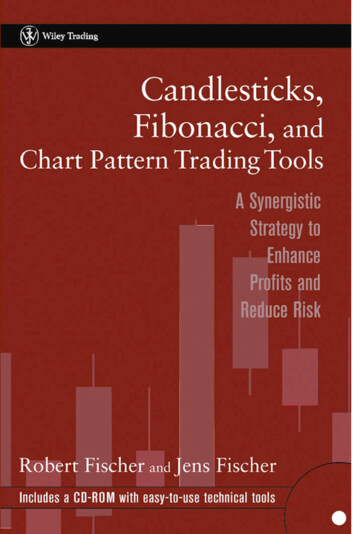
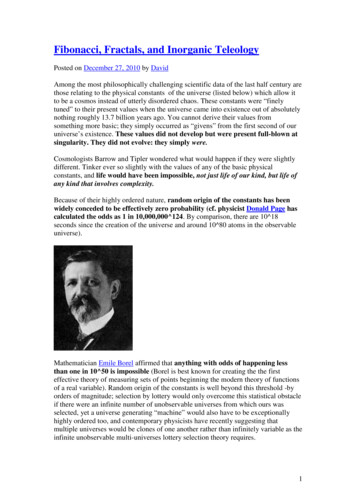
3.0 - Fibonacci Price Retracement RatiosFibonacci Price Retracement ratios when applied to a chart areused to determine where support and resistance areas may befound in relation to a prior price swing.The Fibonacci price retracements are placed from the high of aprice swing to the low of the swing and will plot a series of pricelevels which may act as potential support on any pullback fromthe swing high price.The table on the right shows the most common Fibonacci PriceRetracement ratios used in today’s Fibonacci Studies.3.1 Fibonacci Price Retracement Example in a Rising MarketThe chart on the right of the Dow JonesFutures Index shows an example of howFibonacci Price Retracements are plotted ona rising market.Price had been steadily declining on thechart until it made a swing low bottom at19750 (LOW). From there, price climbed inan uptrend creating a swing high at 19827(HIGH).Once the swing high completed theFibonacci Price Tool was applied by clickingon the HIGH price and then the LOW priceto create the Fibonacci Price Retracementlevels. As you can see in this example, priceretraced to the 50% Fibonacci level of theprior swing before rising again to retest ation Copyright 2018 Fibonacci Trading Institute. All rights reserved.
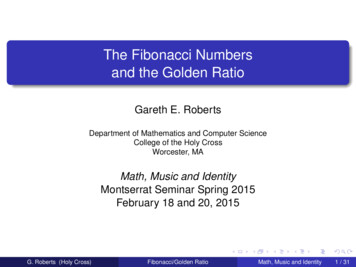
3.2 Fibonacci Retracement Example in a Bearish MarketThe chart on the right of the Dow JonesFutures Index shows an example of howFibonacci Price Retracements areplotted on a falling market.Price had been steadily rising on thechart until it made a swing high top at19994 (HIGH). From there price fell in adowntrend creating a swing low at19800 (LOW).Once the swing low completed theFibonacci Price Tool was applied byclicking on the LOW price and then theHIGH price to create the Fibonacci PriceRetracement levels.As you can see in this example, priceretraced to the 50% Fibonacci level ofthe prior swing before falling again andeventually finding support andresistance between the 23.6% and38.2% retracement ion Copyright 2018 Fibonacci Trading Institute. All rights reserved.
4.0 - Fibonacci Price Extension RatiosFibonacci Price Extensions are similar in nature to that of FibonacciPrice Retracements in that they are plotted from a prior swing lowto a prior swing high (or vice-versa). Fibonacci extensions dohowever, extend beyond the prior swing data points to projectlevels of support and resistance outside of the prior swing. Thebenefit of this provides potential market entry points from supportand resistance as well as market exit points on current positions.The table on the right shows the most common Fibonacci PriceExtension ratios used in today’s Fibonacci Studies.4.1 Fibonacci Price Extension in a Rising MarketThe chart on the right of the Dow Jones Futures Index shows an example of how Fibonacci PriceExtensions are plotted on a rising market.Price had declined creating a swinglow pivot at 19692 (LOW). The marketthen rose creating a swing high pivotat 19730 (HIGH). Fibonacci Extensionswere then plotted from the swing highto swing low data points creatingFibonacci price projections above thecurrent market.Price eventually rose swiftly where itstalled at the 161.8% extension line,broke through it and then retestedthat same level before finally movingup to the 261.8% extension where itreversed. The Fibonacci PriceExtension levels were plotted well inwww.FibonacciTradingInstitute.comDocumentation Copyright 2018 Fibonacci Trading Institute. All rights reserved.
advance of the price rise and could be used for Trend Continuation Entries, Counter Trend Entries orplaces for taking profit.4.2 Fibonacci Price Extension Example in a Falling MarketThe chart on the right of the Dow Jones FuturesIndex shows an example of how Fibonacci PriceExtensions are plotted on a falling market.Price had risen creating a swing high pivot at19842 (HIGH). The market then declined creatinga swing low pivot at 19808 (LOW). FibonacciExtensions were then plotted from the swing lowto swing high data points creating Fibonacci priceprojections below the current market.Price eventually fell where it stalled at the 161.8%extension line, broke through it and then retestedthat same level a number of times before finallymoving down to the 261.8% extension where itfound support. The reaction from the 261.8% levelwas temporary as price declined further to breakthe level, retest it yet again, before finally fallingall the way down to the 423.6% level where itfound support. The support was sufficient to raisethe price back to the 261.8% level.The Fibonacci Price Extension levels were plotted well in advance of the price decline and could beused for Trend Continuation Entries, Counter Trend Entries or places for taking ion Copyright 2018 Fibonacci Trading Institute. All rights reserved.
5.0 - Fibonacci Trading Institute5.1 Fibonacci Trading Institute (FTI) Proprietary Fibonacci LevelsAt Fibonacci Trading Institute the power of Fibonacci has been harnessed and its core conceptsutilized to derive proprietary levels. The accuracy has enabled FTI to develop strategies around thesekey levels and identify trading opportunities with the knowledge of where price is in relation tosupport or resistance. These levels are also essential for determining highly accurate profit targets.These proprietary Fibonacci levels are identified far in advance of price ever reaching an area andallow FTI to identify not just target, but also trend inception and trend reversal areas.The FTI method is then applied to these core areas with well-defined entries, stop placements andprice targets. The method can be applied to any instrument and any timeframe whether you are ascalper, day trader, position trader or investor the FTI method is applicable to all types of trader.Short-term charts, from 1 minute to hourly identify price targets minutes or hours before the targetsare reached. Identical strategies are used on long-terms charts for positon trading, option tradingand investment decisions. Charts, such as daily, weekly and monthly identify key targets days, weeksand months in advance.On the following pages you can see a number of examples from short term day trading charts to longterm charts where targets were identified in advance with the same accuracy. This can also bewitnessed daily in live markets in our Fibonacci Day Trading room and videos can be fo
Section 5.0 Fibonacci Trading Institute 5.1 Fibonacci Trading Institute Proprietary Fibonacci Levels 5.2 Fibonacci Trading Institute Proprietary Method 5.3 Contact Fibonacci Trading Institute