Transcription
FMEAFailure Mode Effects AnalysisASQ/APICS Joint MeetingMay 10, 2017
FMEA (Failure Mode and Effects Analysis) Failure Mode and Effects Analysis Agenda What is it? Motivation FMEA Methods Examples
What is an FMEA?Description: Failure modes and effects analysis (FMEA) is a step-by-stepapproach for identifying all possible failures in a design, amanufacturing or assembly process, or a final product orservice.Acronyms FMEA: Failure Modes and Effects Analysis PFMEA: Production DFMEA: Design FMECA: Failure Modes and Effects and Criticality Analysis
Failures, Failure Modes, Effects Analysis Failure modes” means the ways, or modes, in whichsomething might fail. Failures are any errors or defects, especially ones that affectthe customer, and can be potential or actual. “Effects analysis” refers to studying the consequences, oreffects, of those failures.
FMEA is a Tool FMEA is a tool that allows you to: Prevent System, Product, and Process problems beforethey occur Reduce costs by identifying process improvement early inthe development cycle Create more robust processes Prioritize actions that reduce risk of failure Evaluate the system, design, and processes from a newvantage point.
A Systematic Process FMEA provides a systematic process to:– Identify and evaluate potential failure modes potential causes of the failure mode– Identify and quantify the impact of potential failures– Identify and prioritize actions to reduce or eliminate the potential failure– Implement action plan based on assigned responsibilities and completiondates– Document the associated activities
Motivation for Conducting a FMEA Improves design by discovering unanticipated failures Highlights the impact of the failures Potentially helpful during legal actions Provides a method to characterize product safety Often required (e.g. FDA and DOD procurement) Provide risk assessments required by ISO 9001:2015
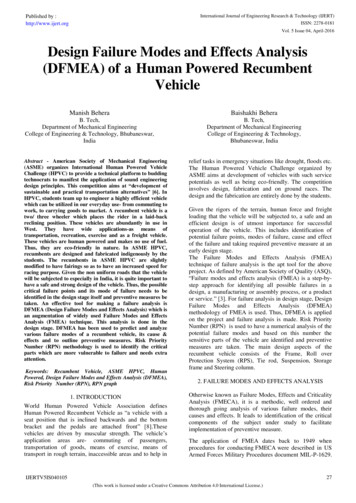
Types of FMEA
When to Use an FMEA When a process, product, or service is being designed or redesigned,after QFD and before the design is finalized, or . . . When an existing process, product, or service is being applied in anew way, or . . . Before developing control plans for a new or modified process, or . . . When improvement goals are planned for an existing process,product, or service, or . . . When analyzing failures of an existing process, product, or service And periodically throughout the life of the process, product, orservice
Method to Conduct an FMEA(taken from ASM Handbook Vol. 11) Identify all components or systems at given level of thedesign hierarchy. List the function of each identified component or system. Identify failure modes for each component/system. Typicallythere will be several ways in which a component can fail. Determine the effect (both locally and globally) on thesystem.
Method to Conduct an FMEA(taken from ASM Handbook Vol. 11) Classify the failure by its effects on the system operation. Determine the failure’s probability of occurrence. Identify how the failure mode can be detected (maypoint out what needs to be inspected on a regularbasis). Identify any compensating provisions or design changesto mitigate the failure effects.
DESIGN FMEA (DFMEA) The Design FMEA is used to analyze products before they arereleased to production. It focuses on potential failure modes of products caused bydesign deficiencies. Design FMEAs are normally done at three levels – system,subsystem, and component levels This type of FMEA is used to analyze hardware, functions or acombination
PROCESS FMEA (PFMEA) The Process FMEA is normally used to analyze manufacturingand assembly processes at the system, subsystem orcomponent levels. This type of FMEA focuses on potential failure modes of theprocess that are caused by manufacturing or assemblyprocess deficiencies.
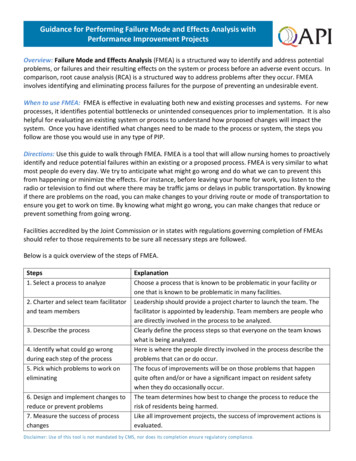
Conducting an FMEA Assemble a cross-functional team with diverse knowledge of theprocess, product, service, and customer needs Identify the scope of the FMEA Identify the functions of your scope by asking “what is the purpose ofthe system of this product or design? What does our customer expectitem to do” Complete FMEA for following the 10 steps on next slides
10 steps to creating a FMEA1. List the key process steps in the first column. These may come from thehighest ranked items of your C&E matrix.2. List the potential failure mode for each process step. In other words,figure out how this process step or input could go wrong.3. List the effects of this failure mode. If the failure mode occurs what doesthis mean to us and our customer in short what is the effect?4. Rate how severe this effect is with 1 being not severe at all and 10 beingextremely severe. Ensure the team understands and agrees to the scalebefore you start. Also, make this ranking system “your own” and don’tbother trying to copy it out of a book.5. Identify the causes of the failure mode/effect and rank it as you did theeffects in the occurrence column. This time, as the name implies, we arescoring how likely this cause will occur. So, 1 means it is highly unlikely toever occur and 10 means we expect it to happen all the time.
10 steps to creating a FMEA6. Identify the controls in place to detect the issue and rank its effectiveness inthe detection column. Here a score of 1 would mean we have excellentcontrols and 10 would mean we have no controls or extremely weakcontrols. If a SOP is noted here (a weak control in my opinion) you should notethe SOP number.7. Multiply the severity, occurrence, and detection numbers and store this valuein the RPN (risk priority number) column. This is the key number that will beused to identify where the team should focus first. If, for example, we had aseverity of 10 (very severe), occurrence of 10 (happens all the time), anddetection of 10 (cannot detect it) our RPN is 1000. This means all hands ondeck we have a serious issue!8. Sort by RPN number and identify most critical issues. The team must decidewhere to focus first.9. Assign specific actions with responsible persons. Also, be sure to include thedate for when this action is expected to be complete.10. Once actions have been completed, re-score the occurrence and detection. Inmost cases we will not change the severity score unless the customer decidesthis is not an important issue.
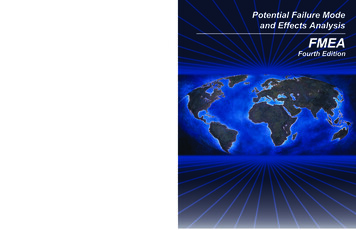
What to Do Function comes from Functional Analysis, FunctionalDecomposition Potential Failure Mode comes from things that have gonewrong in the past, concerns of designers, and brainstorming.Possible considerations are partial function, intermittentfunction, excess function. Potential Effects are consequences to the design, the user,and the environment. Safety and regulation noncomplianceare critical issues.
Stove Top Example
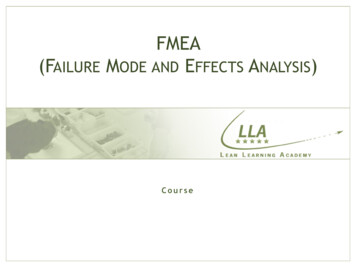
What to Do Potential Causes of failure should be engineeringrelated such as incorrect material, corrosion, wear andhuman related such as inexperience, misuse, etc. Current Design Controls are things like inspections,testing, poke yoke, and other design checks that areintended to prevent the problem.
Partial Example
Partial Example (Cont.)
What to Do Assign values to Severity, Occurrence, and Detectionusing the tables on the next three slides. Determine the Risk Priority Number (Severity*Occurrence * Detection) Develop an action plan Implement an action plan
Risk GuidelinesEffectRankCriteriaNone1No effectVery Slight2Negligible effect on Performance. Some users may notice.Slight3Slight effect on performance. Non vital faults will be noticed bymany usersMinor4Minor effect on performance. User is slightly dissatisfied.Moderate5Reduced performance with gradual performance degradation.User dissatisfied.Severe6Degraded performance, but safe and usable. User dissatisfied.High Severity7Very poor performance. Very dissatisfied user.Very High Severity8Inoperable but safe.Extreme Severity9Probable failure with hazardous effects. Compliance withregulation is unlikely.Maximum Severity10Unpredictable failure with hazardous effects almost certain. Noncompliant with regulations.
Occurrence RankingOccurrenceRankCriteriaExtremely Unlikely1Less than 0.01 per thousandRemote Likelihood2 0.1 per thousand rate of occurrenceVery Low Likelihood3 0.5 per thousand rate of occurrenceLow Likelihood4 1 per thousand rate of occurrenceModerately LowLikelihood5 2 per thousand rate of occurrenceMedium Likelihood6 5 per thousand rate of occurrenceModerately HighLikelihood7 10 per thousand rate of occurrenceVery High Severity8 20 per thousand rate of occurrenceExtreme Severity9 50 per thousand rate of occurrenceMaximum Severity10 100 per thousand rate of occurrence
Detection RankingDetectionRankCriteriaExtremely Likely1Can be corrected prior to prototype/ Controls will almost certainlydetectVery High Likelihood2Can be corrected prior to design release/Very High probability ofdetectionHigh Likelihood3Likely to be corrected/High probability of detectionModerately HighLikelihood4Design controls are moderately effectiveMedium Likelihood5Design controls have an even chance of workingModerately LowLikelihood6Design controls may miss the problemLow Likelihood7Design controls are likely to miss the problemVery Low Likelihood8Design controls have a poor chance of detectionRemote Likelihood9Unproven, unreliable design/poor chance for detectionExtremely Unlikely10No design technique available/Controls will not detect
RPN NumbersNeither RPN nor criticality are foolproof methods for determininghighest risk and priority for action. Severity, occurrence, anddetection are not equally weighted; their scales are not linear; andthe mathematics hides some surprises. For example, each of thethree scales can have values from 1 to 10, so RPN can range from1 to 1000 —yet there are only 120 possible RPN values. Use RPNand criticality as guides, but also rely on your judgment. Effects withvery high severity and any chance of occurrence must beaddressed!
Taking Actions transforms the FMEA from a paper chase into a valuable tool. taking action, especially to reduce severity and occurrenceratings, you can prevent problems, reduce design and development, and start-up time and cost; improve customer satisfaction; and gain competitive advantage.
Related Tools for FMEA Tables, matrices, and checklists Brainstorming, affinity diagrams, and other idea creation tools Flowcharts and other process analysis tools All the cause analysis tools, especially fault tree analysis,Pareto charts, why–why, and is–is not Control charts, design ofexperiments Graphs, histograms, scatter diagrams, statistical analysis, andother data collection and analysis tools
Thank You Any Questions? For more information visit -tools/overview/fmea.html Or contact me at g.tanzman@tanzco.net(914) 475-2955
FMEA Failure Mode Effects Analysis ASQ/APICS Jo