Transcription
Li et al. Eye and Vision(2020) ARCHOpen AccessAccuracy of intraocular lens powercalculation formulae after laser refractivesurgery in myopic eyes: a meta-analysisHongyu Li1†, Li Nan2†, Jun Li2 and Hui Song1,2*AbstractBackground: To compare the accuracy of intraocular lens power calculation formulae after laser refractive surgeryin myopic eyes.Methods: We searched the databases on PubMed, EMBASE, Web of Science and the Cochrane library to selectrelevant studies published between Jan 1st, 2009 and Aug 11th, 2019. Primary outcomes were the percentages ofrefractive prediction error within 0.5 D and 1.0 D.Results: The final meta-analysis included 16 studies using seven common methods (ASCRS average, Barrett True-Kno history, Double-K SRK/T, Haigis-L, OCT formula, Shammas-PL, and Wang-Koch-Maloney). ASCRS average yieldedsignificantly higher percentage of refractive prediction error within 0.5 D than Haigis-L, Shammas-PL and WangKoch-Maloney (P 0.009, 0.01, 0.008, respectively). Barrett True-K no history also yielded significantly higherpercentage of refractive prediction error within 0.5 D than Shammas-PL and Wang-Koch-Maloney (P 0.01, P 0.0001, respectively), and a similar result was found when comparing OCT formula with Haigis-L and Shammas-PL(P 0.03, P 0.01, respectively).Conclusion: The ASCRS average or Barrett True-K no history should be used to calculate the intraocular lens powerin eyes after myopic laser refractive surgery. The OCT formula if available, can also be a good alternative choice.Keywords: Myopic, Laser, Refractive, IOL power calculation, Meta-analysisBackgroundPatients who have had corneal excimer laser surgery arenow facing cataract surgery with aging. It is a challengefor many ophthalmologists to accurately calculate the intraocular lens (IOL) power in eyes after refractive surgery. Calculating the IOL power using the thirdgeneration formulae results in significant hyperopicerror in eyes with previous myopic corneal refractivesurgery [1]. For most myopic patients, the need for* Correspondence: songh221@hotmail.com†Hongyu Li and Li Nan contributed equally to this work.1Clinical College of Ophthalmology, Tianjin Medical University, Tianjin, China2Tianjin Eye Institute, Tianjin Key Lab of Ophthalmology and Visual Science,Tianjin Eye Hospital, No. 4 Gansu Road, He-ping District, Tianjin 300020,Chinaspectacles and hyperopia shift after cataract surgery areparticularly bothersome. Two main sources of error inIOL power calculation after corneal refractive surgeryexist: corneal power measurement error [2, 3] and effective lens position (ELP) error [4]. Error of corneal poweris in itself a two-pronged problem. First, all manual andmost topographers miss the central cornea which is theflattest area after myopic ablation. Second, the topographers do not consider the alteration of the ratio betweenanterior and posterior corneal curvature that occursafter excimer laser ablation, and thus use an inappropriate refractive index for corneal power calculation. Thesecond main error is effective lens position. Althoughthis is challenging in virgin eyes as well, it imposes The Author(s). 2020 Open Access This article is licensed under a Creative Commons Attribution 4.0 International License,which permits use, sharing, adaptation, distribution and reproduction in any medium or format, as long as you giveappropriate credit to the original author(s) and the source, provide a link to the Creative Commons licence, and indicate ifchanges were made. The images or other third party material in this article are included in the article's Creative Commonslicence, unless indicated otherwise in a credit line to the material. If material is not included in the article's Creative Commonslicence and your intended use is not permitted by statutory regulation or exceeds the permitted use, you will need to obtainpermission directly from the copyright holder. To view a copy of this licence, visit http://creativecommons.org/licenses/by/4.0/.The Creative Commons Public Domain Dedication waiver ) applies to thedata made available in this article, unless otherwise stated in a credit line to the data.
Li et al. Eye and Vision(2020) 7:37additional challenge after laser ablation, especially in formulae that use corneal power, but not anterior chamberdepth (ACD) to estimate ELP. All these errors lead tounderestimation of IOL power in myopic refractive surgery and the opposite in hyperopic surgery.Over the past few decades, various methods have beenproposed to address the accuracy of IOL power calculation with patients after corneal refractive surgery. Theclinical history method was once considered the goldstandard for IOL power calculation in patients after refractive surgery. However, cataract surgeons still experience situations where historical data are not available ornot credible. Therefore, the clinical history method wasproved to be not as accurate as it was thought to be.Several formulae that exclude the dependence of historical data are available, including the Barrett True-K nohistory [5], Double-K method [6], Haigis-L [7], OCT formula [8], Shammas-PL [9], Wang-Koch-Maloney (W-KM) [10], various IOL calculators [11], and others. Although the accuracy of these formulae is higher than thetraditional formulae and the historical data method, thepredictability amongst the abovementioned formulae isquite different in studies. Early studies demonstratedthat the Haigis-L and Shammas-PL have good precisionin IOL power calculation in eyes after corneal refractivesurgery [12, 13]. Abulafia et al. [5] and Vrijman et al.[14] showed that the Barrett True-K no history was significantly more accurate than Haigis-L and ShammasPL. Ianchulev et al. [15] suggested that the Barrett TrueK no history produced a smaller percentage of refractiveprediction error within 0.5 D and 1.0 D as comparedwith the Haigis-L. After Wang et al. provided the ASCRScalculator (available at: http://www.ascrs.org), the combined method became a good choice [16, 17]. Anothernew method i.e., the OCT formula, has been used in recent years. The debate about the best formula for IOLpower calculation in eyes after laser refractive surgerystill remains. The purpose of this meta-analysis was tocompare the accuracy of IOL power calculation formulae without historical data in eyes after myopic laser refractive surgery.MethodsLiterature searchTwo independent investigators (H.L. and L.N.) searchedthe databases of PubMed, EMBASE, Web of Science andthe Cochrane library. We searched and selected relevantstudies published between Jan 1st, 2009 and Aug 11th,2019, using the following search terms for PubMed:(Lenses Intraocular [Mesh] OR Intraocular Lens [Title/Abstract] OR Implantable Contact Lens [Title/Abstract]OR IOL [Title/Abstract]) AND (Refractive Surgical Procedures [Mesh] OR Laser Corneal Surgeries [Title/Abstract] OR Laser Keratectomy [Title/Abstract] OR LaserPage 2 of 10Corneal Surgeries [Title/Abstract] OR Keratomileusis,Laser In Situ [Mesh] OR LASIK [Title/Abstract] ORLaser-Assisted Stromal In Situ Keratomileusis [Title/Abstract] OR Photorefractive Keratectomy [Mesh] OR PRK[Title/Abstract]) AND (calculate* OR formula*) AND(last 10 years [PDat]). Regardless of the primary outcomeor language, we considered all possible studies for review. The two authors respectively evaluated the titlesand abstracts of all searched studies and performed amanual search by searching the reference list of all theeligible articles.Inclusion and exclusion criteriaInclusion criteria for studies were: (1) patients who hadlaser-assisted in situ keratomileusis (LASIK), photorefractive keratectomy (PRK) or laser-assisted subepithelialkeratomileusis (LASEK) for myopia and subsequent uneventful cataract surgery; (2) at least two types of the following IOL power calculation formulae must be havebeen used: ASCRS average, Barrett True-K no history,Double-K SRK/T, Haigis-L, OCT formula, Shammas-PL,and W-K-M; (3) Optical biometry measured by partialcoherence interferometry (PCI, IOL Master); (4) IOLconstants were optimized.Exclusion criteria for studies were: (1) patients whohad hyperopic refractive surgery or radial keratotomysurgery; (2) percentage of refractive prediction errorwithin 0.5 D and 1.0 D were unavailable; (3) eyes thathave not in-the-bag fixed IOL implantation or anotherocular surgery. Intraoperative refractive biometry [15],Shammas-PHL [18] and Olsen T formulae [19] were excluded because of their limited use in the clinic.Data extraction and quality assessmentWe compared ASCRS average, Barrett True-K no history, Double-K SRK/T, Haigis-L, OCT formula,Shammas-PL, and W-K-M formulae which were usedto calculate IOL power in eyes after myopic laser refractive surgery. The primary outcome assessed wereas follows: the percentages of refractive predictionerror within 0.5 D and 1.0 D. A higher percentageindicates higher precision of the formula. The two authors (H.L. and L.N.) independently extracted the dataand compared the results. Discrepancies were resolvedby another author (J.L.). We used a modified checklist adapted from the QUADAS-2 tool to assess thequality of the evidence [20, 21]. Study characteristicsextracted from the retrieved studies were the first author, year of publication, sample size, the formulaused and its percentages of refractive prediction errorwithin 0.5 D and 1.0 D, and the postoperative refraction time and refraction method.
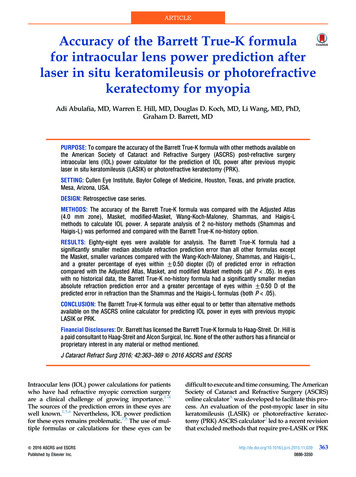
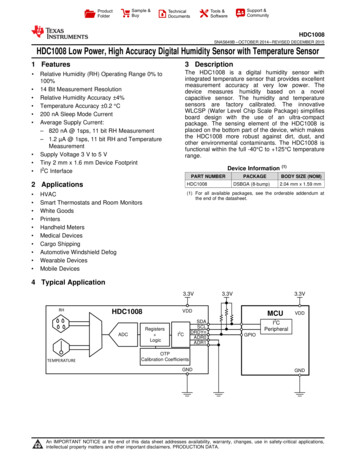
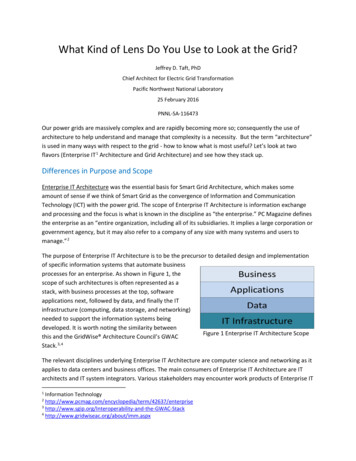
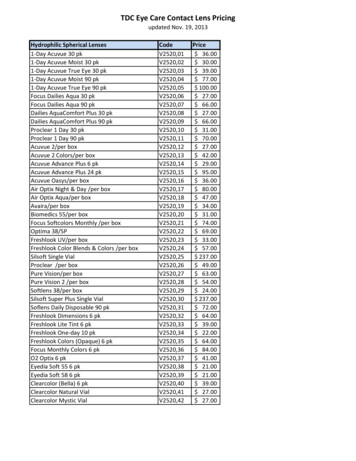
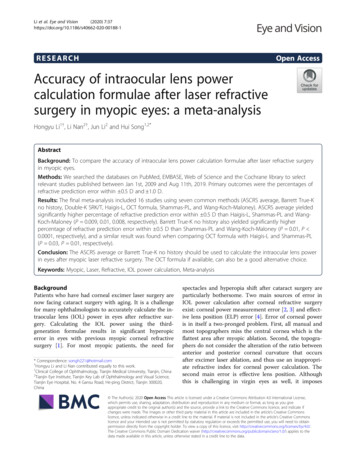
Li et al. Eye and Vision(2020) 7:37Statistical analysisThe target outcome was the percentages of refractiveprediction error within 0.5 D and 1.0 D of each formula. The refractive prediction error was calculated bysubtracting the predicted spherical equivalent from theactual postoperative spherical equivalent. For categoricaloutcomes, we calculated pooled estimates of the odds ratio (OR) with a fixed-effects model. Studies included inthe same meta-analysis are different, which is called heterogeneity. The I2 statistic was used to determine heterogeneity across studies, such that heterogeneity wasquantified irrespective of the number of studies. It coulddescribe the percentages of heterogeneity caused by eachstudy rather than sampling error. An I2 value greaterthan 50% was considered as substantial heterogeneity.We also conducted sensitivity analysis and subgroupanalysis to evaluate the change in overall effect when theI2 value was greater than 50%. Funnel plots were used toevaluate publication bias and small-study effect. Datapooling was done by using Review Manager (version 5.3,Cochrane Collaboration, Oxford, UK). A P value lessthan 0.05 was considered to be statistically significant.ResultsA total of 1144 articles were initially identified by literature search (Fig. 1). Among them, after removal ofFig. 1 Flowchart of articles selection (RK radial keratotomy)Page 3 of 10duplicates, 833 articles remained, of which 793 recordswere removed due to irrelevance. The remaining 40 articles were chosen for full-text evaluation. Among these,three studies did not have percentage data, 16 studies included only one of the selected formulae, five studieswere hyperopic laser refractive surgery or radial keratotomy surgery. After the exclusion of these studies, 16 articles were used for analysis [5, 12–17, 22–30].Study characteristics and quality assessmentIn total, there were 1167 eyes enrolled in the 16 studies (Table 1). Most of the studies (n 15) includedpatients implanting a mono-focal IOL in the capsularbag, only one study had multifocal IOL implantation,and another included patient with unclear exclusion.The quality assessment included in the study was performed using the modified QUADAS-2 (Fig. 2). Additional file 1 provides detailed information on thecomprehensive assessment. For patient selection, threestudies had inappropriate exclusions, resulting in ahigh risk of bias. Seven studies did not clarify patientenrollment methods, resulting in an unclear risk ofbias. For reference standard and flow assessment, onestudy performed subjective refraction and its followup time was less than 3 weeks. For the index test, allsixteen studies were of high quality.
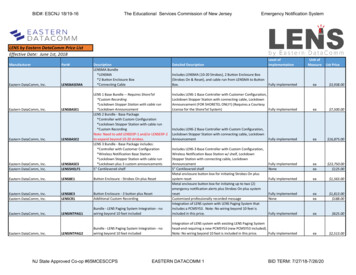
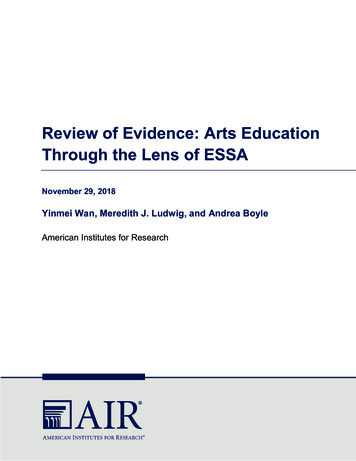
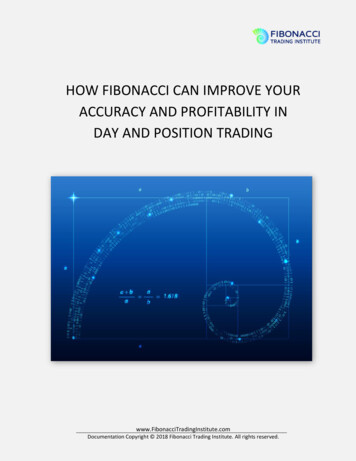
(2020) 7:37Li et al. Eye and VisionPage 4 of 10Table 1 Characteristics of study participantsAuthorYearEyesAge (years, mean SD)AL (mm,mean SD)Follow-up (days)RefractionHLSHLBTKAbulafia [5]201658NA25.85 1.35 21objective McCarthy [12]201117357.0 0.026.9 1.86203objective Wang [13]20107258.0 8.026.19 1.55 21objective DKVrijman [14]201964NA25.28 1.4NANA 2014246NA25.43 1.4330–90NA Yang [16]20136261.0 6.7925.98 1.5590–180objective Wang [17]201510463.0 7.025.46 1.321–90objective Huang [22]20134661.5 8.0NA 30objective Saiki1 [23]20132554.0 9.926.39 0.99 30objective Saiki2 [24]20132854.0 9.826.19 1.06 30objective Saiki [25]20142454.0 10.6NA 30objective Potvin [26]2015101NA25.83 1.36NANA Helaly [27]20164551.27 7.3128.66 2.7830–120objective Wu [28]20171050.3 9.030.06 2.87 90subjective 20185654.6 9.3727.04 2.3690objective Wang [30]20195364.5 7.125.72 1.64 21objective ASCRS OCT Ianchulev [15]Cho [29]WKM AL axial length, HL Haigis-L, SHL Shammas-PL, BTK Barrett true K no history, DK Double-K SRK/T, WKM Wang-Koch-Maloney, ASCRS ASCRS average, OCT optical coherence tomography formula, NA not availableOutcomesAmong the 1167 eyes enrolled, 332 eyes were calculatedwith ASCRS average, 279 with Barrett True-K no history, 291 with Double-K SRK/T, 1019 with Haigis-L, 150with OCT formula, 1055 with Shammas-PL, and 433with W-K-M. The overall percentages of refractive prediction error within 0.5 D ( 1.0 D) of the above formulae are 62.35% (87.95%), 59.14% (86.74%), 26.46%(51.89%), 46.22% (78.61%), 65.33% (91.33%), 47.68%(80.47%), and 45.50% (77.14%), respectively (Fig. 3).Percentage of refractive prediction error within 0.5 DFigure 4 shows the comparisons of the percentage of refractive prediction error within 0.5 D between Haigis-Land the other formulae. The percentage of refractive prediction error within 0.5 D calculated by the Haigis-L wassignificantly lower than the ASCRS average (Fig. 4a, P 0.009) and OCT formula (Fig. 4d, P 0.03). Shammas-PLalso produced significantly lower percentages than ASCRSaverage, Barrett True-K no history, and OCT formula(Additional file 2, P 0.01, P 0.01, P 0.01, respectively).The percentages obtained by ASCRS average and BarrettTrue-K no history was significantly higher than W-K-M(Additional file 2, P 0.0001 and P 0.008, respectively).Percentage of refractive prediction error within 1.0 DFigure 5 shows the comparisons of the percentage of refractive prediction error within 1.0 D between Haigis-Land other formulae. No significant statistical differencewas found when comparing Haigis-L with the other formulae (Additional file 3).Heterogeneity and subgroup analysisThe I2 values and 95% confidence interval (CI) areshown in Figs. 4 and 5. Using pairwise comparison, substantial heterogeneity was detected in two pairs and therandom-effect model was applied. The sensitivity analysis showed that by omitting Cho 2018, I2 significantlydecreased to 0% in the comparison of the percentage ofrefractive prediction error within 1.0 D betweenHaigis-L and Shammas-PL and between Haigis-L andW-K-M (Additional file 4, P 0.0004, P 0.004, respectively). Cho et al. (2018) did not show details of the IOLconstant optimization procedure and did not reportwhether the keratometry was measured from the IOLMaster. After omitting this study, the I2 value decreased.There was no significant finding from the funnel plot(Additional file 5).DiscussionCalculating the IOL power in eyes after refractive surgery is still a challenging task for most ophthalmologists.Chen et al. [31] have done a meta-analysis of evaluatingthe accuracy of IOL power calculation methods afterlaser refractive surgery in myopic eyes and found thatmany methods without historical data had similar accuracy compared with Haigis-L. However, they did not include the new formulae without historical data, such asASCRS average, Barrett True-K no history or OCT
Li et al. Eye and Vision(2020) 7:37Page 5 of 10Fig. 2 Quality assessment of the eligible studies according to the modified QUADAS-2formula. To our knowledge, this is the first metaanalysis to assess the accuracy of the different IOLpower calculation formulae with no historical data inmyopic eyes after laser refractive surgery by measuringthe percentage of refractive prediction error within 0.5D and 1.0 D.In order to control heterogeneity and biasness, we excluded the studies which performed optical biometricmeasurement by using devices such as ultrasound biometry (UB) or corneal topography, and which did not perform the constant optimization procedure. Previousstudies have shown that the refractive prediction errorsof the patients after cataract surgery were attributed toaxial length (AL) measurement (54%), post-ACDestimate (38%), and keratometry measurement (8%). Royet al. [32] indicated that the IOL Master had more accurate AL measurement than UB and the former wasthe gold standard for optical biometric measurement[33]. Besides, due to the use of different types of IOLs, itwas essential for each formula to use a constantoptimization procedure to equate the mean error tozero.Our meta-analysis suggests that only the overall percentages of refractive prediction error within 0.5 D or 1.0 D of ASCRS average, Barrett True-K no history orOCT formula can reach the benchmark standard of 55%being within 0.5 D and 85% within 1.0 D of refractiveprediction error for virgin eyes after phacoemulsification
Li et al. Eye and Vision(2020) 7:37Page 6 of 10Fig. 3 The overall percentage of refractive prediction error within 0.5 D and 1.0 D of the included formulae. ASCRS average means averagedegree from ASCRS calculator; Barrett True-K means Barrett True-K no history; Double-K means Double-K SRK/T; OCT means optical coherencetomography formula; W-K-M means Wang-Koch-Maloney; D means diopter[34]. In the percentage of refractive prediction errorwithin 0.5 D analysis: ASCRS average was more accurate than the Haigis-L, Shammas-PL and W-K-Mmethods. It was not surprising because the ASCRS calculator produced an average IOL power (ASCRS average) and became a good choice for surgeons, especiallyfor those who cannot choose a proper calculationmethod or judge which method was the best for theirpatients [16, 17]. In addition, our results also indicatedthat Barrett True-K no history was more accurate thanShammas-PL and W-K-M but not Haigis-L. BarrettTrue-K no history is based on Barrett universal II formula, which was first proposed in 2009 [5], however themathematical formula was not published. It could beused for free on the following websites (http://www.apacrs.org or http://www.ascrs.org), and studies havefound that they lead to accurate refractive results and isnow considered as one of the most reliable options aftermyopic and hyperopic LASIK/PRK [15, 35]. Another formula is Shammas-PL [9] which used data available atthe time of cataract surgery to predict the post refractivesurgery keratometry and W-K-M [13] which convertedanterior corneal power from Atlas topography, both ofwhich are regression formulae. Haigis-L, based on theregular Haigis formula, which uses three constants (a0,a1, a2) to predict the ELP, has proven to avoid error incorneal power measurement [7]. In recent years, HaigisL became the most popular method for IOL power calculation after refractive surgery, especially for Asiansand Germans [31, 36]. It is easily available on the IOLMaster. No statistical differences between Haigis-L andShammas-PL and W-K-M were found in our study,which is in tandem with previous reports [12].We also included the Double-K method in this metaanalysis, which was elaborated by Aram
laser-assisted in situ keratomileusis (LASIK), photore-fractive keratectomy (PRK) or laser-assisted subepithelial keratomileusis (LASEK) for myopia and subsequent un-eventful cataract surgery; (2) at least two types of the fol-lowing IOL power calculation formulae must be have been used: