Transcription
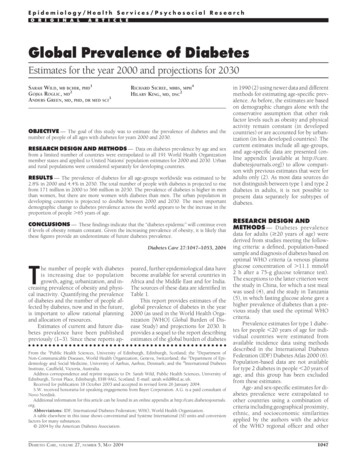
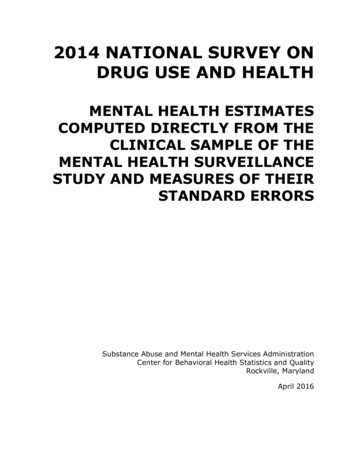
NCHS Data Brief No. 82 January 2012Prevalence of Obesity in the United States, 2009–2010Cynthia L. Ogden, Ph.D.; Margaret D. Carroll, M.S.P.H.; Brian K. Kit, M.D., M.P.H.;and Katherine M. Flegal, Ph.D.Key findingsData from the NationalHealth and NutritionExamination Survey,2009–2010 More than one-third ofadults and almost 17% of youthwere obese in 2009–2010. There was no change inthe prevalence of obesityamong adults or children from2007–2008 to 2009–2010. Obesity prevalence didnot differ between men andwomen.Obesity increases the risk of a number of health conditions includinghypertension, adverse lipid concentrations, and type 2 diabetes (1). Theprevalence of obesity in the United States increased during the last decadesof the 20th century (2,3). More recently there appears to have been a slowingof the rate of increase or even a leveling off (4,5). Given the health risksof obesity and its high prevalence, it is important to continue to track theprevalence of obesity among U.S. adults and children. This report presentsthe most recent national estimates of obesity in the United States based onmeasured weight and height.Keywords: National Health and Nutrition Examination Survey adults childrenIn 2009–2010, 35.7% of U.S. adults were obese.Figure 1. Prevalence of obesity among adults aged 20 and over, by sex and age: United States,2009–201050 Adults aged 60 and overwere more likely to be obesethan younger adults.Age in years:20 and over36.635.740–5960 and over42.339.74035.532.6Percent20–3937.2 t increasing linear trend by age (p 0.01).Significant increasing linear trend by age (p 0.001).NOTE: Estimates were age adjusted by the direct method to the 2000 U.S. Census population using the age groups 20–39, 40–59,and 60 and over.SOURCE: CDC/NCHS, National Health and Nutrition Examination Survey, 2009–2010.12U.S. DEPARTMENT OF HEALTH AND HUMAN SERVICESCenters for Disease Control and PreventionNational Center for Health Statistics
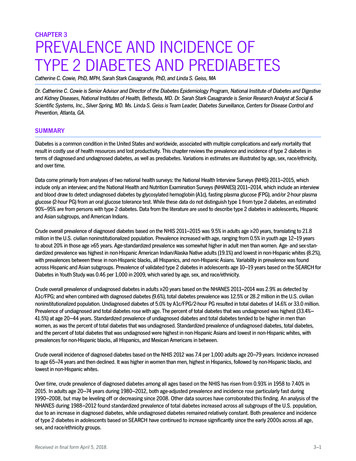
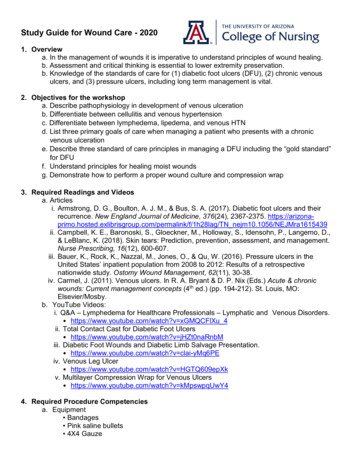
NCHS Data Brief No. 82 January 2012More than 35% of U.S. men and women were obese in 2009–2010. There was no significantdifference in prevalence between men and women at any age. Overall, adults aged 60 and overwere more likely to be obese than younger adults. Among men there was no significant differencein obesity prevalence by age. Among women, however, 42.3% of those aged 60 and over wereobese compared with 31.9% of women aged 20–39 (Figure 1).In 2009–2010, 16.9% of U.S. children and adolescents were obese.The prevalence of obesity was higher among adolescents than among preschool-aged children(Figure 2). The prevalence of obesity was higher among boys than girls (18.6% of boys and15.0% of girls were obese).Figure 2. Prevalence of obesity among children and adolescents aged 2–19, by sex and age: United States, 2009–2010Age in ignificant increasing linear trend by age (p 0.005).SOURCE: CDC/NCHS, National Health and Nutrition Examination Survey, 2009–2010.1 2 Girls117.1
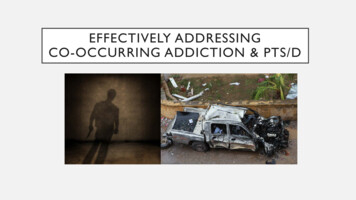
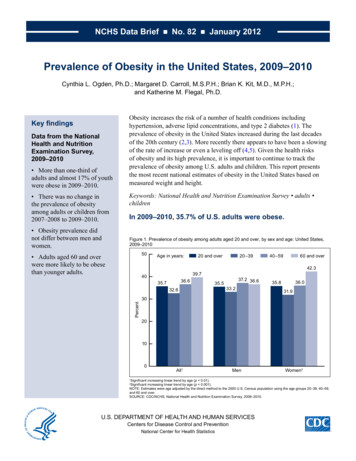
NCHS Data Brief No. 82 January 2012In 2009–2010, over 78 million U.S. adults and about 12.5 million U.S.children and adolescents were obese.Almost 41 million women and more than 37 million men aged 20 and over were obese in2009–2010 (Figure 3). Among children and adolescents aged 2–19, more than 5 million girls andapproximately 7 million boys were obese.Figure 3. Number of obese individuals: United States, 2009–201080FemalesMalesNumber in millions6040.6402037.55.507.0Adults aged 20 years and overChildren and adolescents aged 2–19 yearsSOURCE: CDC/NCHS, National Health and Nutrition Examination Survey, 2009–2010. 3
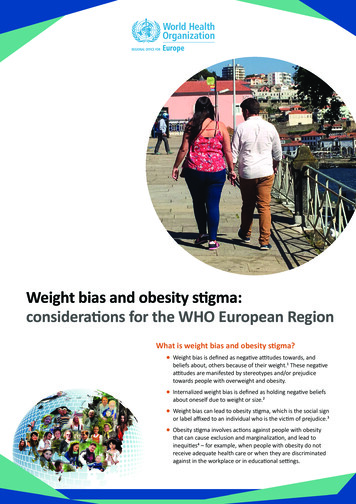
NCHS Data Brief No. 82 January 2012Between 1999–2000 and 2009–2010, the prevalence of obesity increasedamong men but not among women.In 1999–2000, 27.5% of men were obese, and by 2009–2010 the prevalence had increasedto 35.5%. Among women, 33.4% were obese in 1999–2000 with no significant change in2009–2010 (35.8%). In 1999–2000, the prevalence of obesity was higher in women than in men.Between 1999–2000 and 2009–2010, the difference in the prevalence of obesity between menand women decreased so that in 2009–2010, the prevalence of obesity in men was virtually equalto that in women (Figure 4). There was no significant change in the prevalence of obesity from2007–2008 to 2009–2010 overall or among men or women.Figure 4. Trends in the prevalence of obesity among adults aged 20 and over, by sex: United States, 10YearsSignificant increasing linear trend 1999–2000 to 2009–2010 (p 0.0001).NOTE: Estimates were age adjusted by the direct method to the 2000 U.S. Census population using the age groups 20–39, 40–59, and 60 and over.SOURCE: CDC/NCHS, National Health and Nutrition Examination Survey, 2009–2010.1 4
NCHS Data Brief No. 82 January 2012Between 1999–2000 and 2009–2010, there was an increase in theprevalence of obesity among boys but not among girls.The prevalence of obesity among boys increased from 14.0% in 1999–2000 to 18.6% in2009–2010. There was no significant change among girls: the prevalence was 13.8% in1999–2000 and 15.0% in 2009–2010 (Figure 5). There was no significant change in obesityprevalence from 2007–2008 to 2009–2010 overall or among boys or girls.Figure 5. Trends in the prevalence of obesity among children and adolescents aged 2–19, by sex: United cant increasing linear trend 1999–2000 to 2009–2010 (p 0.05).SOURCE: CDC/NCHS, National Health and Nutrition Examination Survey, 2009–2010.1 5 2007–20082009–2010
NCHS Data Brief No. 82 January 2012SummaryThe most recent national data on obesity prevalence among U.S. adults, adolescents, andchildren show that more than one-third of adults and almost 17% of children and adolescentswere obese in 2009–2010. Differences in prevalence between men and women diminishedbetween 1999–2000 and 2009–2010, with the prevalence of obesity among men reaching thesame level as that among women.Age differences in obesity prevalence varied between men and women. The prevalence of obesitywas higher among older women compared with younger women, but there was no difference byage in obesity prevalence among men. Among children and adolescents, the prevalence of obesitywas higher among adolescents than among preschool-aged children.There has been no change in obesity prevalence in recent years; however, over the last decadethere has been a significant increase in obesity prevalence among men and boys but not amongwomen and girls overall. The Healthy People 2010 goals of 15% obesity among adults and 5%obesity among children were not met (6).DefinitionObesity: Body mass index (BMI) was calculated as weight in kilograms divided by height inmeters squared, rounded to one decimal place. Obesity in adults was defined as BMI greater thanor equal to 30 (1). Examples of adult obesity cut points at specific heights are shown in the Table.The definition of obesity for children is not directly comparable with the definition for adults.Obesity in children was defined as a BMI greater than or equal to the age- and sex-specific 95thpercentiles of the 2000 CDC growth charts (7).Table. Obesity cut points for adults 5’4” and 5’9” in heightHeightObesity weight range5’4”/1.63 meters174 pounds or more/79 kilograms or more5’9”/1.75 meters203 pounds or more/92 kilograms or moreData source and methodsThe National Health and Nutrition Examination Surveys (NHANES) conducted from 1999 through2010 were used for these analyses. NHANES is a cross-sectional survey designed to monitor thehealth and nutritional status of the civilian noninstitutionalized U.S. population (8). The surveyconsists of interviews conducted in participants’ homes, standardized physical examinationsconducted in mobile examination centers, and laboratory tests utilizing blood and urine specimensprovided by participants during the physical examination.The NHANES sample is selected through a complex multistage probability design that includesselection of primary sampling units (counties), household segments within the counties, householdswithin household segments and, finally, sample persons from selected households. In 2009–2010,non-Hispanic black and Hispanic persons, persons with low income, and those aged 60 and overwere oversampled in order to obtain reliable estimates of health and nutritional measures for thesepopulation subgroups. In 1999, NHANES became a continuous survey fielded on an ongoing basis.Each year of data collection is based on a representative sample covering all ages of the civiliannoninstitutionalized population. Public-use data files are released in 2-year cycles. 6
NCHS Data Brief No. 82 January 2012Sample weights, which account for the differential probabilities of selection, nonresponse, andnoncoverage, are incorporated into the estimation process. All variance estimates accounted for thecomplex survey design by using Taylor series linearization.Estimates of the number of obese individuals were calculated using the average Current PopulationSurvey totals for 2009–2010 (available from: http://www.cdc.gov/nchs/nhanes/response ratesCPS.htm).Prevalence estimates for the total adult population were age adjusted using the direct method tothe 2000 U.S. Census population using the age groups 20–39, 40–59, and 60 and over. Differencesbetween groups were tested using a univariate t statistic at the p 0.05 significance level. Alldifferences reported are statistically significant unless otherwise indicated. Adjustments were notmade for multiple comparisons. Statistical analyses were conducted using the SAS System forWindows (release 9.1; SAS Institute, Cary, N.C.) and SUDAAN (release 9.0; RTI International,Research Triangle Park, N.C.).About the authorsCynthia L. Ogden, Margaret D. Carroll, and Brian K. Kit are with the Centers for Disease Controland Prevention’s (CDC) National Center for Health Statistics (NCHS), Division of Health andNutrition Examination Surveys. Katherine M. Flegal is with CDC’s NCHS, Office of the Director.References1. National Institutes of Health. Clinical guidelines on the identification, evaluation, andtreatment of overweight and obesity in adults—The evidence report. Obes Res 6(Suppl 2):51S–209S. 1998.2. Flegal KM, Carroll MD, Ogden CL, Johnson CL. Prevalence and trends in obesity among USadults, 1999–2000. JAMA 288(14):1723–7. 2002.3. Ogden CL, Flegal KM, Carroll MD, Johnson CL. Prevalence and trends in overweight amongUS children and adolescents, 1999–2000. JAMA 288(14):1728–32. 2002.4. Flegal KM, Carroll MD, Ogden CL, Curtin LR. Prevalence and trends in obesity among USadults, 1999–2008. JAMA 303(3):235–41. 2010.5. Ogden CL, Carroll MD, Curtin LR, Lamb MM, Flegal KM. Prevalence of high body massindex in US children and adolescents, 2007–2008. JAMA 303(3):242–9. 2010.6. U.S. Department of Health and Human Services. Final review, Healthy People 2010: Nutritionand overweight. Available from: http://www.cdc.gov/nchs/data/hpdata2010/hp2010 finalreview focus area 19.pdf.7. Ogden CL, Flegal KM. Changes in terminology for childhood overweight and obesity.National health statistics reports; no 25. Hyattsville, MD: National Center for Health Statistics.2010.8. National Center for Health Statistics. National Health and Nutrition Examination Survey.Questionnaires, datasets, and related documentation. Available from: http://www.cdc.gov/nchs/nhanes/nhanes questionnaires.htm. 7
U.S. DEPARTMENT OFHEALTH & HUMAN SERVICESFIRST CLASS MAILPOSTAGE & FEES PAIDCDC/NCHSPERMIT NO. G-284Centers for Disease Control and PreventionNational Center for Health Statistics3311 Toledo RoadHyattsville, MD 20782OFFICIAL BUSINESSPENALTY FOR PRIVATE USE, 300NCHS Data Brief No. 82 January 2012Suggested citationOgden CL, Carroll MD, Kit BK, Flegal KM.Prevalence of obesity in the United States,2009–2010. NCHS data brief, no 82.Hyattsville, MD: National Center for HealthStatistics. 2012.Copyright informationAll material appearing in this report is inthe public domain and may be reproducedor copied without permission; citation as tosource, however, is appreciated.National Center for HealthStatisticsEdward J. Sondik, Ph.D., DirectorJennifer H. Madans, Ph.D., AssociateDirector for ScienceDivision of Health and NutritionExamination SurveysClifford L. Johnson, M.S.P.H., DirectorFor e-mail updates on NCHS publicationreleases, subscribe online at:http://www.cdc.gov/nchs/govdelivery.htm.For questions or general information aboutNCHS: Tel: 1–800–232–4636E-mail: cdcinfo@cdc.govInternet: http://www.cdc.gov/nchsISSN 1941–4927 (Print ed.)ISSN 1941–4935 (Online ed.)CS229086DHHS Publication No. (PHS) 2012–1209
1999-2000 and 15.0% in 2009-2010 (Figure 5). There was no significant change in obesity prevalence from 2007-2008 to 2009-2010 overall or among boys or girls. 1. Significant increasing linear trend 1999-2000 to 2009-2010 (p 0.05). SOURCE: CDC/NCHS, National Health and Nutrition Examination Survey, 2009-2010. Figure 5.