Transcription
2022 Supply ChainSalary andCareer Report
2 2022 Supply Chain Salary and Career ReportKey FindingsSalaries and compensation are upRespondents report an average 9% pay increase. Overall compensation grew by anSupply chain professionals minimally impactedby the Great Resignationaverage of 12%. Total median compensation is just under 100k.Amid the great resignation and reshuffle, supply chain professionals appear to haveGap narrowing for women and people of color atpublic companiesWomen under 40 earned more than their male counterparts for the second year in a row.changed jobs less than people in other industries. This year 14% of respondents founda new job — just a 1% increase over last year’s data. Only 0.5% (nine total respondents)report a layoff. Of the nine laid off, three so far have found a new job.Women ages 40 to 49 narrowed the pay gap to 8% less than their male counterparts,Professional development pays offfrom 15% in 2020.Professional development is highly valued by employers. Employees with just oneIn addition, salaries are more equitable for people of color at publicly traded companies,while the gap is wider at privately held companies. Similarly, women at publicly heldcompanies report a salary slightly higher than men, but women’s salaries were markedlylower than men’s at privately held companies.Paid time off and flexibilityNearly half (48%) of supply chain professionals receive four weeks or more paid timecertification, certificate or credential earn 17% more than those without. APICScertification is particularly in demand, as people with at least one APICS certificationearn 25% more than those without.Additionally, more than just a supply chain degree is needed to increase one’s value inthe field. Professionals with a BA in supply chain and an APICS certification earn 18%more than those with a supply chain BA alone.off. Also 20% of respondents report that their company increased the number of paidPeople love their supply chain jobsholidays in the last year. In addition, two-thirds of supply chain professionals work in aDespite ongoing disruption, career satisfaction has held strong. Supply chainhybrid or permanent work-from-home setting, demonstrating that many supply chainprofessionals continue to report high job satisfaction even amid a year of turmoil.professionals do not need to be on-site.
3 2022 Supply Chain Salary and Career ReportTable of ContentsUnited States5 Supply Chain SalariesSalary increasesCanada16 Paid Time Offand Flexibility24 Supply Chain Salariesin CanadaSalary by tenureThe Great ResignationWork-life balance in CanadaSalary by functional titleCareer satisfactionSalary by education levelin CanadaCommon supply chainjob trajectoriesCommon titles withinSCOR functions12 Diversity, Equityand InclusionPublic-private gap14 Salary byEducation LevelAreas of study19 Technical andLeadership Skills20 ProfessionalDevelopment Pays OffThe value of APICS certificationsAPICS certification augmentsa degree32 AppendixSurvey demographicsGlobal median salariesAge, gender and ethnicityCompany characteristicsIndustriesOther global median salariesEurope28 Supply Chain Salariesin EuropeWork-life balance in EuropeMost common areas of studyin Europe
United States
5 2022 Supply Chain Salary and Career ReportSupply Chain SalariesSupply chain salaries are up from 2020, with median total compensation increasing by 12% to 96,000 (including additionalcompensation). Overall, supply chain salaries ranged from 56,000 to 185,000 annually. Additional cash compensation includes cashbonus, profit sharing, incentive pay and overtime pay. 185,000Additional CompensationNearly three-fourths (71%) of respondents earned at least one form of additional 131,166 96,000 72,000 56,000 150,000 115,000Base salarycompensation was 8,000.Additional forms of compensation received60% 13% 8% 7% 88,000 69,000 55,00010th percentilecompensation, ranging from 3,000 to as high as 16,000. The median additionalCash bonus25th percentileBonus50th percentile75th percentile90th percentileProfit sharingIncentive payOvertime pay
6 2022 Supply Chain Salary and Career ReportSalary IncreasesSalary increases were high in 2021, with 79% of respondents reporting an increase, up from 59% in 2020. This is noteworthy during ayear that involved layoffs and tightened budgets due to the pandemic. The average salary increase was 9%, up 3% from the previousyear. More than one-third (35%) of respondents received an increase of 8% or more.35%2%-3.9%23%4%-7.9%20%8%-15%7%Less than 2%Percent increase15%More than 15%
7 2022 Supply Chain Salary and Career ReportSalary by TenureWhile entry-level salaries remained consistent compared to last year, across the board,salaries were higher in 2021 for nearly all other years of experience.Salary by years of experience in supply chain 125,191 115,077 100,000 91,547 60,000 60,000Less than 12020 61,7501-22021 67,000 68,0003-4 72,625 80,0005-9 82,00010-1920 or more
8 2022 Supply Chain Salary and Career ReportSalary by Functional Title25th percentile50th percentile75th percentileSupply Chain Director 125,750 155,000 184,750Director of Operations 114,050 141,100 160,000Supply Chain Manager 92,500 105,000 121,500Operations Manager 80,000 97,000 110,000Logistics Manager 75,500 95,000 111,000Materials Manager 74,625 94,900 136,500Inventory Manager 78,000 93,500 101,000Master Scheduler 74,450 85,000 102,500Purchasing Manager 70,000 80,000 94,750Demand Planner 68,250 77,000 89,500Warehouse Manager 62,000 75,000 82,500Production Planner 60,000 68,920 80,000Buyer-Planner 55,000 65,780 75,750Buyer 50,000 60,000 69,750Of the most commonly reportedfunctional titles, supply chaindirectors, directors of operationsand supply chain managers earnthe highest salaries.
9 2022 Supply Chain Salary and Career ReportCommon Supply Chain Job TrajectoriesPrevious titlesCurrent titleTitles upon promotionSupply Chain Manager / Inventory Manager / Procurement DirectorSupply Chain DirectorVice President of Supply Chain / Chief Operating OfficerOperations Associate / Operations ManagerDirector of OperationsOperations Director / Vice President of OperationsMaterials Manager / Master Scheduler / PlannerSupply Chain ManagerDirector of Supply Chain / Director of Operations / Vice PresidentInventory Manager / Regional Manager / Various other experienceOperations ManagerOperations Director / Supply Chain ManagerLogistics Coordinator / Various other logistics experienceLogistics ManagerSupply Chain Director / Senior Logistics ManagerBuyer / Inventory ManagerMaterials ManagerOperations Manager / Operations Director / Supply Chain ManagerInventory Planner / Inventory Analyst / AssociateInventory ManagerDirector of Operations / Supply Chain DirectorVarious other experienced / None or Entry LevelBuyer / Senior BuyerSupply Chain Associate / Various other supply chain experienceWarehouse Supervisor / Various other warehouse experienceBuyer / Planner / Inventory Analyst / AssociateBuyer-PlannerPurchasing Clerk / Bookkeeper / None or Entry LevelMaster SchedulerPurchasing ManagerDemand PlannerWarehouse ManagerProduction PlannerBuyer PlannerBuyerPlanning Manager / Supply Chain ManagerSupply Chain Manager / Director of PurchasingSenior Demand Planner / Supply Chain Manager / Supply Chain DirectorDirector of OperationsMaterials Manager / Supply Chain Manager / Senior Production PlannerPurchasing Manager / Supply Chain Manager / Operations ManagerPurchasing Manager / Materials Manager / Supply Chain Manager
10 2022 Supply Chain Salary and Career ReportCommon Job Titles WithinSCOR FunctionsBreakdown of job titles based on the Supply ChainOperations Reference (SCOR) modelPlanSourceMakeDeliverReturnEnableʓDemand PlannerʓBuyerʓProduction PlannerʓLogistics ManagerʓLogistics ManagerʓBusiness AnalystʓBuyer-PlannerʓCommodity ManagerʓOperations ManagerʓWarehouse ManagerʓOperations ManagerʓSolution ArchitectʓInventory ManagerʓProcurement ManagerʓPlant ManagerʓOperations ManagerʓInventory ManagerʓConsultantʓMaterials ManagerʓPurchasing ManagerʓMaster SchedulerʓDistribution ManagerʓBuyerʓProject ManagerʓProduction PlannerʓSourcing ManagerʓMaster Scheduler
11 2022 Supply Chain Salary and Career ReportDiversity, Equity and InclusionIn 2020, salary equity improved between men and women. There was continued advancement in 2021, as women under 40 earnedslightly more than men, and women ages 40 to 49 narrowed the pay gap to 8%, from 15% in 2020. The gap for those 50 and overwidened, and the gap overall widened slightly compared to last year.Salary and gender by age20-29 71,000Median salary comparisonPay gap trendover time 95,000201713% 75,00030-39 90,000 85,656201812% 86,000 85,00040-49 102,096 94,75050-598% 120,000 90,00060 and older 118,500Women2020 75,0002% 70,0002017 101,222Men2019 80,000MenWomen201820192020202120216%
12 2022 Supply Chain Salary and Career ReportDiversity, Equity and Inclusion (continued)A salary gap still exists for people of color in supply chain. The pay gap for Black women narrowed to 4%, compared to an 11% disparitybetween Black men’s and women’s salaries the previous year. Hispanic/Latinx women report a median salary 2% higher than Hispanic/Latinx men.Salary by gender, race and ethnicity 84,000 85,000 90,000 85,440Mediansalary2021salary gap2020salary gapBlack 82,0009%12%Hispanic/Latinx 85,0005%14%White 89,000—— 81,000BlackMen 87,000Median salary by race and ethnicityHispanic/LatinxWomenWhite
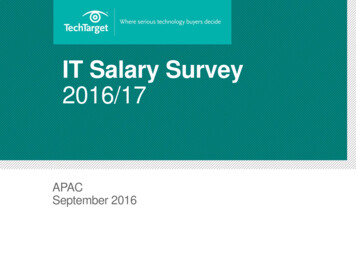
13 2022 Supply Chain Salary and Career ReportPublic-Private GapThe major source of inequity gaps for people of color and women appears to be private organizations. The salaries reported frompublicly traded companies were higher and more equitable. The pay gap between white and Black people was 4% at public firms, whilethe gap was 9% with private firms. At public firms, women report salaries 4% higher than men; at private firms, the gap is 11% infavor of men.Salary by race and ethnicity: public versus privateSalary by gender: public versus private 102,000 88,500 92,000 92,000 86,450 85,000 78,000PublicBlack 96,000PrivateHispanic/LatinxWhite 77,719 78,000PublicMenPrivateWomen
14 2022 Supply Chain Salary and Career ReportSalary by Education LevelMore than half (54%) of supply chain professionals have a bachelor’s degree and earn a median salary of 84,000, which is 15% higherthan the national median of 72,830. About one-third (31%) of supply chain professionals have a graduate degree and earn a mediansalary of 108,000. 108,000Graduate degree (MBA, MA, MS) 84,000Undergraduate degree (BA, BS) 66,811Associate degree
15 2022 Supply Chain Salary and Career ReportAreas of StudyUndergraduate studiesGraduate studiesSupply chain degrees continue to become more common with students today.At the graduate level, the MBA is most common among supply chain professionalsTypical areas of study for supply chain professionals include supply chain, businessover the age of 30. A Master of Science with an emphasis in a supply chain disciplineadministration and engineering. Many survey respondents selected another area ofis much more common among those 29 and under. For those ages 30 to 49, astudy, indicating that a supply chain, business administration or engineering emphasisgraduate supply chain emphasis is more common than for the same age group at theisn’t necessary for a career in supply chain.undergraduate level.Undergraduate area of study by ageGraduate area of 13%27%57%10%24%67%27%29%19%50 and olderSupply chain28%37%36%40-4930-3917%40-4930-39Business administration29 and underEngineeringOther50 and olderSupply chainBusiness administration29 and underOther
16 2022 Supply Chain Salary and Career ReportPaid Time Off and FlexibilityNearly half (48%) of supply chain professionals receive four weeks or more paid time off. In the last year, 20% of respondents reportthat their company increased the number of paid holidays. In addition, two-thirds of supply chain professionals work in a hybrid orpermanent work-from-home setting, demonstrating that many supply chain professionals do not need to be on-site.Weeks of paid time offWork setting2%17%34% 33% 33%21%On-site full time1 week or less2 weeks33%27%3 weeks4 weeks5 weeks or moreHybridRemote full time
17 2022 Supply Chain Salary and Career ReportThe Great Resignation(Not So “Great” in Supply Chain)Amid the stories of people leaving their jobs in droves, supply chain professionals experienced low turnover. About 14% of thosesurveyed got a new job, up only 2% from the previous year. Supply chain professionals also report that their organizations generallyhave a good culture and work-life balance, which could explain the phenomenon.Company cultureI am not expected to check email outside of work hours41%25%34%My job provides a good work-life balance60%23%24%17%16%40%81%20%67%Better work-life balanceMy work arrangements are flexible79% 12% 9%AgreeI like the culture of my company or organization64%Length of job searchesHigher salaryI am encouraged to take vacation and recharge60%Reasons for getting a new job18%15%DisagreeNeutral20%More flexible workarrangementsof new graduates found theirfirst job in three months or less.of working professionals founda job within three months ofbeginning their search
18 2022 Supply Chain Salary and Career ReportCareer SatisfactionDespite a constant stream of disruptions and a volatile job market, 2021 careersatisfaction remained consistent with the data from previous years.Satisfaction with supply chain fieldLikelihood to recommend supply chain as a careerVery satisfiedVery likely20%26%18%17%30%25%18%16%7%6%5%5%2%2%1%Not at all satisfied1%0.23%0.54%0.54%0.77%Not at all likely
19 2022 Supply Chain Salary and Career ReportTechnical and Leadership SkillsTechnical supply chain skills have remained relatively consistent over the last few years , with knowledge of best practices, inventorymanagement and project management being most important.On the leadership skills side, time management made its way to the top five in 2021, likely because of the number of professionalsworking from home and balancing various priorities.Top five technical skills160%Best ctmanagement440%Riskmanagement525%Technology expertisein AI, IOT and roboticsTop five leadership -picture planning428%Troubleshooting andproblem-solving524%Timemanagement
20 2022 Supply Chain Salary and Career ReportProfessional Development Pays OffThis year’s data continues to show that employers value those who seek continuing education. A supply chain professional with atleast one credential can expect a 17% higher salary than those without. Those with two or more credentials enjoy an even larger gain,at 46% more than the median salary.Salary by number of certifications 135,750 111,860 109,500 61,578 70,200 83,62525th percentileNo certification 75,000 87,52450th percentile1 certification2 or more certifications 100,00075th percentile
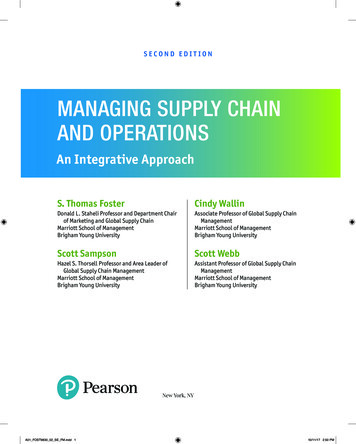
21 2022 Supply Chain Salary and Career ReportThe Value of APICS CertificationsCPIMCSCPCLTDhigher salaryhigher salaryhigher salary23% 40% 25%Employers place great value on APICS certification. Supply chain professionals who hold an APICSCertified in Planning and Inventory Management (CPIM); Certified Supply Chain Professional (CSCP);or Certified in Logistics, Transportation and Distribution (CLTD) designation earn more than thosewho do not have a certification. People who hold at least one APICS certification report a mediansalary of 94,000, which is 25% higher than those without.Salary by APICS certification 136,000 120,000 105,000 81,535 75,000 75,500 61,57825th percentileNo certification 92,000CSCPCLTD 100,000 75,00050th percentileCPIM 96,00075th percentile 118,500
22 2022 Supply Chain Salary and Career ReportAPICS Certification Augments a DegreeWhile one can obtain key industry knowledge with an undergraduate degree in supply chain, earning an APICS certificationtakes professionals to the next level. When comparing all respondents with a supply chain degree, those who also hold an APICScertification report a median salary 18% higher than those without.Salaries of supply chain degree holders with and withoutAPICS certification 114,125 87,500 73,000 94,125 74,250 61,00025th percentileAt least one APICS certification50th percentileNo APICS certification75th percentile
Canada
24 2022 Canada Supply Chain Salary and Career ReportSupply Chain Salaries in CanadaThe median total compensation package in Canada is 89,460 CAD. The majority of respondents report a salary increase in 2021, with72% receiving an average increase of 8.7%. The majority of respondents report a salary increase of 2%. Most of those surveyed stayedwith their employer, but 14% got a new job. Of the respondents who found new employment, 41% were motivated by a salary increaseand 16% sought a better work-life balance. More than half (65%) of respondents were able to find their current job within three monthsof beginning their search.Supply chain salariesNature of salary increase: 123,48035%33%15%14%Good performancereview 89,460 66,925Promotion withinthe same company25th percentileBase salary50th percentileBonus75th percentileCost of livingincreaseEmployment with anew company
25 2022 Canada Supply Chain Salary and Career ReportWork-Life Balance in CanadaMost respondents (80%) work a maximum of 45 hours per week, while 8% work more than 50 hours. Supply chain professionalhappiness is evident, with 95% of respondents indicating that they are likely to stay in supply chain during the next five years.Canada has a mandated two-week minimum of vacation for all employees. Less than one-quarter (16%) receive the minimum. Mostof those surveyed enjoy at least three weeks of paid time off.One-third of survey respondents have returned to the office five days a week.Weeks of paid time off34%16%70%On-site full time14%2-week minimum3-4 weeks5 weeks or more34%Hybrid32%Remote full time
26 2022 Canada Supply Chain Salary and Career ReportSalary by Education Level in CanadaThe highest degree obtained by respondents is a bachelor’s degree (42%), followed by a master’s degree (29%). It should be noted that80% of respondents have an APICS certification or Supply Chain Management Professional (SCMP) designation. Considering this,even those who have an associate degree earn more than the average salary in Canada. Although supply chain is not often studied atthe undergraduate level, it was the area of emphasis for almost half of the respondents at the graduate level.Salary by education level 92,190 89,027Most common undergraduate areas of study1 SupplychainMost common graduate areas of study1Graduate degreeUndergraduate degreeAssociate Engineering
Europe
28 2022 Europe Supply Chain Salary and Career ReportSupply Chain Salaries in EuropeThe median total compensation in Europe is 64,868, with the greatest compensation being 95,895.Supply chain salariesSalary increases 95,895A majority (68%) of respondents report a salary increase. While the average increasewas around 10%, most supply chain professionals in Europe received an increase ofaround 3%. Similar to the U.S. data, the number of respondents reporting a new job wassurprisingly low during the Great Resignation. 64,868Nature of salary increase: 46,59736%29%21%10%Good performancereview50th percentile25th percentileBase salaryBonus75th percentilePromotion within thesame companyCost of livingincreaseEmployment with anew company
29 2022 Europe Supply Chain Salary and Career ReportWork-Life Balance in EuropeIn Europe, 72% of respondents work 35-45 hours per week. This is in stark contrast to the United States, where 59% report working 3545 hours per week and 15% work more than 50 hours. In addition, 79% of European respondents receive at least four weeks of vacationtime, versus only 48% of U.S. respondents.Work settings also differ greatly. In Europe, only 14% report that their employer expected them to return to the office five days a weekpost-pandemic versus the United States, where 32% were brought back to the office five days a week. A flexible work setting is alsoenjoyed by 85% of European professionals, either work from home five days a week or a hybrid arrangement.Work culture in EuropeI am not expected to check email outside of work hours55%23%22%My work arrangements are flexibleOn-site full time86%My job provides a good work-life balance57%9%28%5%15%I am encouraged to take vacation and recharge64%AgreeNeutralDisagree14%23%13%52% 33%HybridRemote full time
30 2022 Europe Supply Chain Salary and Career ReportMost Common Areas of Study in EuropeOf European respondents, 69% report their highest degree obtained as a master’s or above. At the undergraduate level, engineeringwas the most common area of the study (29%), followed by supply chain (27%). At the graduate level, supply chain (26%) and businessadministration (26%) were the most common.Undergraduate area of studyGraduate area of studyEngineeringSupply chain management29%Supply chain management26%Business administration27%Business administration26%Engineering24%22%Operations managementOther21%11%Transportation, logistics, or distribution3%Other12%
Appendix
32 2022 Supply Chain Salary and Career ReportSurvey DemographicsPosition levelPosition level of respondentsA significant majority of the sample was at the staff, associate ormanagerial level, with 12% at the director level or above.Staff or associate44%Manager40%DirectorExecutive, president or other C-levelVice president9%2%1%
33 2022 Supply Chain Salary and Career ReportGlobal Median SalariesAustralia115,672 AUDChina360,596 CNYIndia2,253,983 INRMexico974,411 MXNSingapore123,243 SGDSouth Africa2,627,676 ZARUnited Arab Emirates221,068 AED
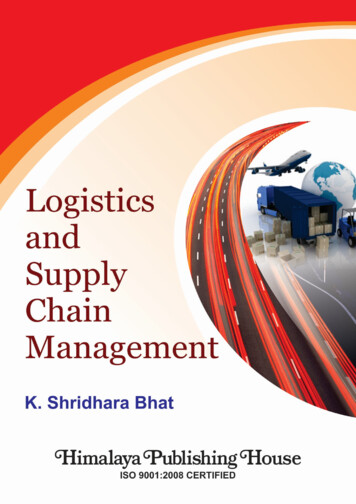
34 2022 Supply Chain Salary and Career ReportAge, Gender and EthnicityThe sample was predominantly male (64%). Six respondents were nonbinary.Most respondents (77%) were ages 30 to 59.Age of respondentsGender of respondentsEthnicity of asiannAsian9%Hispanic/Latinx6%5%4%Black4%20-2960% 16%60 and olderMaleFemaleOther and declined to answer1%Native AmericanDeclined to answerOther
35 2022 Supply Chain Salary and Career ReportCompany CharacteristicsIndustry tenureLess than 1 year1-23-4Company sizeLess than 2503%250-9996%1,000-9,99913%5-928%10-2920 or more yearsYears in the supply chain field32%18%10,000-49,00050,000 or moreNumber of employeesCompany annual revenuesLess than 25 million17%9% 25 to 99.9 million14%24%22%23%14% 100 to 499.9 million 500 to 999.9 million13%8% 1 to 4.9 billion 5 to 9.9 billion16%9% 10 to 49.9 billion 50 billion or more19%12%
36 2022 Supply Chain Salary and Career armaceuticaland erpackaged goodsTransportationand logisticsGovernmentand military28%Industrialand manufacturingOtherCountries representedBelgium11%Italy14%Sweden3%Czech 1%2%5%UK and Northern IrelandHungaryPolandIreland5%Russian Federation2%Other European countries6%Spain3%
Data CollectionAbout ASCMParticipants were initially invited to respond to the survey on January 27, 2022,The Association for Supply Chain Management (ASCM) is the global pacesetter ofand were sent reminders to participate on February 16 and 23. Supply chainorganizational transformation, talent development and supply chain innovation. Asprofessionals also were invited to participate via social media. Per antitrustthe largest association for supply chain, ASCM members and worldwide alliancesguidelines, data collected regarding compensation must be at least three monthsfuel innovation and inspire accountability for resilient, dynamic and sustainableold. Therefore, all respondents were instructed to answer the survey based onoperations. ASCM is built on a foundation of world-class APICS education,their position in the supply chain field in the period between October 15,2020, andcertification and career resources, which encompass award-winning workforceOctober 1, 2021. The survey was closed for tabulation on March 7, 2022 with 2,379development, relevant content, groundbreaking industry standards and a diverseusable responses from the United States. Worldwide, there was a total of 3,489community of professionals who are driven to create a better world throughusable responses. A global summary can be found in a separate report. The marginsupply chain.of error for percentages based on usable responses is 2% percentage pointsat the 95% confidence level. Percentages may not add to 100 for single-answerquestions because of rounding or non-response.For more information, visit ascm.org 2022 ASCM/APICS. All rights reserved. SCOR is a registered trademark
the gap was 9% with private firms. At public firms, women report salaries 4% higher than men; at private firms, the gap is 11% in favor of men. Salary by race and ethnicity: public versus private Salary by gender: public versus private Black Hispanic/Latinx White Men Women 92,000 85,000 86,450 88,500 78,000 96,000 77,719