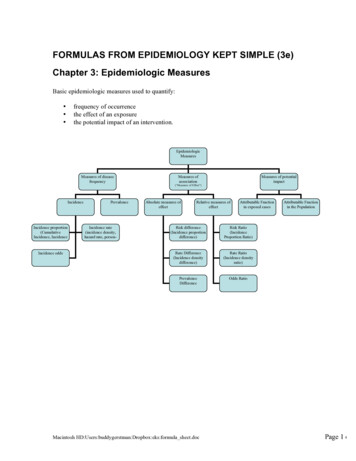
Transcription
CHAPTER 3PREVALENCE AND INCIDENCE OFTYPE 2 DIABETES AND PREDIABETESCatherine C. Cowie, PhD, MPH, Sarah Stark Casagrande, PhD, and Linda S. Geiss, MADr. Catherine C. Cowie is Senior Advisor and Director of the Diabetes Epidemiology Program, National Institute of Diabetes and Digestiveand Kidney Diseases, National Institutes of Health, Bethesda, MD. Dr. Sarah Stark Casagrande is Senior Research Analyst at Social &Scientific Systems, Inc., Silver Spring, MD. Ms. Linda S. Geiss is Team Leader, Diabetes Surveillance, Centers for Disease Control andPrevention, Atlanta, GA.SUMMARYDiabetes is a common condition in the United States and worldwide, associated with multiple complications and early mortality thatresult in costly use of health resources and lost productivity. This chapter reviews the prevalence and incidence of type 2 diabetes interms of diagnosed and undiagnosed diabetes, as well as prediabetes. Variations in estimates are illustrated by age, sex, race/ethnicity,and over time.Data come primarily from analyses of two national health surveys: the National Health Interview Surveys (NHIS) 2011–2015, whichinclude only an interview; and the National Health and Nutrition Examination Surveys (NHANES) 2011–2014, which include an interviewand blood draw to detect undiagnosed diabetes by glycosylated hemoglobin (A1c), fasting plasma glucose (FPG), and/or 2-hour plasmaglucose (2-hour PG) from an oral glucose tolerance test. While these data do not distinguish type 1 from type 2 diabetes, an estimated90%–95% are from persons with type 2 diabetes. Data from the literature are used to describe type 2 diabetes in adolescents, Hispanicand Asian subgroups, and American Indians.Crude overall prevalence of diagnosed diabetes based on the NHIS 2011–2015 was 9.5% in adults age 20 years, translating to 21.8million in the U.S. civilian noninstitutionalized population. Prevalence increased with age, ranging from 0.5% in youth age 12–19 yearsto about 20% in those age 65 years. Age-standardized prevalence was somewhat higher in adult men than women. Age- and sex-standardized prevalence was highest in non-Hispanic American Indian/Alaska Native adults (19.1%) and lowest in non-Hispanic whites (8.2%),with prevalences between these in non-Hispanic blacks, all Hispanics, and non-Hispanic Asians. Variability in prevalence was foundacross Hispanic and Asian subgroups. Prevalence of validated type 2 diabetes in adolescents age 10–19 years based on the SEARCH forDiabetes in Youth Study was 0.46 per 1,000 in 2009, which varied by age, sex, and race/ethnicity.Crude overall prevalence of undiagnosed diabetes in adults 20 years based on the NHANES 2011–2014 was 2.9% as detected byA1c/FPG; and when combined with diagnosed diabetes (9.6%), total diabetes prevalence was 12.5% or 28.2 million in the U.S. civiliannoninstitutionalized population. Undiagnosed diabetes of 5.0% by A1c/FPG/2-hour PG resulted in total diabetes of 14.6% or 33.0 million.Prevalence of undiagnosed and total diabetes rose with age. The percent of total diabetes that was undiagnosed was highest (33.4%–41.5%) at age 20–44 years. Standardized prevalence of undiagnosed diabetes and total diabetes tended to be higher in men thanwomen, as was the percent of total diabetes that was undiagnosed. Standardized prevalence of undiagnosed diabetes, total diabetes,and the percent of total diabetes that was undiagnosed were highest in non-Hispanic Asians and lowest in non-Hispanic whites, withprevalences for non-Hispanic blacks, all Hispanics, and Mexican Americans in between.Crude overall incidence of diagnosed diabetes based on the NHIS 2012 was 7.4 per 1,000 adults age 20–79 years. Incidence increasedto age 65–74 years and then declined. It was higher in women than men, highest in Hispanics, followed by non-Hispanic blacks, andlowest in non-Hispanic whites.Over time, crude prevalence of diagnosed diabetes among all ages based on the NHIS has risen from 0.93% in 1958 to 7.40% in2015. In adults age 20–74 years during 1980–2012, both age-adjusted prevalence and incidence rose particularly fast during1990–2008, but may be leveling off or decreasing since 2008. Other data sources have corroborated this finding. An analysis of theNHANES during 1988–2012 found standardized prevalence of total diabetes increased across all subgroups of the U.S. population,due to an increase in diagnosed diabetes, while undiagnosed diabetes remained relatively constant. Both prevalence and incidenceof type 2 diabetes in adolescents based on SEARCH have continued to increase significantly since the early 2000s across all age,sex, and race/ethnicity groups.Received in final form April 5, 2018.3–1
DIABETES IN AMERICA, 3rd EditionCrude overall prevalence of prediabetes in adults age 20 years based on the NHANES 2011–2014 was 34.4% (77.9 million) by A1c/FPGand 36.9% (83.6 million) by A1c/FPG/2-hour PG. Prevalence of prediabetes rose with age. Standardized prevalence was significantlyhigher in men than women; and prevalences were higher in non-Hispanic blacks, all Hispanics, and Mexican Americans comparedto non-Hispanic whites and non-Hispanic Asians. Prediabetes prevalence was fairly constant during 1999–2006, but significantlyincreased during 2007–2010.Diabetes remains a very prevalent condition, especially in American Indians, non-Hispanic blacks, and Hispanic groups. The long-termtrend showing a persistent rise in occurrence, though a slowing in more recent years, needs continued surveillance. The fact thatone-quarter to one-third of diabetes is undiagnosed and that another third of the total population has prediabetes emphasizes the importance of sustained monitoring and improvements in health care delivery.INTRODUCTIONDiabetes is one of the most commonchronic diseases in the United Statesand worldwide, associated with themyriad complications presentedthroughout this compendium, resultingin increased disability, physicianoffice visits and hospitalizationrates, premature mortality, and costsamounting to 327 billion in 2017 dueto health care and lost productivity(1). Understanding the magnitudeof diabetes occurrence in the U.S.population, and in subgroups in whichthere is a particularly high burden,is the foundation for facilitatingfurther research on risk factor andintervention investigations, as well ashealth care planning.This chapter reviews the prevalenceand incidence of type 2 diabetes interms of diagnosed, undiagnosed, andtotal diabetes; prediabetes; and totaldysglycemia. Variations in estimatesare illustrated by age, sex, and race/ethnicity, with additional focus on certainHispanic and Asian subgroups. Type 2diabetes in adolescents is also presented.The different criteria for detectingundiagnosed diabetes (glycosylatedhemoglobin [A1c], fasting plasma glucose[FPG], and 2-hour plasma glucose [2-hourPG] from an oral glucose tolerance test[OGTT]) are compared. Prevalence ofdiagnosed diabetes is also comparedacross two national health surveysfrequently used in its reporting. Trendsover time in these estimates are shown bydemographic factors and by county.The national health survey data do notdistinguish between type 1 and type 2diabetes with precision, as antibody andC-peptide data at the time of diabetesdiagnosis are not available; data are notvalidated by physician diagnosis. The vastmajority (90%–95%) of diabetes in thesesurveys, however, is estimated to betype 2 (2). Some data from other sourcesthat are presented from the scientificliterature have validated type 2 diabetesbased on physician report. For a detaileddiscussion on classification of diabetes,please refer to Chapter 1 Classificationand Diagnosis of Diabetes.DATA SOURCES AND LIMITATIONSTwo national health surveys with publiclyaccessible data were analyzed forDiabetes in America, 3rd edition, and arethe main data sources for this chapter.Published studies from the scientificliterature are also described to fill indata gaps; details of these studies aredescribed in the main text.on active duty with the Armed Forces,persons incarcerated in the prisonsystem, and U.S. nationals living in foreigncountries. The NHIS sample is drawn fromhouseholds in each State and the Districtof Columbia using a stratified, multistage,probability sample design. The NHIS designand methods have been described (3).NATIONAL HEALTH INTERVIEWSURVEYThe National Health Interview Survey(NHIS) is a cross-sectional householdinterview survey of a representative sampleof the U.S. civilian, noninstitutionalizedpopulation that has been conductedannually since 1957 to obtain data onthe health of the nation. Because of thetechnical and logistical problems, thesurvey does not include institutionalizedpersons in long-term care facilities, thoseThe data used for the analyses from theNHIS in this chapter are from 2011–2015. Non-Hispanic blacks, Hispanics,non-Hispanic Asians, and older personsage 65 years were oversampled toobtain more precise estimates for thesegroups. During 2011–2015, approximately33,000–37,000 individuals age 18years and 12,000–14,000 age 18 yearswere sampled. Response rates during2011–2015 ranged from 55.2% to 74.6%and were adjusted for nonresponse (4).3–2Interview sample weights were appliedto provide representative estimatesof the U.S. civilian noninstitutionalizedpopulation, and variance estimationaccounted for the complex survey design.The NHIS personal household interviewincludes a core questionnaire that remainslargely unchanged over successiveyears, enabling trends analysis and datapooling to increase sample size, and asupplemental questionnaire about currenthealth topics. In the core questionnaire,persons are asked about the presence orabsence of specific chronic conditions. Toidentify people with diagnosed diabetes,respondents were asked “(Other thanduring pregnancy for females), Have youever been told by a doctor or other healthprofessional that you have diabetes orsugar diabetes?” If the response was
Prevalence and Incidence of Type 2 Diabetes and Prediabetes“yes,” the person was classified as havingdiagnosed diabetes. All other data wereself-reported, including race/ethnicity.Self-reported physician-diagnoseddiabetes may under- or overestimatetrue prevalence of diagnosed diabetes;several reports, however, have found selfreport to have high validity (5,6,7). Sincediabetes was only based on interviewinformation, some persons were classifiedas not having diabetes when in fact theyhad undiagnosed diabetes; as much asone-quarter to more than one-third of alldiabetes may be undiagnosed (8). It is notpossible to differentiate type of diabeteswith precision in the NHIS based onavailable data, and there was no attemptto do so in this chapter; however, thevast majority (90%–95%) of diagnoseddiabetes is estimated to be type 2 (2).NATIONAL HEALTH AND NUTRITIONEXAMINATION SURVEYThe National Health and NutritionExamination Survey (NHANES) is anongoing cross-sectional, stratified,multistage, probability sample ofthe U.S. civilian, noninstitutionalizedpopulation. It is the only national healthsurvey with both interview and physicalexamination components to ascertainhealth conditions. Currently, theNHANES samples approximately 5,000individuals of all ages from householdsin 15 locations of the United States eachyear. Certain groups, such as minority,elderly, and adolescent populations areoversampled to provide more preciseestimates in these groups. In-homeinterviews are followed by physicalexaminations and laboratory tests inmobile examination centers. For 2011–2014, the most recent years availableat the time of analysis for Diabetes inAmerica, response rates of the screenedsample were 71%–73% for the interviewand 69%–70% for the examination (9).Nonresponse adjustment is applied toyield representative estimates. Data arereleased in 2-year cycles. Survey designand methods have been described (10).The NHANES identifies race/ethnicitybased on self-report in the interview.Diagnosed diabetes is ascertained inthe interview based on an affirmativeresponse to “(Other than duringpregnancy, if female) . . . Have you everbeen told by a doctor or other healthprofessional that you have diabetes orsugar diabetes?” In persons withoutdiagnosed diabetes, undiagnoseddiabetes was determined by measurementof A1c 6.5% ( 48 mmol/mol) in thosewith a physical examination, or by FPG 126 mg/dL ( 7.0 mmol/L) in thoserandomly assigned to the morning samplewho fasted 8– 24 hours, or by a 2-hourPG 200 mg/dL ( 11.1 mmol/L) froman OGTT with a 75 gram oral glucosechallenge (Trutol) and a venipuncture2 hours ( 15 minutes) later in thosein the morning sample. In personswithout diagnosed or undiagnoseddiabetes, prediabetes was defined byA1c 5.7%–6.4% (39–46 mmol/mol), FPG100–125 mg/dL (5.6–6.9 mmol/L), or2-hour PG 140–199 mg/dL (7.8–11.0mmol/L). These criteria cutpoints arerecommended by the American DiabetesAssociation (ADA) (11). Pregnant womenwere included; only one woman wasfound to have undiagnosed diabetesbased on elevated A1c and 2-hourPG, and she may have had gestationaldiabetes. NHANES-recommended glucosecorrections were used (12,13,14,15,16,17).Sample weighted estimates includedinterview weights for diagnosed diabetes;examination weights for undiagnoseddiabetes and prediabetes identified byA1c; and fasting or OGTT weights forundiagnosed diabetes, prediabetes, orno diabetes identified by FPG or 2-hourPG; this procedure maximizes the useof survey information and sample sizes.Variance estimation accounted for thecomplex survey design.Undiagnosed diabetes was defined eitherby two markers of elevated A1c or FPGor by three markers of elevated A1c orFPG or 2-hour PG, in order to provide acomprehensive assessment of diabetesin the U.S. civilian noninstitutionalizedpopulation. Both definitions were alsoused for assessing the magnitude ofprediabetes prevalence. The use of any ofthe three criteria is recommended by theADA (11). A1c and FPG are more frequentlyused in clinical practice to assessdiabetes/prediabetes because of ease ofmeasurement and less burden and time/cost for physicians and patients. While lessfrequently used in clinical practice, 2-hourPG from an OGTT also detects additionalundiagnosed diabetes, which adds tooverall diabetes prevalence (18).Diagnosed diabetes and undiagnoseddiabetes were combined to estimate totaldiabetes in the general population. Inaddition, the proportion of diabetes thatwas undiagnosed is reported, using thetotal diabetic population as a denominator.Estimates of self-reported prediabetesprevalence are not provided in this chapter,although the NHANES queries participantson whether they were ever told they haveprediabetes, impaired fasting glucose (IFG),impaired glucose tolerance, borderlinediabetes, or higher than normal glucosebut not high enough to be called diabetesor sugar diabetes. Only a small proportionof individuals are aware of havingprediabetes; among those testing positivefor prediabetes by FPG or a 2-hour PG inthe NHANES 2005–2006, only 7.3% selfreported having been told (19). Definingprediabetes based on elevated A1c, FPG,or 2-hour PG levels captures the conditionas currently defined.The NHANES is unique for nationalsurveys because of its examinationcomponent that allows undiagnoseddiabetes to be ascertained, in additionto collecting self-reported physiciandiagnosed diabetes. As mentioned for theNHIS in the previous section, althoughself-reported diagnosed diabetes maynot represent true prevalence, literaturehas shown such reports to have highvalidity. Detection of undiagnoseddiabetes in the NHANES is based on asingle blood sample assessment for A1cand plasma glucose and does not includea repeat blood draw and assessmentfor confirmation, as recommendedby the ADA (11), which could lead tooverestimation of undiagnosed diabetesprevalence since it is not confirmed(20,21). The NHANES does not distinguish3–3
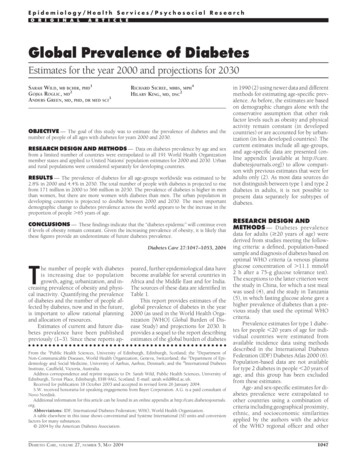
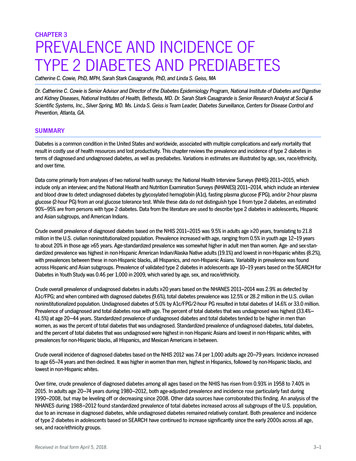
DIABETES IN AMERICA, 3rd Editiontype 1 from type 2 diabetes; however, asdescribed above, almost all is expected tobe type 2.ANALYTIC CONSIDERATIONS INUSING THE NHIS AND NHANESBoth the NHIS and NHANES use complexsurvey designs that oversample certaingroups of the U.S. population to providemore precise estimates in these groups,requiring sample weighting of prevalenceestimates. Absolute numbers ofindividuals with diabetes were calculatedfrom weighted prevalence estimatesapplied to the respective NHIS andNHANES samples, to represent millionsof the U.S. civilian noninstitutionalizedpopulation. Standard errors wereestimated using SUDAAN (Release 11.0.0)(22), which accounts for the clusteredsample design.FPG/2-hour PG definition compared to theA1c/FPG definition. This occurred from acombination of two reasons: the first dueto some sample persons being classifiedas having prediabetes by A1c/FPG, buthaving diabetes by OGTT, making themineligible to have prediabetes usingthe three-marker definition, and thesecond due to comparing two somewhatdifferent subsamples (fasting vs. OGTTsubsamples). In addition, estimates ofTotal Diabetes and Total Dysglycemiamay not reflect the sum of their partsdue, first, to rounding, and second, tosmall differences in the fasting and OGTTsubsamples used to estimate the variouscomponents.Relative standard errors (RSEs) are notedin the figures and appendices, if estimateshad limited statistical precision due tosmall sample sizes. Estimates with RSE 30%–50% should be considered withcaution, and those with an RSE 50%have been suppressed. Standard errorsand 95% confidence intervals (CI) forestimates have also been provided. Allcomparisons of interest were tested forstatistical significance using large samplet-tests based on a level of p 0.05.Estimated prediabetes prevalence in theNHANES was somewhat lower in someolder age groups based on the A1c/PREVALENCE OF DIAGNOSED DIABETESPREVALENCE BY AGECrude prevalence of diagnosed diabetesduring 2011–2015 increased significantlywith age but plateaued in older age groups.Prevalence was 0.5% in youth age 12–19years and was 2.6% in adults age 20–44years, rising to 21.5% in those age 65–74years, which was similar to prevalence inadults age 75 years (19.9%), althoughthe difference was statistically significant(Figure 3.1, Appendix 3.1). Prevalence was20.8% in all adults age 65 years.Prevalence estimates of diagnoseddiabetes in youth based on data from theNHIS contain a mixture of both type 1and type 2 diabetes. The SEARCH forDiabetes in Youth study aims to describethe magnitude of diabetes, separatelyfor type 1 and type 2, in youth age 20years. SEARCH data were collected from3–4four geographic areas (Colorado [from all64 counties], Ohio [from eight counties],South Carolina [from all 46 counties], andWashington state [from five counties]) andone managed health care plan located inCalifornia (Kaiser Permanente SouthernCalifornia health plan in seven counties), with additional data from selectedAmerican Indian reservations in Arizonaand New Mexico. Networks of pediatricand adult endocrinologists and other clinicians, hospitals, and health plans in thestudy areas were used. Data from identified patients were validated by verifyingthe diagnosis and type of diabetes witha physician. As reported by Dabelea et al.(23), overall prevalence (per 1,000 generalpopulation) in 2009 of type 2 diabetesin youth age 10–19 years was 0.46 andwas lower in youth age 10–14 years(0.23) than in those age 15–19 years(0.68) (Table 3.1). Prevalence of type 1diabetes in youth is described in Chapter2 Prevalence and Incidence of Type 1Diabetes Among Children and Adults inthe United States and Comparison WithNon-U.S. Countries and also in Chapter 15Diabetes in Youth.FIGURE 3.1. Crude Prevalence of Diagnosed Diabetes by Age and Sex, U.S., 2011–2015Both sexes30Diagnosed diabetes (%)OVERALLData from the NHIS 2011–2015 wereanalyzed for Diabetes in Americato present prevalence of diagnoseddiabetes. Crude overall prevalence ofdiagnosed diabetes was 9.5% for adultsage 20 years, translating to 21.8million (95% CI 21.3–22.3 million) adultswith diagnosed diabetes in the U.S.civilian noninstitutionalized population(Appendix 3.1).MaleFemale2010012–1920–4445–64Age (Years)65–74 75Diagnosed diabetes is based on self-report. Error bars represent 95% confidence intervals. See Appendix 3.1 forfurther details.SOURCE: National Health Interview Surveys 2011–2015
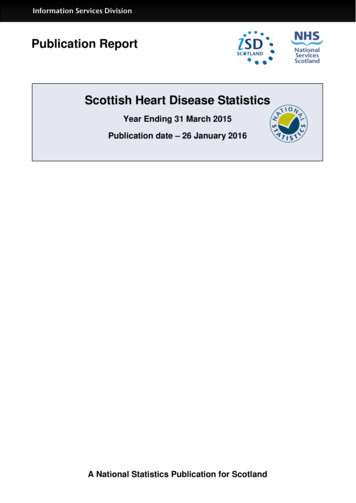
Prevalence and Incidence of Type 2 Diabetes and PrediabetesTABLE 3.1. Prevalence of Type 2 Diabetes Per 1,000 Youth Age 10–19 Years byDemographic Characteristics, 2009NUMBER OF YOUTHCHARACTERISTICSCases With DiabetesGeneral PopulationPREVALENCEPER 1,000 (95% CI)8191,781,2600.46 (0.43–0.49)198621867,403913,8570.23 (0.20–0.26)0.68 (0.63–0.74)314505909,795871,4650.35 (0.31–0.39)0.58 ,45562,5730.17 (0.15–0.20)1.06 (0.93–1.22)0.79 (0.70–0.88)0.34 (0.26–0.46)1.20 (0.96–1.51)TotalAge hiteBlackHispanicAsian Pacific IslanderAmerican IndianData were from four U.S. geographic areas (Colorado, Ohio, South Carolina, and Washington state), one managedhealth care plan in California, and selected American Indian reservations in Arizona and New Mexico. CI, confidenceinterval.* Age on December 31, 2009SOURCE: Adapted from Reference 23, reproduced with permission, copyright 2014 American MedicalAssociation. All rights reserved.FIGURE 3.2. Age- or Age/Sex-Standardized Prevalence of Diagnosed Diabetes in AdultsAge 20 Years, by Sex and Race/Ethnicity, U.S., 2011–2015Diagnosed diabetes (%)30TotalHispanicNon-Hispanic whiteNon-Hispanic AsianNon-Hispanic blackNon-Hispanic AI/AN20100Both SexesMenWomenDiagnosed diabetes is based on self-report. For Both Sexes, data are standardized to the NHIS 2011–2015 totalpopulation by age and sex using age groups 20–44, 45–64, and 65 years. For Men and Women, data are standardized to the NHIS 2011–2015 total population by age using age groups 20–44, 45–64, and 65 years. Error barsrepresent 95% confidence intervals. See Appendix 3.2 for further details. AI/AN, American Indian/Alaska Native.SOURCE: National Health Interview Surveys 2011–2015PREVALENCE BY SEXOverall age-standardized prevalenceof diagnosed diabetes based on datafrom the NHIS during 2011–2015 inadults age 20 years was minimallyhigher in men (10.1%) than in women(9.0%) (Appendix 3.2); the prevalenceswere statistically different. Prevalencesby sex were similar at young ages,but prevalence became higher inmen than in women beginning at age45–64 years (13.2% vs. 11.5%) withdifferences widening even further atages 65–74 (22.9% vs. 20.2%) and 75 (22.3% vs. 18.3%) years and allwere statistically different (Figure 3.1,Appendix 3.1). Prevalence by sex fromthe NHIS is also described for certainrace/ethnicity groups in the sectionPrevalence by Race/Ethnicity.Based on data from SEARCH foryouth age 10–19 years in 2009,the prevalence (per 1,000 generalpopulation) of type 2 diabetes wassignificantly higher in females (0.58)than in males (0.35) (Table 3.1) (23).PREVALENCE BY RACE/ETHNICITYOverall age-standardized prevalenceof diagnosed diabetes based on datafrom the NHIS during 2011–2015 wassignificantly higher in non-HispanicAmerican Indian/Alaska Native adultsage 20 years (19.1%) than all otherrace/ethnicity groups; this was followedby similar prevalences in non-Hispanicblacks (14.2%) and Hispanics (13.5%)which were significantly higher than thatin non-Hispanic Asians (9.3%), whichwas in turn somewhat higher than that innon-Hispanic whites (8.2%) (Figure 3.2,Appendix 3.2). Race/ethnicity patternswere very similar by sex, although therewas a statistically higher prevalence innon-Hispanic Asian men (10.4%) thanwomen (8.3%).Race/ethnicity patterns of crudeprevalence across age groups were similarto overall prevalence patterns describedin the previous paragraph. In all race/ethnicity groups, prevalence rose withincreasing age (Figure 3.3) but generallyplateaued in race/ethnicity groupsbetween 65–74 years and 75 years.Prevalences reached a high at age 65–74years of 18.8% for non-Hispanic whites, of31.5% for non-Hispanic blacks, of 33.2%for Hispanics; at both ages 65–74 and 75 years of 22.5% for non-HispanicAsians; and at age 75 years of 45.2% fornon-Hispanic American Indians/AlaskaNatives (Figure 3.3, Appendix 3.1).Race/ethnicity patterns of prevalenceamong youth age 10–19 years in 2009from SEARCH were similar to thosefound in the NHIS. American Indianshad the highest prevalence (1.20 per1,000 general population), which was notsignificantly different than that in blacks(1.06), followed by successive significantlylower prevalences in Hispanics (0.79),Asian Pacific Islanders (0.34), and whites(0.17) (Table 3.1) (23).Although 5 years of data were usedto present NHIS estimates in order to3–5
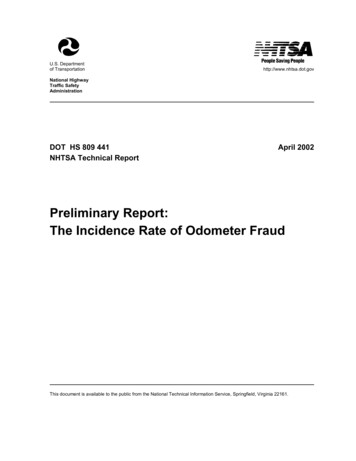
DIABETES IN AMERICA, 3rd EditionFIGURE 3.3. Crude Prevalence of Diagnosed Diabetes by Age and Race/Ethnicity, U.S., 2011–2015Non-Hispanic whiteNon-Hispanic blackHispanicNon-Hispanic AsianNon-Hispanic AI/ANDiagnosed diabetes (%)7060504030201001120–4412–1945–64Age (Years)65–74 75Diagnosed diabetes is based on self-report. Error bars represent 95% confidence intervals. See Appendix 3.1 for further details. AI/AN, American Indian/Alaska Native.1 Estimate is too unreliable to present; relative standard error 50%.SOURCE: National Health Interview Surveys 2011–2015FIGURE 3.4. Age- or Age/Sex-Standardized Prevalence of Diagnosed Diabetes in AdultsAge 20 Years, by Sex and Hispanic Ethnicity, U.S., 2011–2015Mexican AmericanPuerto RicanCubanCentral/South AmericanDiagnosed diabetes (%)20100Both SexesMenWomenDiagnosed diabetes is based on self-report. For Both Sexes, data are standardized to the NHIS 2011–2015 totalpopulation by age and sex using age groups 20–44, 45–64, and 65 years. For Men and Women, data are standardized to the NHIS 2011–2015 total population by age using age groups 20–44, 45–64, and 65 years. Error barsrepresent 95% confidence intervals. See Appendix 3.2 for further details.SOURCE: National Health Interview Surveys 2011–2015provide larger sample size, the sample sizefor non-Hispanic American Indians/AlaskaNatives is relatively small. This is indicatedby the larger standard errors and widerconfidence intervals for estimates in thisgroup compared to other race/ethnicitygroups in Appendix 3.1. Another source ofdata is the Indian Health Service NationalData Warehouse (IHS NDW), a systemthat includes patient registration andencounter data that are received fromIHS facilities, tribally operated programs,and urban and contract health systems.In 2015, these health care facilitiesserved about 2.2 million American Indian/3–6Alaska Native people belonging to 567federally recognized tribes in 36 states.Patients age 18 years with diabeteswere ascertained by having at least twovisits to a health care facilitiy in 2015. Theage-standardized prevalence of diagnoseddiabetes in American Indians/AlaskaNatives was 15.1% (95% CI 15.0%–15.2%)and was slightly lower in men (14.9%, 95%CI 14.8%–15.0%) than in women (15.3%,95% CI 15.2%–15.3%). The estimates werestandardized to the 2000 U.S. Censusstandard population. Although theseestimates are lower than those from theNHIS, it must be emphasized that theNHIS and IHS NDW employ differentmethods (2).Prevalence by Hispanic EthnicityOverall age-standardized prevalence ofdiagnosed diabetes from the NHIS during2011–2015 among adults age 20 yearswas examined by Hispanic ethnicitysubgroup (Figure 3.4, Appendix 3.2).Prevalences were highest among MexicanAmericans (15.2%) and Puerto Ricans(14.5%), which were significantly higherthan the prevalences among Cubans(9.4%) and Central/South Americans(9.3%). These same Hispanic ethnicitypatterns were found separately by sex,except prevalence was significantly higherin Cuban men (12.5%) than women (6.5%).Prevalence of diagnosed diabetes rosewith age in all Hispanic ethnic groups butdeclined somewhat at age 75 years inMexican Americans and Puerto Ricans,while rising somewhat in this age groupin Cubans and Central/South Americans(Figure 3.5, Appendix 3.1). Prevalencereached a high of 37.9% in MexicanAmericans and 32.6% in Puerto Ricansat age 65–74 years and a high of 27.2%in Central/South Americans and 22.6%in Cubans at age 75 years. The higherprevalences of diagnosed diabetes inMexican Americans and Puerto Ricansthan in Cubans and Central/SouthAmericans were also found across agegroups. Although this Hispanic ethnicity
Prevalence and Incidence of Type 2 Diabetes and Prediabetespattern by age was sustained, many ofthese differences were not statisticallysignificant.New York; and San Diego, California.Baseline data were collected during2008–2011 in approximately 16,000persons age 18–74 years. Diagnoseddiabetes was ascertained by answeringyes to the question: “Has a doctorever said that you have diabetes (highsugar in blood or urine)?,” with furtherclarification for women whether this wasduring pregnancy only. In an analysis bySchneiderman et al. (24), an additionalcriterion was whether respondents selfreported hypoglycemic medications.In the HCHS/SOL, age-standardizedprevalence of diagnosed diabetes wassimilarly highest in Puerto Ricans (14.7%,Prevalence of diagnosed diabetes byHispanic ethnicity is also availablefrom the Hispanic Community HealthStudy/Study of Latinos (HCHS/SOL), acommunity-based prospective cohortstudy of self-identified Hispanic/Latinopersons age 18–74 years. Participantswere recruited after multistage probabilitysampling of four communities with someof the largest numbers of Hispanics/Latinos in the United States, includingChicago, Illinois; Miami, Florida; Bronx,FIGURE 3.5. Crude Prevalence of Diagnosed Diabetes by Age and Hispanic Ethnicity, U.S.,2011–2015Mexican AmericanPuerto RicanCubanCentral/South AmericanDiagnosed diabetes (%)504030201010112–1920–4445–64Age (Years)65–74 75Diagnosed diabetes is based on self-report. Error bars represent 95% confidence intervals. See Appendix 3.1 forfurther details.1 Estimate is too unreliable to present; r
A1c/FPG; and when combined with diagnosed diabetes (9.6%), total diabetes prevalence was 12.5% or 28.2 million in the U.S. civilian noninstitutionalized population. Undiagnosed diabetes of 5.0% by A1c/FPG/2-hour PG resulted in total diabetes of 14.6% or 33.0 million. Prevalence of undia