Transcription
Date: 29th April, 2021Ref: UTI/AMC/CS/SE/2021-22/067National Stock Exchange of India LimitedExchange Plaza Plot No. C/1G Block Bandra-Kurla ComplexBandra (East) Mumbai – 400 051Scrip Symbol: UTIAMCBSE LimitedPhiroze Jeejeebhoy TowersDalal StreetMumbai – 400 001Scrip Code/Symbol: 543238/UTIAMCSub: Investors PresentationDear Sir/ Madam,Pursuant to Regulation 30 of the SEBI (Listing Obligations and Disclosure Requirements)Regulations, 2015, we are enclosing herewith the Investors Presentation.We request you to kindly take the aforesaid information on record and disseminate the same on yourrespective websites.Thanking you,For UTI Asset Management Company LimitedArvind PatkarCompany Secretary and Compliance OfficerEncl.: As above
UTI Q4 & FY21 Investor PresentationUTI Mutual Fund Private and Confidential April 2021
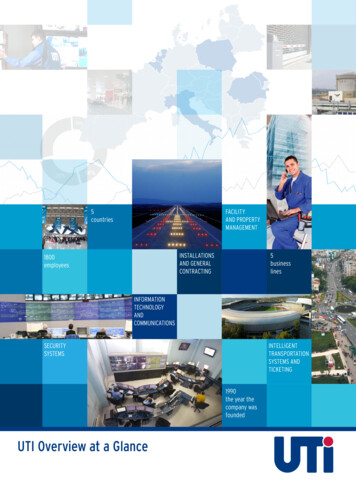
UTI AMC at a glance One of the largest AMCs in India by Total AUM*. Total AUM of INR 11,61,256 Crores Presence across all AUM segments - Mutual Funds, Alternate Investment Funds (AIFs),Retirement Business and Portfolio Management Services Indian AMC with International footprint Established position in International business and retirement solutions Wide distribution network in India, well spread presence through Mutual FundDistributors, Banks, Distributors and Fin-tech Firms, which gives access to investors locatedin 694 out of the 722 districts Strong Penetration in B30 cities with high share, BDA network in existence for nearly 3decades. Professionally managed listed company with no identifiable promoters 2/3rd of Board members are independent directors (6 out of 9).*Total AUM – QAAUM for UTI MF. Closing AUM as of March 31, 2021 for all other business1
Healthy Mix of Shareholders UTI AMC is a professionally managedHealthy mix of shareholdersT. Rowe Price InternationalLtd.1.85%5.36%0.78%Punjab National BankState Bank of IndiaLife Insurance Corporation ofIndiacompany withpromotersRowe Price International Ltd. – aglobal investment management firm isthe largest shareholder15.92% StateRetail Shareholders7.88%Mutual FundsAlternate Investment Funds15.24%Bank of India, Bank of Barodaand Life Insurance Corporation ofIndia divested their stake to below10% and now hold no special rights Punjab9.99%9.99%National Bank, which has noother AMC business, has a 15.24%holding9.99%OthersAs on March 31, 2021identifiable T.23.00%Bank of BarodaForeign Portfolio Investorsno2
Key Performance IndicatorsAssets Under ManagementMF QAAUMINR 11,61,256 CrsINR 1,82,853 CrsINR 9,78,403 CrsNPS AUMMF AUMEquity AUM18.518.5Market Share18.5ProfitabilityFlows & Folios18.5Other AUM Total AUM*28.75%5.69%5.41%RevenueEBITDAPAT37% YoY growth77% YoY growth82% YoY growthGross SalesSIP Gross SalesINR 6,99,908 CrsINR 3,192 CrsLive foliosINR 1.1 Crs*Total AUM – QAAUM for UTI MF. Closing AUM as of March 31, 2021 for all other business Other AUM: total Closing AUM as of March 31, 2021, for all other business except Mutual Funds3
UTI Group
UTI AMC StructureInvestment Manager to UTI Mutual FundUTI AMC Ltd.Support Services to SUUTIInvestment Manager to Offshore Funds100% SubsidiariesPMS (includes EPFO and Postal Life Funds)UTI International Ltd.Manager for International (Offshore) FundsUTI Venture Fund Management Co.Ltd.Manager for Venture FundsUTI Retirement Solutions Ltd.Manager for Pension FundsUTI Capital Pvt. Ltd.Manager for Private Equity & Debt Funds5
Group Assets Under Management have increased by 19% during the FYTotal INR 9,79,847 croresTotal INR 11,61,256 82,8531,66,2107,83,796UTI MFPMSUTI CapitalUTI RSL1,22,2011,51,5136,89,063UTI International Ltd.UTI MFPMSUTI CapitalUTI RSLUTI International Ltd.Domestic MF Business as on 31st March 2021: Equity INR 50,751 Crs, Hybrid INR 22,367 Crs, ETFs & Index INR 42,581 Crs, Income INR24,092 Crs and Liquid INR 43,062 Crs (Total MF AUM: INR 1,82,853 Crs)*Domestic MF Equity includes Equity Hybrid ETFs and Index Funds**Domestic MF Debt includes Income and Liquid Funds6
Better than industry AUM growth leads to higher market shareQUARTERLY AVERAGE AUMINR CroresEQUITY HYBRID QAAUMYoY 20.7%1,51,5131,65,359MAR-20DEC-20YoY 23.6%1,82,853M AR -20MAR-215.60%Source: AMFI, Internal.Dec 205.56%73,11864,94059,156Market Share - Quarterly Average AUMMar 20INR CroresDE C-20M AR -21Market Share – Equity & Hybrid QAAUMMar 21Mar 205.69%5.21%7Dec 205.42%Mar 215.41%
Trend in Net SalesINR CroresTrend in net Yearlysales Net SalesQuarterly Net ,2036,000IncomeLiquid(1,181)2,0009421,804849 1,670 2,436985561473 4292,7111,122(7,750)(14,137)(20,000)(2,000)Equity & Etfs & ,283)FY 8,000)FY 2019-20Source: 08,985Equity & Etfs & IndexHybrid(5,000)(752)(1,418)(10,000)14,000Q4FY21
Key Business FocusPrudent Investment Management PoliciesGeographical Reach Across the CountryFocus on SIP GrowthLeveraging Digital AdoptionGrowth of International, Retirement and Alternate BusinessStrong Financial and Operating metrics9
Prudent Investment Management PoliciesCONTROLPrudent risk management policies Internal & ExternalRisk Identification Stress testing Product development process Risk control self assessment Review MechanismRisk Control t team, RegularCompliance Check,Dedicated RiskManagement Team Equity Research Debt & MacroResearchDECISION MAKING RiskMeasurement Credit risk Market Risk OperationalRisk Liquidity Risk Investment /Product Risk Headed by : EquityHead & FixedIncome Head Fund ManagersFUNDACCOUNTING AccountingValuation & NetAsset Value (NAV) Corporate ActionFollow-up &RecoveryRisk Monitoring ADVISORYDirect reporting toBoard10EXECUTION Equity Dealers, MoneyMarket Dealers Debt Dealers &Primary MarketDealers
Geographical Reach Across the Country163UFCsJ&K1HimachalPradesh1Chandigarh Uttarakhand31Haryana5ArunachalPradesh 2Delhi5Rajasthan10Uttar Pradesh13Assam dhya Pradesh5West Bengal13776Sales hraPradesh7Goa2Kerala556,600Mutual 1
Multi-channel distribution network brings stability of flowsTotal QAAUM(Mar'21)Equity Hybrid QAAUM(Mar'21)9%9%32%29%62%59%Total QAAUM (Dec'20)Equity HybridQAAUM (Dec'20)Total QAAUM ource: RTA Data.Equity HybridQAAUM (Mar'20)Banks & Distributors1260%
Outpacing the Industry in B30 citiesUTI MUTUAL FUNDB3023% Improved awareness about investing in financial products vis a vistraditional investment. Our established presence in B30 cities has enabled us to attract newclients and positions us to capitalize on future growth in thoseunderpenetrated cities.MAAUMMar 21 Network of 163 branches with 106 branches located in B-30 cites as ofMar 31, 2021.T3077%INDUSTRYMAAUMMar 21B3016% Our size and broad distribution network, particularly in B30 cities,provides us with economies of scale, particularly in distribution,marketing, and back-office activities. Our broad client base also provides us with a number of opportunities,including cross-selling different funds. B30 AUM aids our overall margins as these are stickier in nature andoffer comparatively higher margins.T3084%Source: AMFI, RTA Data & Internal.13
SIP to remain the cornerstone for AUM performanceLONG TENURE SIP BOOK (1)90%79% Our SIP AUM increased by Rs.5,930 Crores, or 75.4%, from Rs.7,861 Crores as of March 31,2020 to Rs. 13,791(2) Crores as ofMarch 31, 2021. Increasing the number of SIPselling mutual fund distributorsand their share of wallet is aparticular priority for the salesengagement strategy.INR CroresMORE THAN 5 YEARSMORE THAN 10 YEARSMonthly Gross SIP Inflow (Rs. Crores)247242238240253253253278251Source: RTA Data. (1) As of March 31, 2021(2) SIP folios with four consecutive SIP failure has been excluded.29129014339264
Enabling Business Digitally24x7 Digital Channels- Access at your convenience anytime anywhere- Website utimf.com & Mobile App for Investing, Enquiryand servicing- Conversational Investing, Enquiry & Assistance throughchatbot UNO & WhatsApp Interface- ‘Quick Invest’ (Invest without Login) feature in Websitefor SIP & Lumpsum purchase.Simplifying Life-e-OTM- One-click InvestmentuSAVE- Liquid Account with Insta Redemption featureDigital KYC- Paperless and Contactless KYC processMissed Call services- Folio Enquiry, Call backFlexi Savings Plan- Schedule transactions- ‘Quick Pay’ feature launched for failed or missed SIP andLumpsum transactionsAssisted Journeys integrated- Customer service for Product & Investmentenquiry- Inbound, Outbound & Email support- 24*7 available in 6 languages- ‘Chat with Agent’ service for investorsthrough Chatbot & WhatsApp- Call-back to customers for on-demandAssistance & for failed transactions- Outbound Voice Bot for reminding customersfor pending actionsPartner Enablement- UTI Buddy- Office-on-the-go App and webinterface for MFDs.- Online empanelment of MFDs- Initiate transactions for investors to reduce salescycle. Track AUM, Folio and Market updates- API integrations with Partners and Aggregators.15Building Community- Active engagement on multiple touch points acrossSocial Media channels- UTI Swatantra- Investor Education Initiativehttps://utiswatantra.utimf.com/- Content distribution- Infographics, blog post, videos,eBooks, GIF, surveys chatbot, FAQs etc.- Launched 2 Investor Education campaigns- ELSS (TaxSaving) & Women Investors (Equal Right EqualResponsibilities).Personalized and Contextual Journey- Multi-media marketing platform for Email, SMS, PushNotifications etc.- Delivers relevant content through preferred channel- Consistency in customer experience with personalizedtouch.- Progressive profiling campaigns started for customersegmentation.
Acceptance of digitization reflected in growing online transactionsQuarterly Online Gross Sales as % of Total Gross Sales96.19%95.15%94.91%94.39%JUN - 20SEP - 20DEC - 20MAR - 2173.40%MAR - 20 Number of purchase transactions through Digital grew by 82.4% in Q4FY21 as compared to Q4FY20. Number of digital SIP transactions grew by 167.3% in Q4FY21 as compared to Q4FY20. 52% of total gross sales of Equity & Hybrid funds were mobilized through digital platforms. We envisage using analytical tools and our digital marketing platform to identify and capitalize on cross – sellingand upselling opportunities.16
Steps to increase digital presence are paying offto increase digital presenceFor StepsCustomers Seamless accessibility through app Complete digitally-enabled KYC processare paying offFor Distributors “UTI Buddy” – Mobile app for distributors Introducing new digital training initiatives todevelop new mutual fund distributors, including aprogram to train recruits throughout India andensure that they are business-ready.Marketing Data driven digital marketing – through email andSMS. We intend to continue our investments in digitalmarketing and other customer- and distributorfacing digital initiatives.Source: RTA Data.17
UTI International Ltd. - Stellar performance during the year Assets under management increased by 70% from INR 15,965 Crs as of 31st March 2020 toINR 26,822 Crs as of 31st March 2021. Three Office Locations – Singapore, Dubai and London with a total of 26 staff. Regulated by Monetary Authority of Singapore, DIFC in Dubai and FCA, UK Fund structures in Ireland, Singapore, Cayman Islands, Dubai and Mauritius Clients spread across 35 countries with top 5 being Japan, Switzerland, France, UK, Israeland are primarily Institutions – Pensions, Insurance, Banks and Asset Managers Indian Equity fund domiciled in Ireland is one of the largest India fund among UCITS funds,with AUM of USD 823 million and has won multiple awards in Singapore, Japan &Switzerland The J Safra Sarasin Responsible India fund, Europe’s first ESG compliant India fund, RaisedUSD 125 Million in 6 Months.18
UTI Retirement Solutions Ltd. – Leading from the front 100% subsidiary PFRDA licensed for managing Pension funds Managing Government and non-Government NPS corpus UTI Retirement Solutions has shown AUM growth of 36% from INR 122,202 Crs ason 31st March 2020 to INR 166,210 Crs as on 31st March 2021 UTI RSL manages 28.75% of Industry AUM as on 31st March 202119
UTI Capital – Expanding the Business Portfolio 100% subsidiary of UTI AMC Ltd. mandated to manage and grow the private capital investmentbusiness Currently manages 2 active private debt funds with and AUM of INR 1,142 Crs.1 UTI Structured Debt Opportunities Fund I – Launched in August 2017. Fund closed in May 2019.AUM of Rs. INR 695 crores. Currently Investing UTI Structured Debt Opportunities Fund II – Launched in September 2020. AUM of Rs. INR 447crores. Currently Fund Raising as well as Investing The firm is also pursuing a comprehensive ESG strategy across its current and future fundofferingsData as of 31st March 20211Additionally, UTI Capital advises a 2015 vintage private equity fund called Pragati India Fund and is also indivesting stage of a 2010 vintage infrastructure PE fund called India Infrastructure Development Fund20
ESG Initiatives Initiated ESG framework development exercise for integrating essential ESG aspects into businessoperations Framework to be based on international standards and help in strengthening existing managementsystems Working towards developing first GRI Standards based sustainability report to enable improvingoverall ESG performanceSE UTI AMC Group is a signatory toUnited Nations – Principles ofResponsible Investing framework Adopted paperless office system,smart e-approval systems GStrong CSR programme focusing onhealth and educationThe Company believes in the philosophyof compassionate care, generosity andcompassion, characterized by awillingness to build a society that worksfor everyone.The total amount invested towards CSRfor the FY ended March 31,2020 is INR5.5 Crs.21 Corporate governance factors havealwaysbeenanintegralcomponent of our investmentphilosophy and company selectionprocess.As on March 31, 2021, 2/3rd ofBoard members are independentdirectors (6 out of 9) and 2independent women directors.
Financial Snapshot
Consolidated Statement of Profit & Loss – Year End EarningsParticularsTotal Revenue from OperationsOther IncomeTotal IncomeFee & Commission exp.Employee benefit expenseDepreciation & Amortization expensesOther ExpenseFinance costTotal ExpensesPBTPATPAT Margins (PAT Margin PAT / Total 36890334034163954934127130%{ } indicates reduction in ExpensesTotal Revenue from OperationsSale of ServiceMTM gain on InvestmentsNet Gain from sale of InvestmentsInterest & Dividend IncomeRental IncomeTotal Revenue from %( /-)2%3332%9%-36%37%INR Crores%( /-)37%(16%)35%-12%7%4%{14%}9%77%82%
Consolidated Statement of Profit & Loss – Quarterly EarningsParticularsTotal Revenue from OperationsOther IncomeTotal IncomeFee & Commission exp.Employee benefit expenseDepreciation & Amortization expensesOther ExpenseFinance costTotal ExpensesPBTPATPAT Margins (PAT Margin PAT / Total 146111010364161(15)(25)(17%){ } indicates reduction in ExpensesTotal Revenue from OperationsSale of ServiceMTM gain on InvestmentsNet Gain from sale of InvestmentsInterest & Dividend IncomeRental IncomeTotal Revenue from ( /-)29%122%97%-30%112%INR Crores%( 6%)
Consolidated Profit & Loss – Sequential Quarterly EarningsParticularsTotal Revenue from OperationsOther IncomeTotal IncomeFee & Commission exp.Employee benefit expenseDepreciation & Amortization expensesOther ExpenseFinance costTotal ExpensesPBTPATPAT Margins (PAT Margin PAT / Total 4811161039216818014040%{ } indicates reduction in ExpensesTotal Revenue from OperationsSale of ServiceMTM gain on InvestmentsNet Gain from sale of InvestmentsInterest & Dividend IncomeRental IncomeTotal Revenue from OperationQ4FY2123615306228925Q3FY21212116932342%( /-)11%(87%)251%100%-(15%)INR Crores%( /-)(15%)(41%)(16%)-{36%}{5%}39%-(16%)(16%)(5%)
Standalone Statement of Profit & Loss – Year End EarningsParticularsTotal Revenue from OperationsOther IncomeTotal IncomeFee & Commission exp.Employee benefit expenseDepreciation & Amortization expensesOther ExpenseFinance costImpairment of financial instrumentsTotal ExpensesPBTPATPAT Margins (PAT Margin PAT / Total Income)FY21941279686342341208051045835236%{ } indicates reduction in ExpensesTotal Revenue from OperationsSale of ServiceMTM gain on InvestmentsNet Gain from sale of InvestmentsInterest & Dividend IncomeRental IncomeTotal Revenue from 09948637630936%FY207184841169832INR Crores%( /-)13%(9%)12%-11%2%-{14%}{100%}5%22%14%%( /-)1%228%(38%)25%28%13%
Standalone Statement of Profit & Loss – Quarterly EarningsParticularsTotal Revenue from OperationsOther IncomeTotal IncomeFee & Commission exp.Employee benefit expenseDepreciation & Amortization expensesOther ExpenseFinance costImpairment of financial instrumentsTotal ExpensesPBTPATPAT Margins (PAT Margin PAT / Total 1851101102640142433117%{ } indicates reduction in ExpensesTotal Revenue from OperationsSale of ServiceMTM gain on InvestmentsNet Gain from sale of InvestmentsInterest & Dividend IncomeRental IncomeTotal Revenue from OperationQ4FY212112055324427Q4FY20164(1)962180%( /-)28%1488%(47%)(17%)22%36%INR Crores%( 270%
Standalone Profit & Loss – Sequential Quarterly EarningsParticularsTotal Revenue from OperationsOther IncomeTotal IncomeFee & Commission exp.Employee benefit expenseDepreciation & Amortization expensesOther ExpenseFinance costTotal ExpensesPBTPATPAT Margins (PAT Margin PAT / Total Income)Q4FY212444248263942211713111346%INR CroresQ3FY212606266110892621461208130%{ } indicates reduction in ExpensesTotal Revenue from OperationsSale of ServiceMTM gain on InvestmentsNet Gain from sale of InvestmentsInterest & Dividend IncomeRental IncomeTotal Revenue from OperationQ4FY212112055324428Q3FY2119155833260%( /-)10%(63%)(39%)73%-(6%)%( /-)(6%)(43%)(7%)16%{42%}{5%}62%-(20%)9%41%
Details of Consolidated Sale of ServicesINR CroresParticularsQ4FY21Q4FY20%( /-)FY21FY20YoY%MF Fees20115827%6936920%PMS Fees7463%211545%SUUTI Support Service Fees3243%1010--POP Fees & others1018%22--Sale of Service - UTI AMC Standalone21116428%7267181%UTI International221449%655616%UTI RSL4333%151133%UTI Capital & UTI Venture22--77--Elimination(2)(1)85%(7)(5)41%Sale of Service - UTI AMC Consolidated23618329%8077882%29
Standalone Balance SheetINR CroresAs on Mar 31,2021As on Mar 31,2020YoY%Financial Assets2820250113%Non-financial Assets4374302%Total Assets3257293111%Equity2881259511%Financial Liabilities24622410%Non-financial Liabilities13011216%Total Equity & Liabilities3257293111%ParticularsAssets:Equity & Liabilities:30
Consolidated Balance SheetINR CroresAs on Mar 31,2021As on Mar 31,2020YoY%Financial Assets3217272218%Non-financial Assets4484431%Total Assets3665316516%Equity3237278316%Financial Liabilities26523911%Non-financial Liabilities16314314%Total Equity & Liabilities3665316516%ParticularsAssets:Equity & Liabilities:31
Operating Profit Margin (bps of AAUM)YE FY 18YE FY 19YE FY 20YE FY %20%10%0%PAT MarginOperating ExpensesOperating Revenue32
UTI International Ltd. – Consolidated StatementINR CroresParticularsFor the Year ended on March 31, 2021For the Year ended on March 31, 2020(GBP in ‘000)Rs. in Crore(GBP in ‘000)Rs. in 63(51)Profit after Tax14,649142(5,769)(52)Paid up Share CapitalNet Worth6,75849,165684946,75835,02368326AUMSale of ServiceM2M gain from InvestmentOther IncomeTotal IncomeEmployee CostAdmin & other ExpTotal ExpensesProfit before Tax33
Other Subsidiaries Financial highlightsINR CroresUTI Retirement Solutions Ltd.UTI Capital Pvt. Ltd.ParticularsUTI Venture Funds Mgmt. Co.Pvt. Ltd.FY 20-21FY 19-20FY 20-21FY 19-20FY 20-21FY .1)0.80.7Employee Benefit Expenses2.61.55.85.1--0.1Depreciation Expenses0.30.30.10.5----Administration (0.5)(0.5)13.98AUMSale of ServicesM2M Gain on InvestmentOther IncomeTotal IncomeTotal ExpensesPBTPATNetworth34
Consolidated RatiosReturn on Equity (%)Pat Margin FY20FY21FY1835FY19FY20FY21
Annexures
Breakup of Consolidated InvestmentsAs on Mar 31, 2021Investment in UTI MF SchemesTotal Investments: Rs. 2,747 croreBreakdown of Total InvestmentVenture Funds, Other Equityetc. 11.0%Equity48Arbitrage685Liquid & DebtOffshore FundsOffshore Funds11.5%Offshore Funds316333Debt / Hybrid24TotalMutual Funds1,397EquityVenture Funds, Other Equity etc.#Mutual Funds77.5%INR crore2,1303012,747#Note : Investment in Venture Funds & Other Equity Includes: Inv. In Ascent India III : 151 Crore Inv. In SODF I & II: 126 CroreVenture funds, Other equity#Note : Investment in equity includes investment as per regulatory mandate37
Experienced and Independent AMC BoardMr. Dinesh Kumar MehrotraMr. Rajeev KakarIndependent Director & Chairman of the CompanyRetired Chairman and Managing Director of LICDirectorship in Computer Age Management Services Limited, SBI Card andPayments Services Limited, Tata AIA Life Insurance Company Limited,Metropolitan Stock Exchange of India Limited, etc.Independent DirectorOver 3 decades of experience in banking and financial InstitutionsPreviously, associated with Citibank NA as MD and division head for Turkey,Middle East and Africa region, and Fullerton Financial Holdings Pte. Ltd. He wasalso the founder of Dunia Finance LLC in UAE, where he operated as its MD &CEO.Directorship in Eurobank Ergasias SA (Greece), Gulf International Bank (Bahrainand Kingdom of Saudi Arabia) and Commercial International Bank (Egypt).Mr. Edward Cage BernardAssociate DirectorSenior Advisor, T. Rowe Price Group IncWas the Vice Chairman, TRP Group and Director, T Rowe Price Group Inc.U.S.A.Ms. Jaya VaidhyanathanIndependent DirectorPresident – Banking & Financial Services Institutions at Bahwan Cybertek Pvt.Ltd.Previously associated with Scope International Pvt. Ltd. and Accenture ServicesPvt. LtdMr. Flemming MadsenAssociate DirectorVice President at T Rowe Price GroupPrior experience in the financial industry includes capital marketstransactions, Investment Banking and Asset Management.Ms. Dipali ShethIndependent DirectorPreviously, associated with RBS Business Services Pvt. Ltd. as Country Head –Human Resources and with Standard Chartered Bank, Procter & GambleDistribution Company Ltd, DCM Ltd. and Ashoka UniversityDirectorship in Centrum Financial Services Ltd. and DFM Foods Ltd.Mr. N SeshadriIndependent DirectorRetired Executive Director of Bank of IndiaCertificated associate of Indian Institute of BankersDirectorship in Medreich Ltd., Adcock Ingram Ltd. and IDFC First Bharat Ltd.Mr. Imtaiyazur RahmanCEO and Whole Time DirectorAssociated with UTI Group since 1998 and with UTI AMC since 2003Over 30 years of experience in Management, Business Leadership and formingstrategic allianceHe is on the Board of UTI International Ltd, UTI Capital Pvt. Ltd., UTI RSL, IndianOil tanking Ltd.Mr. Deepak ChatterjeeIndependent DirectorRetired MD & CEO of SBI Funds Management Ltd.Past Association with IIFCL Projects Ltd. as CEO and IIFCL AMC as Director,and with SBI Capital Markets Ltd. as General Manager38
DisclaimerThis presentation is for information purposes only and does not constitute a prospectus, an offering circular, an advertisement, a private placement offer letter or offer document or an offer or therecommendation or solicitation of an offer or invitation to purchase or sell any securities of UTI Asset Management Company Limited or its subsidiaries or its associates (together, the “Company”) under theCompanies Act, 2013 and the rules made thereunder, the Securities and Exchange Board of India (Issue of Capital and Disclosure Requirements) Regulations, 2018, as amended, or any other applicable law inIndia, the United States, or any other jurisdiction. This presentation has not been and will not be reviewed or approved by a regulatory authority in India or by any stock exchange in India. The Company hasprepared this presentation based on information available to it, including information derived from public sources that have not been independently verified. Please note that for ease of understanding andcalculations purposes, figures are rounded off to the nearest number while presenting figures in trillion, billion and million. In view of the rounding off, any calculations representing growth in % may not tally asit is derived from the underlying number. No representation or warranty, express or implied, is provided in relation to the fairness, accuracy, correctness, completeness or reliability of the information,estimates, projections, opinions or conclusions expressed herein. This presentation should not be used as a basis for any investment decision. The Company may alter, modify or otherwise change in anymanner the contents of this presentation, without obligation to notify any person of such revision or changes.The statements contained in this presentation speak only as at the date as of which they are made, and the Company expressly disclaims any obligation or undertaking to supplement, amend or disseminate anyupdates or revisions to any statements contained herein to reflect any change in events, conditions or circumstances on which any such statements are based. By preparing this presentation, none of theCompany, its management, and the respective advisers undertakes any obligation to provide the recipient with access to any additional information or to update this presentation or any additional informationor to correct any inaccuracies in any such information which may become apparent. Past performance may or may not be sustained in future and should not be considered as, indicative of future results. Thepresentation may contain information about UTI Mutual Fund which has to be read and understood in the context of the Company’s business, its operations and performance, and should not be construed asany form of communication / advertisement of UTI Mutual Fund. The information contained in this presentation is strictly confidential and is intended solely for your reference and shall not be reproduced (inwhole or in part), retransmitted, summarized or distributed to any other persons without the Company’s prior written consent. Any extraneous or inconsistent information or representation, if given or madeby any person, should not be relied upon as having been authorized by or on behalf of the Company.This presentation may contain, words or phrases like “will”, “aim” “believe”, “expect”, “projects”, “plans”, “will continue”, “anticipate”, “intend”, “estimate” and similar expressions or variations of theseexpressions, that are “forward-looking statements that involve risks and uncertainties and are based on certain beliefs, plans and expectations of the Company. Actual future performance, outcomes and resultsmay differ materially from those expressed in forward-looking statements as a result of a number of risks, uncertainties and assumptions. Although the Company believes that such forward-looking statementsare based on reasonable assumptions, it can give no assurance that such expectations will be met. Representative examples of factors that could affect the accuracy of forward-looking statements include(without limitation) the condition of, and changes in, India’s political and economic status, government policies, applicable laws, global capital markets, the mutual fund industry in India, pandemics andinternational and domestic events having a bearing on the Company’s business, and such other factors beyond the Company’s control. You are cautioned not to place undue reliance on these forward-lookingstatements, which are based on current views of the Company’s management on future events. Further, nothing in this presentation should be construed as constituting legal, business, tax or financial advice ora recommendation regarding the securities. None of the Company or any of its affiliates, advisers or representatives accepts any liability whatsoever for any loss or damage howsoever arising from anyinformation presented or contained in this presentation. The distribution of this presentation in certain jurisdictions may be restricted by law. Accordingly, any persons in possession of this presentation shouldinform themselves about and observe any such restrictions. The information contained herein does not constitute an offer of securities for sale in the United States or in any other jurisdiction. Securities maynot be offered or sold in the United States absent registration or an exemption from registration under the U.S. Securities Act of 1933, as amended. Before acting on any information you should consider theappropriateness of the information having regard to these matters, and in particular, you should seek independent
Sub: Investors Presentation Dear Sir/ Madam, Pursuant to Regulation 30 of the SEBI (Listing Obligations and Disclosure Requirements) Regulations, 2015, we are enclosing herewith the Investors Presentation. We request you to kindly take the aforesaid information on rec
