Transcription
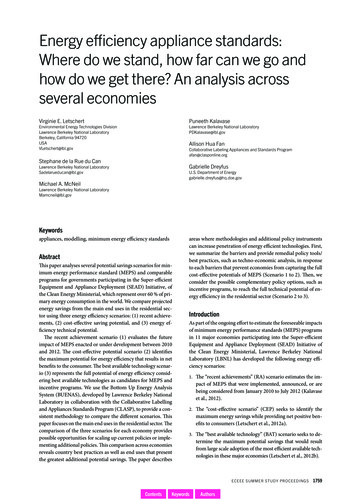
Evaluation of Energy Efficiency Goals andPrograms Filed with the Iowa Utilities Board bythe Iowa Association of Municipal UtilitiesReport to the Iowa General AssemblyJanuary 1, 2011IOWA UTILITIES BOARDRobert B. Berntsen, ChairKrista K. TannerDarrell Hanson
Executive SummarySenate File 2386, enacted in 2008, was an omnibus energy bill that directed gasand electric municipal and rural electric cooperative utilities to assess theirmaximum potential energy and capacity savings and establish an energyefficiency goal based on that assessment. The utilities were then to establishcost-effective energy efficiency programs designed to help them meet their newenergy efficiency goal.The legislation also established a reporting schedule for the utilities and the IowaUtilities Board (Board): July 1, 2008Utilities to begin process of determining cost-effectiveenergy efficiency goals January 1, 2009Utilities to provide progress reports to the Board January 1, 2010Utilities to submit final reports to the Board January 1, 2011Board to provide evaluation and summary of thereports to the General Assembly January 1, 2012Utilities are required to file bi-annual reportsidentifying their progress in meeting their goals andany updates to their plansOn December 31, 2009, the Iowa Association of Municipal Utilities (IAMU) filedthe Report of Energy Efficiency Goals for Iowa’s Municipal Electric and GasUtilities (IAMU Joint Report) on behalf of its member utilities, municipal utilitiesserved by Missouri River Energy Services (MRES) and several small nonmember utilities. The municipal electric utilities set an average 2012 energysavings goal of 1.09 percent of sales. For municipal gas utilities, the averagegoal for 2012 energy savings is 0.74 percent of sales.The 2008 legislation directed the Board to evaluate the report submitted by themunicipal utilities and the rural electric cooperatives and to report to thelegislature summarizing the evaluation by January 1, 2011. Specifically, theBoard’s report is to include:1. The goals established by each of the utilities2. The projected costs of achieving the goals3. The potential rate impacts4. A description of the programs offered and proposed by each utility orgroup of utilities5. The report may contain recommendations concerning the achievability ofthe goals based on the results of the utilities’ assessment of potentialThe Board wishes to express appreciation for the efforts by the utilities and theIAMU. The IAMU Joint Report represents substantial work to identify new energyefficiency opportunities for the municipal utilities of Iowa. The IAMU alsoprovided valuable assistance to the staff of the Iowa Utilities Board, including2
additional information which helped to clarify various aspects of the IAMU JointReport.The Board has reached the following conclusions and recommendationsregarding the IAMU Joint Report:Conclusions:1. Goals – The goals adopted by the municipal utilities increase electricitysavings from 0.71 percent of sales in 2010 to 1.09 percent of sales in2012. If these goals are met, the utilities and their customers will saveenergy and reduce peak demand. IUB Table ES-1 shows the goals for2012 in terms of electric energy savings in megawatt-hours (MWh) andnatural gas savings in terms of thousands of cubic feet (Mcf), along withthe percentages of estimated sales.IUB Table ES-1. 2012 Energy efficiency goals of municipal utilitiesElectricity Energy SavingsGas Energy SavingsMWhas % SalesMCfas % SalesIAMU Goals43,0721.09%40,4870.74%MRES Goals 14,2020.80%NANAMuni Total47,274Approx. 1.05%40,4870.74%Non- Muni Utility4460.2% to 1.1%2630.2% to 0.83%Goals2. Costs of Potential 2012 Goals – The total projected spending for energyefficiency programs in 2012 is 8,525,205 which is an increase of 32percent over the projected spending in 2010 of 6,410,385. The costsassociated with the goals of the municipal utilities appear adequate toallow the municipal utilities to reach their proposed goals.3. Rate Impacts (Cost Impacts) – Total costs compared to 2008 revenuewere estimated by IAMU to be approximately 1.3 percent in 2010 and 1.7percent in 2012. In other words, the cost to implement the proposed 2012programs would be 1.7 percent of 2008 revenues. The cost impacts of theprojected energy efficiency spending do not appear to be at levels whichwould pose barriers to implementation.The Board used cost impacts expressed as a percentage of revenuebecause the costs of energy efficiency implemented by each utility will berecovered directly from the utility's customers. Thus the impacts will beproportionate to the spending increases. This does not necessarily mean,however, that customers will see their bills increase 1.7 percent. This is1. The goals of the utilities which developed reports with the help of Missouri River EnergyServices range from 0.3% of sales in 2010 to 1.0% of sales in 2014. See the IAMU Joint Report,Appendix 8, p. 63
because a utility may, for example, simultaneously implement cost savingmeasures in other areas that offset any increases in energy efficiencyspending.4. Energy Efficiency Programs – The IAMU has developed a set ofcommon energy efficiency programs for its members across the state.These programs appear to target major areas of efficiency opportunitiesidentified in the assessment of potential studies and will provide increasedenergy efficiency opportunities for municipal customers.5. Achievability and Assessment of Potential – The IAMU Joint Reportand additional reports from MRES and Cedar Falls Utilities describeassessments of potential with extensive detail on both the process andprojected levels of energy efficiency potential. The studies, especially thestudy by the Energy Center of Wisconsin (ECW Study), provide extensivedescription of technologies, costs and potential, which adequately supportthe goals chosen by the municipal utilities.Cost-Effectiveness – The aggregate or average cost-effectivenessnumbers for the proposed goals and programs, stated by IAMU in terms of“Utility Levelized Energy Efficiency Cost,” compare favorably with thepotential future costs avoided by the implementation of the programs.Levelized costs for electric energy efficiency were estimated to range from1.0 to 2.4 cents per kWh depending on type of customer and incentive,and from 8 cents per therm to 31 cents per therm for natural gasefficiency, again depending on customer type and incentive levels.Programs are typically considered cost-effective if it would cost less for theutility to offer the program than it would cost to provide the additionalelectricity or gas that would otherwise be consumed. These levelizedcosts are well below municipal utilities’ estimated avoided costs, indicatingthe programs are cost-effective.Recommendations:1. The Board recommends the municipal utilities and other utilitiesparticipating in the IAMU Joint Report continue to implement the programsdescribed in the Joint Report and work diligently toward the goals theyhave adopted.2. As required by legislation, the Board recommends the municipal utilitiesand other utilities participating in the IAMU Joint Report report on theirprogress with implementation and any changes needed to their programs,by January 1, 2012. The Board will endeavor to work with these utilitiesand stakeholders to identify effective reporting requirements that are notburdensome to the many smaller utilities.4
IntroductionSenate File 2386, enacted in 2008, was an omnibus energy bill that directed gasand electric municipal and rural electric cooperative utilities to assess theirmaximum potential energy and capacity savings and establish an energyefficiency goal based on that assessment. The utilities were then to establishcost-effective energy efficiency programs designed to help them meet their newenergy efficiency goal.The legislation also established a reporting schedule for the utilities and theUtilities Board: July 1, 2008Utilities to begin process of determining cost-effectiveenergy efficiency goals January 1, 2009Utilities to provide progress reports to the Board January 1, 2010Utilities to submit final reports to the Board January 1, 2011Board to provide evaluation and summary of thereports to the General Assembly January 1, 2012Utilities are required to file bi-annual reportsidentifying their progress in meeting their goals andany updates to their plansOn December 31, 2009, The Iowa Association of Municipal Utilities (IAMU), onbehalf of its member utilities filed the Report of Energy Efficiency Goals for Iowa'sMunicipal Electric and Gas Utilities. The report summarized severalassessments of potential, included energy efficiency goals for 136 electric and 51gas municipal utilities, and described programs and measures to achieve theenergy efficiency goals, along with projected cost impacts and cost-effectivenessanalysis of the energy efficiency measures.On May 20, 2010, the IAMU filed an amendment to its original filing in the docketcovering this report (EEP-2009-0001) which updated the natural gas goals forAlton Municipal Utilities and the total for all municipal gas utilities. On October19, 2010, the IAMU filed another amendment containing the projected spendingfor energy efficiency for the years of 2010, 2011, and 2012 as a percentage of2008 revenue 2, a table showing the municipal utility levelized energy efficiencycost by sector (residential, commercial and industrial/agricultural); and adescription of the Whole Town Audit. On December 6, 2010, the IAMU filed athird amendment providing a detailed explanation of the utilities’ goals andclarifying differences between the goals and estimated potential. On December14, the IAMU provided comments in response to a draft of this report, suggestingsome changes in wording to clarify the Board’s description of the IAMU JointReport.2The 2008 Revenue is Sales to Ultimate Customers.5
After the utilities filed their Joint Report, the 2008 legislation directed the Board toevaluate the reports submitted by the municipal utilities and the rural electriccooperatives and to submit a report summarizing the evaluation by January 1,2011. Specifically, the Board’s report is to include:1. The goals established by each of the utilities2. The projected costs of achieving the goals3. The potential rate impacts4. A description of the programs offered and proposed by each utility orgroup of utilities5. The report may contain recommendations concerning the achievability ofthe goals based on the results of the utilities’ assessment of potentialThe structure of this report is based on these legislative directives. The reportalso includes appendices 1 through 6. All of the energy efficiency statutesapplicable to the non-rate regulated utilities are included in Appendix 1. Theother appendices are referenced throughout the report.1.Municipal Utilities’ Energy Efficiency GoalsThe municipal utilities participating in the IAMU Joint Report selected their owngoals, guided by the assessment of potential done by the Energy Center ofWisconsin (ECW). The members of the Missouri River Energy Services 3(MRES) based their goals on the integrated resource plan developed by MRES.Other municipal utilities, including Ames, Cedar Falls Utilities, and Waverly Light& Power, provided supplemental studies which informed their goals.The IAMU Joint Report presented goals for most of the municipals, along withAmana, Farmers Electric Cooperative (Kalona), Allerton Gas, and ConsumersEnergy (gas). The MRES utilities were not included with those goals; instead thegoals for MRES utilities were separately presented in the MRES portion of theJoint Report. Tables showing the goals assembled by IAMU can be found inAppendix 5 of this report and tables showing the MRES goals can be found inAppendix 6 of this report.The IAMU described the selection of goals by the municipal utilities as follows:Goal setting was an iterative process, as some utility governingbodies (city councils or boards of trustees) met only once a month.The IAMU Board of Directors also helped the process byunanimously adopting a recommendation that utilities establish3Missouri River Energy Services (MRES) describes itself as “a not-for-profit municipal poweragency serving sixty member municipal utilities in Minnesota, Iowa, and North and SouthDakota.” Eighteen of these communities are located in western Iowa and sixteen of the eighteenIowa members of MRES purchase supplemental wholesale power supply from MRES.6
goals for 2012 consistent with the findings of the potentialassessment and that they commit two percent of their grossrevenues to achieve their goals. (IAMU Joint Report, ExecutiveSummary, p. 4.)The 2012 goals presented in the IAMU tables (not including MRES utilities or thesmall non-municipal utilities) are as follows: Electricity savings of approximately 0.71 percent of sales in 2010increasing to 1.09 percent of sales in 2012. This equates to approximately38,128 megawatt-hours (MWh) in 2010 and about 43,072 MWh in 2012.Natural gas savings of approximately 0.41 percent of sales in 2010increasing to 0.74 percent of sales in 2012. These savings are equal toabout 21,831 thousands of cubic feet (MCf) of natural gas in 2010 and40,487 MCf of natural gas in 2012.MRES utilities set goals at a level higher than the market potential indicated bythe MRES assessment of potential as shown in the figure below. In 2010, thegoal for the MRES utilities is 0.3 percent of the average kilowatt-hour (kWh) soldwhile in 2012 the goal is 0.8 per cent of the average kWh sold. IUB Figure 1alsoshows the Iowa members were aware of the need to “ramp up” in the early years(2010 and 2011) before they are able to reach the higher goals.IUB Figure 1 - MRES Estimate of Potential and Iowa MRES Municipal Goals7
A consensus of the Iowa members of MRES decided to set the goals higher thanthe market potential because of several factors including: MRES has offered toprovide members monetary, program development, and implementationassistance; the Iowa members believe they can overcome many of the identifiedmarket barriers through marketing campaigns and a trade ally outreach program;the Iowa members want to challenge themselves to obtain the highest levels ofenergy efficiency possible; and energy efficiency is a least-cost resource forMRES and its member utilities.Goals for small, non-municipal utilities, including Amana, Farmers ElectricCooperative (Kalona), Allerton Gas, and Consumers Energy (gas) are shown inIUB Table 1 below.IUB Table 12012 Goals selected by small utilities reporting as part of the IAMU Joint ReportElectric GoalNatural Gas GoalMWhas % of SalesMCfas % of SalesAmana Society1810.20%NANAService Co.Farmers Electric2651.10%NANACooperative (Kalona)Allerton GasNANA1780.83%CompanyConsumers EnergyNANA850.20%Coop (Gas Service)In order to aggregate the 2012 goals for all utilities included in the IAMU JointReport, the data was assembled into IUB Table 2. In 2012, the goal for theseutilities is to have electricity energy savings of 1.05 percent of sales and naturalgas savings of 0.74 percent of sales.IAMU GoalsMRES GoalsMuni TotalNon-Muni UtilityGoalsIUB Table 22012 Energy Efficiency GoalsElectricity Energy SavingsNatural Gas Energy SavingsMWhas % of SalesMCfas % of rox. 1.05%40,4870.74%4460.2% to 1.1%2630.2% to 0.83%Sources: ECW Study, p. 7 and Table 2 on p. 14. IAMU Report, Appendices 3, 4, 5 and 6.2.Municipal Utilities' Projected Costs of Achieving the GoalsIn its October 19, 2010, filing, the IAMU provided a projection for spending onenergy efficiency for each of the utilities included in the IAMU Joint Report.8
These spending projections are the costs associated with the utilities' projectedenergy efficiency goals. Below is IUB Table 3 that summarizes the projectedspending by year.IUB Table 3Projected Energy Efficiency Spending 420102011Municipal Electric Utilities 5,523,763 5,688,143Non-Muni Electric Utilities 38,561 63,732Municipal Gas Utilities 839474 1,075,065Non-Muni Gas Utilities 8,587 9,284Total 6,410,385 6,836,2242012 7,200,259 83,391 1,232,099 9,456 8,525,205The utilities project an increase in total spending for energy efficiency of 425,839, or 7 percent, from 2010 to 2011; and an increase of 1,688,981, or 25percent from 2011 to 2012. This represents an overall increase of 2,114,820, or32 percent from 2010 to 2012.3.Municipal Utilities’ Potential Rate Impacts (Cost Impacts)The Board is required to report on “potential rate impacts,” however, the Boardhas no jurisdiction over the rates of municipal utilities, and thus a Board reportwhich examines rates of municipal utilities might be viewed by some as anintrusive effort to evaluate the rates of individual municipal utilities. Additionally,an examination of the rate impacts of energy efficiency spending, in isolationfrom the benefits, may distort the true picture of energy efficiency programs.The Board used cost impacts expressed as a percentage of revenue becausethe costs of energy efficiency implemented by each utility will be recovereddirectly from the utility's customers. Thus the impacts will be proportionate to thespending increases.The October 19, 2010, IAMU Amendment included separate tables (SeeAppendix 2) for the electric and gas utilities which show the projected energyefficiency spending by utility and the 2008 revenue. Using the projectedspending and 2008 revenue, cost impacts for each utility were calculated. Thetotal cost impacts are shown in the IUB Table 4.4The 2008 revenue is sales to ultimate customers.9
IUB Table 4Projected Energy Efficiency Spending as a Percentage of 2008 Revenue 5201020112012Municipal Electric Utilities1.5%1.5%1.9%Small Electric Utilities0.4%0.7%0.9%Municipal Gas Utilities0.9%1.1%1.3%Small Gas Utilities0.3%0.3%0.3%Total1.3%1.4%1.7%Based on the 2008 revenues and the projected energy efficiency spending, thecost impact in 2010 for all the utilities in the IAMU Joint report is 1.3 percent andis 1.7 percent in 2012.4.Municipal Utilities’ ProgramsThe IAMU Joint Report described a group of “turn-key” programs that weredeveloped by IAMU for use by members. The IAMU recommended that eachutility adopt a set of seven common programs which included:1. Residential and small commercial Energy Star prescriptive appliancerebate programs for electric and gas appliances2. Residential and small commercial lighting3. Residential prescriptive rebates for high-efficiency heating, cooling, andgas water heating4. Residential audit and weatherization incentives5. Commercial and industrial prescriptive programs for lighting, motors,variable frequency drive, large heating and cooling systems, waterheating, and refrigeration6. Non-residential custom programs7. Customer educationThese programs were developed by the IAMU and are trademarked as theeco@home and eco@work sets of programs, or as stated by IAMU:“eco@home and eco@work identify energy efficiency programs andpublications of the members of the Iowa Association of Municipal Utilities.”The IAMU Joint Report stated that “unless otherwise specified, all utilitiesincluded in this report will use the programs and measures recommended byIAMU ” (IAMU Joint Report, Executive Summary, p. 6)The IAMU Joint Report noted that there were utilities, or groups of utilities, thathad developed energy efficiency programs that are not consistent with the sevenprograms listed above. Appendix 3 provides a list of the energy efficiencyprograms offered by each these utilities, or group of utilities.5ibid10
The common energy efficiency programs that IAMU has developed for itsmember appear to target major areas of efficiency opportunities identified in theassessment of potential studies and will provide increased energy efficiencyopportunities for the municipal customers throughout the state. The IAMU hascommitted to continued development of additional energy efficiency programssuch as other low-income programs and appliance pickup programs.5.Achievability, Assessment of Potential, and Cost-EffectivenessThe majority of the utilities included in the IAMU Joint Report participated in anassessment of potential conducted by the ECW. However, the Iowa members ofMRES relied on an assessment conducted by PA Consulting Group of Madison,Wisconsin. Additionally, Cedar Falls Utilities provided an Energy Efficiency Planas a supplemental report. Each of these assessments will be described below.The ECW assessment of potential study (ECW Study) used an Excel -basedmodel to screen and evaluate over 500 energy efficiency and demand responsemeasures for residential, commercial, and industrial utility customers. Costeffectiveness screening of the technologies was done using the Total ResourceCost (TRC) test, which compares the net present value of benefits achieved overthe lifetime of the measure with the costs incurred by the program and theparticipant.The ECW evaluated technical and economic efficiency potential but focused onestimating “achievable” energy efficiency potential, defined as “the annualsavings that could be achieved by utility programs in a given year.” According tothe ECW, achievable potential estimates consider cost-effectiveness as well askey time-related and program-related constraints, and are more useful todecision-makers than estimates of technical or economic potential. Two sourceswere used to help determine achievable potential: a survey of Wisconsin energyefficiency experts (with results modified for Iowa-specific attributes), and surveysof IAMU members.For 2012, the ECW estimated the energy efficiency achievable under a moderatelevel of program effort, and for 2018, it projected what could be achieved underan aggressive level of program effort. The ECW also conducted analyses ofpeak demand reduction potential from dynamic energy pricing; estimated energyefficiency potential from improvements to utility distribution systems; anddiscussed energy efficiency program models for use in municipal utility serviceterritories. Additionally, the ECW conducted a sensitivity analysis to estimateenergy efficiency and demand reduction potential under a carbon cost scenario.The ECW Study summarized the estimated energy efficiency potential in Figures1, 2, and 3 shown below. In each of the figures, there are four categories of11
energy efficiency potential: technical, economic, 2012 achievable, and 2018achievable. 66Technical potential - all technologically feasible efficiency technologies are deployedimmediately, regardless of cost-effectiveness. Equivalent to 33 percent of baseline electricityconsumption, 52 percent reduction of peak electricity demand, and 28 percent of natural gasconsumption.Economic potential - assumes immediate deployment of all cost-effective efficiency technologies.Equivalent to 22 percent of baseline electricity consumption, 39 percent reduction of peakelectricity demand, and 21 percent of natural gas consumption.Achievable potential - For 2012, with moderate levels of energy efficiency program investment equivalent to 1.1 percent of baseline electricity consumption, 1.2 percent of peak electricitydemand, and 1.0 percent of natural gas consumption.Achievable potential - For 2018, under aggressive levels of energy efficiency program investment- equivalent to 1.2 percent of baseline electricity consumption, 1.8 percent reduction of peakelectricity demand, and 1.8 percent of natural gas consumption.12
(Source: Appendix 1 of the IAMU Report, ECW narrative, pp. 7-8)The ECW report states, "For each sector, energy efficiency potential wasallocated to individual utilities by multiplying aggregate savings potential acrossall participating utilities by each utility’s individual share of total sector sales. Thesame approach was used to allocate program costs by sector for eachparticipating utility (expressed as a percentage of estimated total program costs).This allocation process was conducted for the 2012 achievable potential andprogram cost estimates only." (ECW study, Appendix F, p. F-1)The achievable potential by sector can be viewed in ECW Study Table 2 whichshows the amount of energy and capacity savings projected by the ECW Study.ECW Study Table 2 - 2012 and 2018 Achievable Potential by SectorElectricity SavingsDemand ReductionNatural Gas SavingsPotentialPotentialPotential(Annual GWh)(MW)(1000 3.6200400TOTAL596915238701,500ECW estimates by 2012, annual energy efficiency program investments ofbetween 9.4 million and 13 million would be necessary to achieve the resultsprojected in this analysis.A wealth of information is provided by the ECW Study. The ECW Study includedmore than 190 pages of tables showing the energy efficiency measures analyzedin the study. Hundreds of energy efficiency measures were presented in tableswhich described each measure and provided measure parameters in terms of:13
Base saturation (percent of housing units with measure)Energy efficiency saturation in percentBase energy use applicable to the measureMeasure useful lifeTechnical savings rate in percentLoad reduction factorAnnual impact of aggressive programs in percentTotal Resource Cost Ratio, andVarious other characteristicsThe ECW Study identified electric lighting as both a key energy efficiencyopportunity and a challenge to be faced by utility-sponsored energy efficiencyprograms, which must try to “stay ahead” of changes in building codes andfederal appliance standards. The ECW Study stated that its data showed: a substantial decrease in residential electricity savings potentialfrom 2012 to 2018, and a substantial increase in natural gassavings potential. These trends are primarily the result of newfederal efficiency standards for light bulbs which come into effectover the period. Once high efficiency bulbs become mandated bylaw they are no longer within the purview of energy efficiencyprograms The trend for residential natural gas potential is the flipside of the same coin, as there is a significant heating penaltyassociated with installation of energy-efficient lighting. (IAMUReport, ECW Study, Appendix 2, p. 14)The importance of lighting to energy efficiency efforts is substantial. In the ECWStudy, lighting amounted to 24,000 of the 29,000 MWh of electric energypotential savings for the residential sector in 2012. Lighting also amounted to7,500 MWh out of 19,000 MWh in potential savings for commercial customers,and about 3,000 MWh out of 12,000 MWh in potential savings for industrialcustomers, in 2012. (ECW Study, p. 16-19)The ECW Study suggests that for gas energy efficiency, the key technology isspace heating equipment for residential and commercial customers. Someindustrial gas savings may be possible in the areas of process heating and steamsystems, but the small presence of industrial customers in municipal systemslimits the potential.The ECW Study also included Figures 11 through19 that show energy savingspotential by end use and Figures 20 through 28 which identify the top energysaving measures. These figures are shown in Appendix 4 of this report.While most of the utilities included in the IAMU Joint Report participated in theECW Study, the members of MRES chose to conduct a separate assessment ofpotential. In 2006, MRES conducted a study of energy efficiency potential14
(Potential Study) to consider demand-side management (DSM) already beingdone by its members, and to determine the remaining available potential for newDSM measures. In 2008, MRES hired PA Consulting Group of Madison,Wisconsin to update the previous Potential Study and determine the remainingenergy efficiency potential, segmented by state. This study was intended to fulfillthe needs of the Iowa MRES members under Iowa Code 476.6 "16"(c).The MRES Report, included in the IAMU Joint Report, provided a description ofmeasures similar to the analyses in the ECW Study, but with fewer analyticalitems. It focused on measure life, kW and kWh savings, incentive levels, andreplacement cost. As described in the MRES Report, the MRES Potential Studyreviewed 84 types of residential, commercial, and industrial energy efficiencymeasures, including all measures that were included in the MRES 2006 PotentialStudy, plus additional measures from the Minnesota “deemed savings database,”developed by the Minnesota Office of Energy Security. Those measuresincluded technologies in the areas of appliances, cooling and heating, lighting,water heating, electric cooking, plug loads, process equipment, refrigeration,roofing, envelope measures, direct load control, and other miscellaneousmeasures. The MRES Potential Study examined the potential energy efficienysavings over a 10-year period.The results of the MRES Potential Study were stated in terms of MWh andcompared to MWh sales in 2007 for each of the MRES utilities. PA Consultingestimated that each utility could reach a level of savings of about 0.63 percent inyear ten, from an average starting level of about 0.27 percent in 2010. Theestimated potential in year 2012 in the MRES Potential Study appeared to beabout 0.32 percent of sales.Cedar Falls Utilities (CFU) provided a Supplemental Report which amounted toan Energy Efficiency Plan for CFU. CFU describes its study of potential as:CFU used a study commissioned by the Iowa Association ofMunicipal Utilities (IAMU) to assess technical and economic energysavings potential for CFU and to attain general and initial estimatesof achievable potential for CFU. CFU then used a variety of localresources to fine tune these initial estimates of achievable potentialinto more specific estimates of achievable potential given CFU’sspecific service territory and past program offerings.IUB Table 5 shows a comparison between the potential for savings by CFUfound in the ECW Study and the estimates provided by CFU in the SupplementalInformation.15 pag
The municipal electric utilities set an average 2012 energy savings goal of 1.09 percent of sales. For municipal gas utilities, the average goal for 2012 energy savings is 0.74 percent of sales. The 2008 legislation directed the Board to evaluate the report submitted by the municipal utilities and the rural electric cooperatives and to report .