Transcription
Epidemiology/Health Services/Psychosocial ResearchO R I G I N A LA R T I C L EGlobal Prevalence of DiabetesEstimates for the year 2000 and projections for 2030SARAH WILD, MB BCHIR, PHD1GOJKA ROGLIC, MD2ANDERS GREEN, MD, PHD, DR MED SCI3RICHARD SICREE, MBBS, MPH4HILARY KING, MD, DSC2OBJECTIVE — The goal of this study was to estimate the prevalence of diabetes and thenumber of people of all ages with diabetes for years 2000 and 2030.RESEARCH DESIGN AND METHODS — Data on diabetes prevalence by age and sexfrom a limited number of countries were extrapolated to all 191 World Health Organizationmember states and applied to United Nations’ population estimates for 2000 and 2030. Urbanand rural populations were considered separately for developing countries.RESULTS — The prevalence of diabetes for all age-groups worldwide was estimated to be2.8% in 2000 and 4.4% in 2030. The total number of people with diabetes is projected to risefrom 171 million in 2000 to 366 million in 2030. The prevalence of diabetes is higher in menthan women, but there are more women with diabetes than men. The urban population indeveloping countries is projected to double between 2000 and 2030. The most importantdemographic change to diabetes prevalence across the world appears to be the increase in theproportion of people 65 years of age.CONCLUSIONS — These findings indicate that the “diabetes epidemic” will continue evenif levels of obesity remain constant. Given the increasing prevalence of obesity, it is likely thatthese figures provide an underestimate of future diabetes prevalence.Diabetes Care 27:1047–1053, 2004The number of people with diabetesis increasing due to populationgrowth, aging, urbanization, and increasing prevalence of obesity and physical inactivity. Quantifying the prevalenceof diabetes and the number of people affected by diabetes, now and in the future,is important to allow rational planningand allocation of resources.Estimates of current and future diabetes prevalence have been publishedpreviously (1–3). Since these reports ap-peared, further epidemiological data havebecome available for several countries inAfrica and the Middle East and for India.The sources of these data are identified inTable 1.This report provides estimates of theglobal prevalence of diabetes in the year2000 (as used in the World Health Organization [WHO] Global Burden of Disease Study) and projections for 2030. Itprovides a sequel to the report describingestimates of the global burden of diabetes From the 1Public Health Sciences, University of Edinburgh, Edinburgh, Scotland; the 2Department ofNon-Communicable Diseases, World Health Organization, Geneva, Switzerland; the 3Department of Epidemiology and Social Medicine, University of Aarhus, Aarhus, Denmark; and the 4International DiabetesInstitute, Caulfield, Victoria, Australia.Address correspondence and reprint requests to Dr. Sarah Wild, Public Health Sciences, University ofEdinburgh, Teviot Place, Edinburgh, EH8 9AG, Scotland. E-mail: sarah.wild@ed.ac.uk.Received for publication 18 October 2003 and accepted in revised form 26 January 2004.S.W. received honoraria for speaking engagements from Bayer Corporation. A.G. is a paid consultant ofNovo Nordisk.Additional information for this article can be found in an online appendix at http://care.diabetesjournals.org.Abbreviations: IDF, International Diabetes Federation; WHO, World Health Organization.A table elsewhere in this issue shows conventional and Système International (SI) units and conversionfactors for many substances. 2004 by the American Diabetes Association.DIABETES CARE, VOLUME 27, NUMBER 5, MAY 2004in 1990 (2) using newer data and differentmethods for estimating age-specific prevalence. As before, the estimates are basedon demographic changes alone with theconservative assumption that other riskfactor levels such as obesity and physicalactivity remain constant (in developedcountries) or are accounted for by urbanization (in less developed countries). Thecurrent estimates include all age-groups,and age-specific data are presented (online appendix [available at http://care.diabetesjournals.org]) to allow comparison with previous estimates that were foradults only (2). As most data sources donot distinguish between type 1 and type 2diabetes in adults, it is not possible topresent data separately for subtypes ofdiabetes.RESEARCH DESIGN ANDMETHODS — Diabetes prevalencedata for adults (ⱖ20 years of age) werederived from studies meeting the following criteria: a defined, population-basedsample and diagnosis of diabetes based onoptimal WHO criteria (a venous plasmaglucose concentration of 11.1 mmol/l2 h after a 75-g glucose tolerance test).The exceptions to the latter criterion werethe study in China, for which a test mealwas used (4), and the study in Tanzania(5), in which fasting glucose alone gave ahigher prevalence of diabetes than a previous study that used the optimal WHOcriteria.Prevalence estimates for type 1 diabetes for people 20 years of age for individual countries were estimated fromavailable incidence data using methodsdescribed in the International DiabetesFederation (IDF) Diabetes Atlas 2000 (6).Population-based data are not availablefor type 2 diabetes in people 20 years ofage, and this group has been excludedfrom these estimates.Age- and sex-specific estimates for diabetes prevalence were extrapolated toother countries using a combination ofcriteria including geographical proximity,ethnic, and socioeconomic similaritiesapplied by the authors with the adviceof the WHO regional officer and other1047
Global prevalence of diabetesTable 1 —List of diabetes prevalence studies by country of study giving sample size, age-group, and the countries to which the data wereextrapolatedCountry of study, year, andreference*Australia, 2000 (21)†Bolivia, 1998 (22)†Brazil, 1988/1989 (23)†Cameroon, published 1997 (24)†China, 1994 (4)†‡Colombia, 1988/1989 (25)Sample 030–6924–74224,25167025–64ⱖ30Fiji, 1980 (26)‡1,709ⱖ20Ghana, 1998 ⱖ30ⱖ1525–74ⱖ35ⱖ2050–742,9635709671,606 urban white 69India, 2000 (28)†Iran, 1999/2000 (29)†Israel (30)†‡Japan Funagata, 1990–1992 (31)†Jordan (32)†Lebanon†§Malta (33)†Mauritius (34)†‡Mongolia (35)†‡Nauru (36)†‡Netherlands, 1989–1992 (37)†Oman, 1991 (38)Pakistan: rural Baluchistan (39)†Pakistan: Sindh, 1994 (40)Paraguay, 1991/1992 (41)†Poland¶Russia㛳Samoa (42)†‡Saudi Arabia (43)†‡Singapore (44)†‡South Africa (45)†South Korea/Republic of Korea (46)†Spain (47)†Sudan (48)†Tanzania, 1996/1997 (5)†Trinidad, 1977–1981 (49)Tunisia, 1976/1977, 1980/1981 (50)Turkey (51)†3,826 urban1,787 rural24,788ⱖ20ⱖ20United Arab Emirates, 2000†‡#U.S., 1988–1994 (52)†Uzbekistan, 1996 *1,121ⱖ25Additional countries that estimates were applied toNew ZealandEcuador, PeruArgentina, Chile, Cuba, Mexico, Uruguay, VenezuelaAngola, Central African Republic, Congo, Gabon, Guinea, SaoTome, and PrincipeNorth Korea/Democratic People’s Republic of Korea‡Costa Rica, El Salvador, Guatemala, Honduras, Nicaragua,PanamaKiribati‡, Marshall Islands‡, Micronesia (Federated States)‡,Palau‡, Papua New Guinea‡, Solomon Islands‡, Vanuatu‡Benin, Burkina Faso, Cape Verde, Chad, Cote d’Ivoire,Equatorial Guinea, Guinea Bissau, Gambia, Liberia,Nigeria, Senegal, Sierra Leone, TogoBangladesh, Bhutan, Sri Lanka, Maldives, NepalAzerbaijan, Iraq, YemenSyria, urban EgyptSeychellesAustria, Belgium, Denmark, Finland, France, Germany,Iceland, Ireland, Luxembourg, Norway, Sweden,Switzerland, U.K.QatarAfghanistanSurinameBosnia, Croatia, Czech Republic, Estonia, Hungary, Latvia,Lithuania, Serbia, Slovakia, Slovenia, the Former YugoslavRepublic of Macedonia, UkraineCook Islands‡, Niue‡, Tonga‡, Tuvalu‡Bahrain‡, Kuwait‡Brunei‡, Indonesia, Malaysia, Philippines, ThailandBotswana, Lesotho, Namibia, Swaziland, ZimbabweAndorra, Italy, Monaco, San Marino, PortugalEritrea, Ethiopia, Mali, Mauritania, NigerBurundi, Comoros, Democratic Republic of the Congo,Djibouti, Kenya, Madagascar, Malawi, Mozambique,Rwanda, Somalia, Uganda, ZambiaAntigua and Barbuda‡, Bahamas‡, Barbados, Belize,Dominica, Dominican Republic, Grenada‡, Guyana, Haiti,Jamaica, St. Kitts and Nevis‡, St. Lucia‡, St. Vincent andthe Grenadines‡Algeria, Libya, MoroccoAlbania, Belarus, Bulgaria, Cyprus, Greece, Moldova,RomaniaCanadaArmenia‡, Georgia‡, Kazakhstan‡, Kyrgyzstan‡, Tajikistan‡,Turkmenistan‡Cambodia, Laos, Myanmar*Year indicates year of study, if given, or year of publication. †Indicates data that were not used in estimates for 1990. ‡Indicates same diabetes prevalence data usedfor urban and rural populations. §I. Salti, M. Khogali, S. Alam, N. Nassar, A. Masri, personal communication. 㛳E. Shubnikov, personal communication. ¶Z. Szybinski,W. Zukowski, R. Rita, J. Sieradzki, I. Turska-Karbowska, M. Gizler, personal communication. #M. Malik, A. Bakir, B. Abi Saab, G.R., H.K., personal communication.**P. Khi, personal communication.1048DIABETES CARE, VOLUME 27, NUMBER 5, MAY 2004
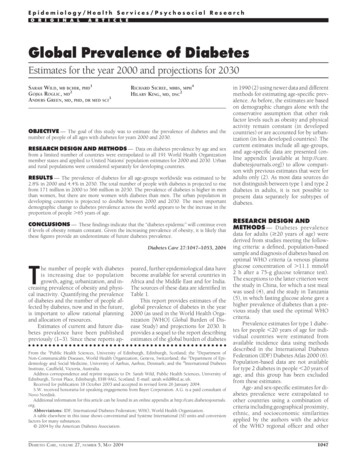
Wild and AssociatesTable 2 —Estimated numbers of people with diabetes by region for 2000 and 2030 and summary of population changesRegion (all ages)Established market economiesFormer socialist economiesIndiaChinaOther Asia and IslandsSub-Saharan AfricaLatin America and the CaribbeanMiddle Eastern CrescentWorld200020302000–2030Number ofpeople withdiabetesNumber ofpeople withdiabetesPercentage ofchange in numberof people withdiabetes*Percentage ofchange in totalpopulation*Percentage ofchange inpopulation 65years of age*Percentage ofchange in 9 11591192569461*A positive value indicates an increase, a negative value indicates a decrease.experts. Table 1 shows the studies usedand the countries to which data wereextrapolated.Surveys were generally performed onmiddle-aged populations, and data aremore limited at younger and older ages.Data on diabetes prevalence are usuallypresented in broad age bands, which suggest a biologically implausible step-likeincrease in diabetes prevalence with increasing age. DISMOD II software (available from http://www3.who.int/whosis)was used to produce smoothed, agespecific estimates of diabetes prevalencefrom the available data from each study.Further details on DISMOD II have beenpublished elsewhere (7). In summary,age- and sex-specific diabetes prevalence(derived from the studies listed in Table1), remission (assumed to be zero), andestimates of relative risk of mortalityamong people with diabetes (see below)were entered into models. The model output provides estimates of prevalence, incidence, and mortality that are consistentwith one another (7).Estimates of relative risk of all-causemortality among people with diabetes, byage and sex, were derived from the limited number of cohort studies that provide this information (8 –10). Estimatedrelative risks for all-cause mortalityranged between 1 (for the oldest agegroup, ⱖ80 years of age) and 4.1 (for20 –39 years of age) for men and between1 (for ⱖ80 years of age) and 6.7 (for20 –39 years of age) for women. Furtherinformation on the estimation of agespecific relative risks is available in thedraft Global Burden of Disease 2000 docDIABETES CARE, VOLUME 27, NUMBER 5, MAY 2004umentation (11). Mortality data were derived from developed countries (U.K.,Sweden, and U.S.). As no information wasavailable for developing countries, thesame relative risks were assumed to apply. Data are required to test the validityof this assumption. Survival is unlikely tobe better in developing countries than developed countries, and any bias in the approach we have taken would lead toconservative estimates of incidence of diabetes in developing countries but wouldnot affect estimates of prevalence. Estimates of incidence and mortality arenot presented in this report but areavailable from the authors and from thedraft Global Burden of Disease 2000documentation (11).The prevalence estimates were applied to population estimates for individ-ual countries for 2000 and 2030, whichwere produced by the United NationsPopulation Division (12). Conventional,albeit simplistic, definitions of developedcountries (Europe including former socialist economies, North America, Japan,Australia, and New Zealand) and less developed countries (all other countries)were used. In keeping with previous estimates, prevalence of diabetes was assumed to be similar in urban and ruralareas of developed countries (2). For developing countries, urbanization wasused as a proxy measure of the increasedrisk of diabetes associated with altereddiet, obesity, decreased physical activity,and other factors such as stress, which areassumed to differ between urban and rural populations. For most developingcountries, the prevalence of diabetes inFigure 1—Global diabetes prevalence by age and sex for 2000.1049
Global prevalence of diabetesDevelopment Report 1993 (14) and theGlobal Burden of Disease 1990 study wasretained. Data on population size and estimated numbers of people with diabetesfor individual countries were combinedto give regional estimates of diabetesprevalence.Figure 2—Estimated number of adults with diabetes by age-group, year, and countries for thedeveloped and developing categories and for the world.rural areas was assumed to be one-halfthat of urban areas, based on the ratio observed in a number of population studiesand as used in previous estimates (1). Forsome populations in developing countries (small islands and populations forwhich prevalence data
RESULTS— The prevalence of diabetes for all age-groups worldwide was estimated to be 2.8% in 2000 and 4.4% in 2030. The total number of people with diabetes is projected to rise from 171 million in 2000 to 366 million in 2030. The prevalence of diabetes is higher in men than women, but there are more women with diabetes than men. The urban population in