Transcription
An Introduction to Satellite LaserRanging Technology and itsApplications:Part 1: TechnologyDr. John J. DegnanSLR SchoolOctober 20, 2019Stuttgart, Germany1
PART 1:TECHNOLOGY OVERVIEW The Four Space Geodetic Techniques: SLR, VLBI, GNSS, DORIS Introduction to Satellite Laser Ranging (SLR) The SLR Ground Segment– Lasers– Detectors– Time Interval Units and Event Timers– Meteorological Subsystems: Surface pressure, temperature,humidity Accuracy Improvement: from meters to millimeters over 5 decades The Link Equation The SLR Space Segment: Retroreflector Arrays A Brief Introduction to Lunar Laser Ranging (LLR) Advantages of Single Photon Sensitivity and/or kHz Pulse Rates Interplanetary Laser Ranging via Transponders2
Space Geodetic TechniquesSatellite Laser RangingVery Long Baseline Interferometry3Global Navigation Satellite Systems (GNSS)GPS(USA), GLONASS (Russia), Galileo (ESA)DORIS (Doppler Orbitography andRadiopositioning Integrated by Satellite)
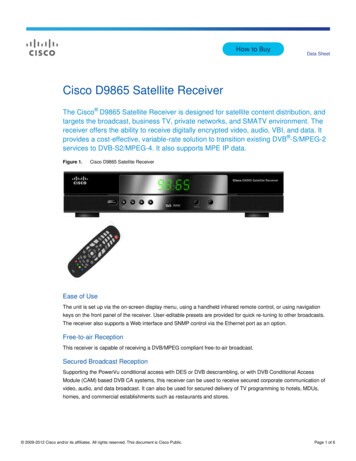
SLR Ground SegmentThe essential subsystems of an SLRststation are:1. A laser which generates a train ofshort pulses of light2. A telescope, tracking gimbal andcontrol system to point the laserbeam at the satellite and collect thelight from the retroreflectors.3. A fast detector sensitive enough tosee the weak signal return from thesatellite retroreflector array.4. A Time of Flight (TOF) receiverwhich records the times of departureand reception of the laser pulseusing an accurate clock.5. A meteorological station (not shown)to record local surface pressure,temperature, and relative humidity tobe input to atmospheric models thatprovide TOF corrections.6. A data storage4 unit to collect andstore all of the above data.
GSFC records first SLR returns on October 31, 1964Code 524 SLR TeamDr. Henry H. PlotkinThomas S. Johnson*Paul L. Spadin*John E. MoyeWalter J. Carrion*Nelson McAvoy*Sol Howard Genatt*Louis O. CaudillPeter O. MinottHerbert L. Richards*Michael W. FitzmauriceJohn J. DegnanEd ReidCharles J. PerusoHal Walker** Deceased5
SLR Technology in the 1960s Laser: Rotating Mirror Q-switched Ruby (694 nm –red beam)––– Energy: 0.8 JPulsewidth: 20 nsecRepetition Rate:1 HzDetector: 9558A Photomultiplier – standard dynode chain characterized by largevariations in electron propagation paths and large transit time jitter whichdegraded range precisionTelescope: 16 inch primary guided by two operators on elevation and azimuthjoysticks following sunlit satellite imageNo daytime ranging until 1969 when GSFC’s Don Premo introduced computercontrol of the tracking mount.Ranging Accuracy: 3 to 1 m (compared to 50 to 75 m for best microwave radarsof the period)First generation trailer-based Mobile Laser systems were developed by GSFC(MOBLAS 1 through 3)6
Maximizing the Range AccuracyWe maximize the individual range measurement accuracy by minimizing thevariance in the pulse Time Of Flight (TOF) measurement which is the sum of thevariances introduced by the individual subsystems, including the space target,and given by. 2Total 2Laser 2Detector 2Timer 2SpaceAnalysts determining the satellite orbits average over N individual “Full RateMeasurements” to form “Normal Points” for a segment of the orbital arc whichhave an improved range precision given by RNP TotalNThus, as the laser pulse frequency increases, the faster we can achieve thedesired normal point range precision. In addition, the resulting normal pointrepresents a shorter orbital arc length and a higher resolution orbit.7
Range Errors Caused by the AtmosphereJ. Degnan, Millimeter Accuracy Satellite Laser Ranging: A Review,Geodynamic Series Vol. 25, Contributions of Geodesy to Geodynamics, 1993In addition to instrumental and satellite induced range errors, we have to compensatefor few meter level changes in the measured range due to a decreasing atmosphericindex of refraction n with altitude which results in changes in the pulse group velocitygiven by c/n and the deviation of the light path from a straight line The Marini-Murraymodel assumes the atmosphere.consists of thin spherical shells governed by theequations for hydrostatic equilibrium, the law of partial pressures, and the perfect gaslaw.8
NGSLR Meteorological StationWind Monitor Belfort-Young Model 05103 Wind speed -Range: 0 to 135 mph;Accuracy: 0.6 mph Wind Direction: Range: 0 to 360o;Accuracy: 3oPressure/Temperature/HumidityMonitor Paroscientific MET3-1477-001 Pressure:Range: 800 to 1100 mbar;Accuracy: 0.1 mbar; stability 0.1 mbar/yr Temperature: Range: -40 to 70oC;Accuracy 0.5 oC; Stability 0.1 oC/yr; Relative Humidity: Range: 0 to 100%;accuracy: 2%; stability: 1%/yrGPS Antenna Receives timing signals from GPSconstellation to update RubidiumFrequency Standard and Station ClockSecurity Camera9
Sensitivity of the Range Error to Meteorological Station ErrorsJ. Degnan, Millimeter Accuracy Satellite Laser Ranging: A Review, GeodynamicSeries Vol. 25, Contributions of Geodesy to Geodynamics, 1993Pressure/Temperature/HumidityMonitor Paroscientific MET3-1477-001 Pressure: Range: 800 to 1100 mbar;Accuracy: 0.1 mbar (0.3mm to0.7mm) ; stability 0.1 mbar/yr Temperature: Range: -40 to 70 oC;Accuracy 0.5 oC (0.008mm to0.025mm); Stabilityaccuracy: 2%( 0.2 mm) 0.1 oC/yr; Relative Humidity: Range: 0 to100%; stability: 1%/yr ( 0.1mm/yr)10
NGSLR Day/Night All-Sky Cloud SensorUncooled IR CameraDaytime thermogramshows clear cooler) skiesto the north and east. Acloud (warm) covers zenithand extends to thesouthwest. The red objectin the northeast is asupport arm. Temperaturesare 17 to 33 oC.Convex MirrorNighttime thermogramreveals a large patchof clear sky at zenith,extending to the northand south. The eastand west are cloudy.Temperature range is 4to 21 oC.Color codes:warmer blue, green and red 11cooler gray and black.
NGSLR Precipitation and Visibility SensingThe Vaisala optics are comprised of an infrared beam and a detectoraimed across the beam. Scattering particles in the intersection ofthe two paths reflect IR light to the detector. These reflections areanalyzed and the particles are characterized. The CPU combines thisinformation with temperature data, reports the type and intensity ofprecipitation, as well as the visibility, and decides whether the domeshould be open or closed.Precipitation DetectionIntensity or Volts4Histogram of Visibility2532Vaisala IntensityAnalog Volts10-12002468The Vaisala reports precipitationwithin 2 to 3 minutes of itsdetection by a sensitive analogdevice, allowing time to closethe dome and protect theequipment.10 12 14 16 18 20Minutes of Time15%10500.910.19 20.29 30.40 40.50Kilometers50 Visibility is defined as the distance that an observer candistinguish a black object against the horizon. AtNASA/GSFC, the Vaisala instrument reports a fairly evendistribution from 0 to 50 km over a year’s12 time.
Maximizing Ground Segment Range Precision Minimize laser pulsewidth 1964: Q-switched ruby lasers at 694.3 nm (red) with 20 nsec FWHM pulsewidth 2019: Frequency-doubled modelocked Nd:YAG lasers at 532 nm (green) with FWHM pulsewidths 100 psecIncrease laser pulse rate to accelerate accurate normal point generation and maximize satellite coverage 1964: 1 Hz 2019: 2000 HzUse fast, low variance ( 300 psec) detectors 1964: Dynode Chain PhotoMultiplier Tubes (PMTs) had large electron path variations which degradedaccuracy 2019: Microchannel Plate PhotoMultiplier Tubes (MCP/PMTs), Single Photon Avalanche Photodiodes(SPADs), or Compensated SPADs (C-SPADs)Use high precision (few psec) timers with multistop capability 1964: Single stop Time Interval Units (TIUs) could only make range measurements serially (i.e. singlepulse in flight) and therefore limited the rate at which satellite normal point data could be acquired 2019: Multistop Event Timers (ETs) allow rapid recording of overlapping start and stop events whenmultiple pulses are simultaneously in flight thereby permitting high altitude satellite tracking at kHzlaser pulse rates and reducing the time required for high accuracy Normal Point generationUse optimized atmospheric models and high accuracy meteorological measurements (pressure,temperature, and humidity) as inputs for pulse TOF corrections as determined by the Marini-Murray model.More accurate atmospheric models exist for satellite elevation angles below 20 degrees. 1964: Accuracy not particularly relevant due to large instrument errors in the 1 to 3 m range. 2019: Essential to achieve current GGOS goal of 1 mm accuracy normal points13
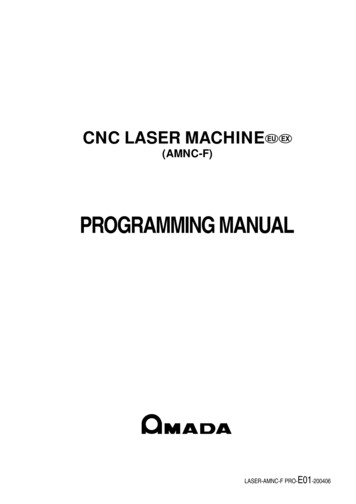
Representative SLR Precision vs TimeSingle Shot Precision, m101st GenerationEODAPCDPSGPMOBLAS 4-8TLRS SystemsMOBLAS 1-31DOSENASA ProgramsEODAP Earth and Ocean Dynamics Applications ProgramCDP Crustal Dynamics ProjectDOSE Dynamics Of the Solid EarthSGP Space Geodesy ProjectTransition from QSwitched Ruby toNd:YAG0.1NASA STALASModelocked Nd:YAG0.010.0011960NASA MOBLAS-4Increased AutomationkHz SLR2000 ConceptNASA MOBLAS-4NASA MOBLAS-4Microchannel PlateHP5370 TIUPhotomultiplier1970First Daylight Ranging(1969)19801990kHz SystemsGraz, NGSLR20002010YearRed Curve nominal best International SLR Network accuracies vs time14Blue Triangles key station experiments that eventually led to improved network rangeperformance2020
SLR Link Equation p 2 Et21 Ar T 2T 2 ns texp 2 2 2 r c a c h ( d R) 24 R d 1 j d ns detected satellite photoelectrons per pulseEt laser pulse energyh laser photon energy 3.73 x 10⁻¹⁹J @ 532 nm (Doubled Nd:YAG) t transmitter optical throughput efficiency d Gaussian beam divergence half angleR slant range between station and satellite (signal decreases as 1/R4) p laser beam pointing error j RMS tracking mount jitter satellite optical cross-section sole link contribution of space segmentAr Telescope Receive Area.To maintain the same r receiver optical throughput efficiencysignal strength, the c detector counting efficiencysatellite cross-sectionTa one way atmospheric transmissionmust increase as R4Tc one way cirrus cloud transmission*Reference: J. Degnan, “Millimeter Accuracy Satellite Laser Ranging: A Review”, in Contributions of SpaceGeodesy to Geodynamics: Technology Geodynamics, 25, pp. 133-162, 1993.15
Corner Cube RetroreflectorsHollow Cube CornerSolid Cube CornerCube corner retroreflectors reflect light back to the point of origin in a narrow beam.Increasing the size and/or number of reflectors increases the return signal strength. 16
Three Types of Cube CornersTypeAl Back-Coated SolidUncoated Solid (TIR)HollowFrequency of UseMost CommonOccasional UseNot currently used in the visibleSatellite ExamplesMost satellitesApollo, LAGEOS, AJISAI, ETS-VIIIADEOS RIS, REM, TESReflectivity, 0.780.93Can approach 1.0Polarization SensitiveNoYesNo – metal coatingYes-dielectric coatingWeightHeavyHeavyLightFar Field PatternWideWideNarrowIssuesMetal coatings absorb sunlightand create thermal gradients. Notas well shielded at high orbitalaltitudes.Fewer thermal problems but TIR“leaks” at incidence angles 17o.Polarization effects reduce crosssection by factor of 4.Thermal heating and gradienteffects on joints17
Peak Cross-Section of a Perfect Cube CornerFor normally incident light, a single unspoiled retroreflector (cube corner) has a peak, onaxis, optical cross-section defined by 4 Acc2 3 D 4 4 cc Acc 2 4 2 where the reflectivity of the cube corner, , is typically equal to 0.78 or 0.93 for aluminumcoated back faces and uncoated Total Internal Reflection (TIR) surfaces respectively , Accis the collecting aperture of the corner cube, D is the cube diameter, and 4 / is the onaxis reflector gain and is the effective solid angle occupied by the Far Field DiffractionPattern (FFDP) of the retroreflector.Blue TIR; Red Aluminum11Peak Cross-section,square meters1 101.5101 1091 1081 1075.8 1071 1061 1051 100123456The peak optical cross-section rises rapidly asthe retroreflector diameter to the fourthpower. For the popular 1.5 in (38 mm)diameter cube with a physical cross-section of0.001m2, the peak optical cross-section isabout 5.8 x 10⁷ m2, an increase of over tenorders of magnitude.Retroreflector Diameter, inches18
Retroreflector Far Field Diffraction Pattern(FFDP)For a uniformly illuminated circular aperture, the FFDP of the reflected wave is thefamiliar Airy Function given by2 J (x) ( x ) cc 1 x 2where J1 (x) is a Bessel function and the argument x is related to the off-axis angle byx Dsin 532 nm is the most widely used SLR laser wavelength, and D is the cube aperture diameter.Normalized Cross-Section vs Angle Theta1.6Normalized Cross-Section vs Angle Theta13.80.90.80.70.60.50.50.40.30.2Normalized Cross-SectionNormalized Cross-Section13.870.10.01 31 10 41 10 51 100.10 60246x pi*D*sin(theta)/lambda8101 100246810x pi*D*sin(theta)/lambdaThe half-power and first null occur at x 1.6 and 3.8 respectively. For the popular 1.5 in (38 mm) diametercube at 532 nm, this corresponds to 7.1 and 16.9 microradians (1.5 and 3.5 arcsec) respectively.19
Peak Cross-Section vs Incidence Angle(Hollow Cube vs Coated Fused Silica)At arbitrary incidence angle, θinc , theeffective area of the cube is reduced bythe factor ( inc ) 2 (sin 1 2 tan ref )cos incwhere inc is the incidence angle and ref isthe internal refracted angle as determinedby Snell’s Law, i .e. ref sin 1 sin inc n where n is the cube index ofrefraction. The quantity is given bythe formula 1 tan 2 refThus, the peak optical cross-section inthe center of the reflected lobe falls offas2 eff ( inc ) ( inc ) cc The 50% and 0% efficiency points forfused silica (n 1.455) are 13o and 45orespectively. The 50% and 0% efficiency points fora hollow cube (n 1) are 9o and 31orespectively. In short, hollow cubes have a narrowerangular response range than solidcubes.20
Effect of Incidence Angle on the FFDPNormal IncidenceRetro Face Seen byIncident RadiationFar FieldDiffraction PatternD 3.8 / DNon- Normal IncidenceD ( inc) 3.8 / D ( inc)21
Ground Calibration TargetsAll SLR stations make use of acalibration scheme to initially determine,and then monitor changes in, opticaland/or electronic system delays thatmight be caused by changes inhardware or environmental conditions(e.g. temperature). The most commonapproach is to place a singleretroreflectoratsomecarefullymeasured distance from the system“invariant point”, defined as theintersection of the elevation and azimuthaxes of the telescope assembly. Theretro acts as a point source with a deltafunction response. This distance isusually measured at the 1 or 2 mm levelusing accurate ground surveyingtechniques. Subtracting the knowntarget range from the measured rangeprovides a “range correction” which isthen applied to all future satellitemeasurements.Formaximumaccuracy, calibrations are typicallyperformed hourly.22
Starlette and LAGEOS*Since, for maximum accuracy orbit determination, the distance of the effective light reflectionpoint from the satellite center of mass is ideally independent of the viewing angle, geodeticsatellites are typically spheres embedded with retros. Furthermore, since the signal strengthdecreases with satellite range as 1/R4 , the sphere diameter is increased to accommodatemore retros and meet cross-section (signal strength) requirements.StarletteCNES, FranceLaunch: 1975Diameter: 24 cmNumber of Retros: 60LAGEOSNASA, USALaunch: 1976Diameter: 60 cm23(4 Ge for NIR)Number of Retros: 426* LAGEOS-2 (Italy) was launched from the NASA Space Shuttle in 1992.
Satellite Contribution to the Range Variance24 slightly depending onNote that the satellite impulse response (range variance) will varywhere the line of sight between the station and the satellite CoM falls within the array.
Impulse Response in the Large Satellite Limit (Rs nL)J. Degnan, Contributions of Space Geodesy to Geodynamics: Technology, Geodynamics 25, pp. 133- 162 (1993)In the following graph, is a time normalized to the time it takes a light pulse totravel the diameter of the satellite, i.e. 2Rs/c. Increasing the radius of the satelliteto make it appear flatter will increase the cross-section but broaden the impulseresponse. However, narrowing the incidence angle response by using hollowcubes or recessing the solid cubes reduces the width of the satellite impulseresponse (range variance) and improves range accuracy. However, the largersatellite radius increases the number of retros illuminated by the laser and hencethe effective cross-section.Larger radius satellite withnarrow incidence angle rangehas higher cross-section andnarrower impulse response.Larger radius satellite withsame incidence angle rangehas much higher cross-sectionand broader impulse response.25
SLR Missions and OrbitsThe current SLR constellation spans a widerange of altitudes (500 km to 36,000 km) andinclinations and each retroreflector array has tobe designed accordingly based on orbital altitude,mission goals, desired signal strength, etc. Thesatellites typically fall into four altitude realmswith very different science goals:1. Low Earth Orbiting (LEO: h 1,500 km)Higher Order Gravity Field StudiesSpaceborne Radar/Lidar Orbital Support forobserving terrain, sea/ice levels, etc.2. Medium Earth Orbiting (MEO: h 6,000 km)Low drag MEO satellites such as LAGEOS 1and 2 are ideal for observing relative stationpositions, tectonic plate motion, regional crustaldeformation, etc.3. Global Navigation System Satellites (GNSS:h 20,000 km)SLR provides Orbital support to InternationalNavigation Constellations such as GPS (US),GLONASS(Russia), GALILEO (EU),COMPASS/BeiDou (China), etc and26 of GNSS orbits andenhances the accuracyground networks4. Geosynchronous (GEO: h 36,000 km)
Velocity Aberration If there is no relative velocity between thestation and satellite, the beam reflected by theretroreflector will fall directly back onto thestation . However, a relative velocity, v, between thesatellite and station causes the reflectedbeam to be angularly deflected from thestation in the forward direction of the satellitemotion by an anglea 2v/c. Since small diameter cubes have smalloptical cross-sections but large angle FFDPs ,the signal at the station is not significantlyreduced by velocity aberration. On the other hand, large diameter cubes withhigh cross-sections have small angle FFDPs,and the signal at the station is thereforesubstantially reduced by velocity aberration. In general, the signal is reduced by half ormore if the cube diameter, Dcc, satisfies theinequality1.6 0.8 cDcc D1 / 2 a v27
Velocity Aberration vs Orbital AltitudeJ. Degnan, Contributions of Space Geodesy to Geodynamics: Technology, Geodynamics 25, pp. 133- 162 (1993)If there is a relative velocity between the satellite and the station, thecoordinates of the FFDP are translated in the direction of the velocity vector. vThe magnitude of the angular displacement in the FFDP is given bya (hs , zen , ) a max (hs ) cos 2 2 (hs , zen )sin 2 Satellitep zenrStationwhere the maximum and minimum values are given by2vs 2gRE2a max (hs ) a (hs ,0,0) cc RE hsa min (hs ) a (hs ,70o ,90o ) a max (hs ) (hs ,70o ) (hs , zen ) Geocenter2 R sin zen 11 ER h Es cos r x p v Alpha: Max Red (EL 90 deg); Min Blue (EL 20 deg) 1LAGEOSGNSS50Alpha, microradiandvs satellite velocity at altitude hsRE Earth radius 6378 kmg surface gravity acceleration 9.8m/sec2hs satellite height above sea levelc velocity of light 3x10⁸ m/sec zen largest satellite zenith angle for tracking 70or unit vector to satellite from the geocenterp unit vector from station to satellitev unit vector in direction of satellite velocity55454035GEO302520150.1110Satellite Altitude, Thousands of km10028
“Spoiled” Retroreflectors “Spoiling” is used to compensate for velocityaberration and improve the signal return from thesatellite. If we offset one or more (N 1 to 3) of the cubedihedral angles from 90o by an amount , the centrallobe of the FFDP splits into 2N spots. If n is the cube index of refraction, the mean angulardistance of the lobe from the center of the original Airypattern increases linearly with the dihedral angleoffset, , according to4 6n 3.27n 3 As before, the angular size of any given lobedecreases as the cube diameter gets larger. The FFDP of each lobe is the 2D Fourier transform ofan individual 60o sector. The energy distribution iscomplex but has hexagonal symmetry if all three sare equal. Furthermore, the effective area and peak crosssection of each lobe is reduced toAAeff ( inc ) cc2N peak 2 ( inc )Circular CubeSectorHexagonalCubeLobe cc(2N )229
ClockingSince the return signal is weakest at the lowest elevation tracking angle, choosing γ αminplaces the peak of the lobe there but any lobe energy inside the inner dark ring is wasted.Filling in circumferential gaps between lobes can be accomplished by rotating an adjacentcubes by an angle equal to 60o divided by an integer greater than 1. A smaller lobediameter will reduce the spillover into the region outside the outermost dark circle but willalso create a larger gap between lobes which in turn requires more clocking positions.0o Clocking a min30o Clockinga nmi30
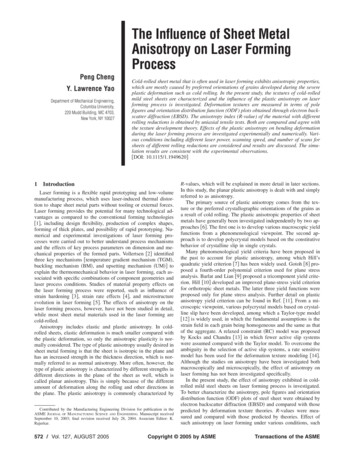
Lunar Retroreflector ArraysFive retroreflector arrays were placed on the lunar surface beginning with Apollo 11 in 1969. Two othermanned Apollo missions (14 and 15) also left arrays with Apollo 15 being the largest (300 vs 100 cubes) tostrengthen the return signal. Two unmanned Soviet Lunakhod (17 and 21) missions landed additional arraysprovided by France. Because the Moon is so far away and maintains a fairly constant angular orientationwith respect to the Earth, flat reflector panels could be used.Apollo 11, 1969Apollo 15Array31Retroreflector Array SitesLunakhod
Apollo 15 Lunar ExampleEarth-Moon Distance : REM h RE 384.4 x10⁶ m. From the previous equationsamax 6.74 rad or 1.40 arcsecamin 6.68 rad or 1.39 arcsec at an elevation angle of 20 degreesv relative velocity between target and station due to lunar orbital motion 1km/secHowever, the latter equations ignore the small contribution of station motion due to Earth rotation( 0.46 km/sec) to the relative velocity which typically reduces a to 4 or 5 rad for LLR but is negligiblefor LEO to GEO satellites.If the Apollo reflector arrays are pointed at the center of the Earth, the maximum beam incidenceangle on the array from any Earth station (ignoring lunar libration) is RE REM inc a tan 0.95 deg The unspoiled cube diameter for which thecross-section falls to half its peak value isD1 / 2 40.6mm 1.6inTypical manufacturing tolerances are 0.5 arcsec fordihedral angles and /10 for surface flatness.Apollo 15 has a flat array of 300 38 mm fused quartz cubes each with an unspoiled peakcross-section of 5.8 x 10⁷ m2. Thus, the theoretical array cross-section, ignoringmanufacturing tolerances and local environment effects, is 300(0.5)(5.8 x 10⁷ m2) 8.7x10⁹ m2. According to Dave Arnold, polarization losses due to uncoated TIR faces reducecross-section by factor of 4, leaving 2. 2x10⁹ m2 . The tabulated ILRS value is 1.4x10⁹ m2.32
Lunar Alternative to Apollo ArrayOtsubo et al, Advances in Space Research, Vol. 45, pp. 733-740, 2010.According to the authors, simulations indicate that a single reflector with a diameter of 150to 250 mm has similar performance to Apollo arrays. No dihedral angle is required for smalldiameter reflectors ( 150 mm for coated and 100 mm for uncoated and hollow reflectors). Larger diameters required dihedral angles 0f 0.20, 0.25, and 0.35 arcsec for coated,uncoated, and hollow reflectors respectively.250 mm reflectors with 0.25 arcsec dihedral angles, incidence angle 6 degrees33
Lunar Laser Ranging Currently five passiveretroreflector arrays werelanded on the Moon by– 3 NASA manned Apollomissions (11,14, and 15)– 2 Soviet Lunakhod missions(1 and 2) For over 30 years, the LLRdata set was provided by onlythree sites:– MLRS, McDonaldObservatory, Texas, USA– CERGA LLR, Grasse, France– Mt. Haleakala, Hawaii, USA(decommissioned in 1992) MLRS ranging to the MoonNew LLR systems have sincecome online:– MLRO, Matera, Italy– Apollo, Apache Point, NewMexico, USA (multiphoton,3.5 m telescope)34
LLR Range Precision vs Time35
GNSS and Geostationary SatellitesGNSS and Geosynchronous Satellites have some features in common with LLR:1. Their orbital altitudes correspond to several Earth radii2. They generally perform a utilitarian function (e.g. Earth observation,communications, navigation, etc. ) which keeps the nadir side of the satelliteapproximately facing the Earth CoMTheir differences from LLR are :1. The range in velocity aberration, a amax - amin, is 4 to 5 times larger (20 to25 rad)2. For a maximum zenith tracking angle of 70o, beam Incidence angles can varyfrom 0 to where RE sin(1100 ) RE h a sin 13.1 deg for GNSS satellites at 20,000 km 8.2 deg for GEO satellites at 36,000 kmThe smaller range of incidence angles ensures: (1) near maximum strength returns from aplanar array; and (2) limited pulse spreading, especially if the array is compact in sizeand the retros are densely packed together to achieve the required cross-section.Nevertheless, the maximum flat panel induced spreading per linear foot of array due tozenith tracking angle is still 474 psec (7 cm) and 292 psec (4.4 cm) for GNSS and GEOsatellites respectively. This spreading can increase further if satellite attitude deviationsfrom true nadir extend the range of incidence angles. Furthermore, the temporal responseof a flat rectangular or square panel varies with both satellite zenith and azimuthal angle36
Space Segment Summarymm Accuracy LEO to MEO Geodetic Satellites Use large radius spherical satellites to: better match the incoming plane wave and minimize pulse spreading allow more reflectors within the active area to increase cross-section Reduce range of accepted incidence angles to minimize satellite impulse response width via Hollow cubes or Recessed hollow or solid cubes Also incidence angles 17o do not leak light in solid TIR reflectors Selection of cube diameters and clocking to best match the “a annulus” while favoring theresponse at high zenith (low elevation) angles is key to efficient array designGNSS and GEO Satellites Typically have a nadir face pointed near Earth center due to other functions (Earthobservation, communications, navigation, etc.) Flat panels OK but still several hundred psecs of temporal spread at lower satellite elevationangles. Flat circular (rather than rectangular) arrays would reduce azimuthal range biases. Range accuracy would further benefit from replacing flat panels by segments of a largesphere to eliminate satellite zenith angle variations.LLR Characterized by small incidence angles ( 1 deg ignoring lunar librations) and velocityaberrations ( 1.0 arcsec) suggest the possible use of large diameter cubes provided thermalissues on the lunar surface can be resolved.37
Laser Transponders:Laser Ranging Beyond the Moon Given the current difficulty of laser ranging to passive reflectors onthe Moon, conventional single-ended ranging to passive reflectors atthe planets is unrealistic due to the R-4 signal loss in the linkequation. Since double-ended laser transponders have active transmitters onboth ends of the link, signal strength falls off only as R -2 makingprecise interplanetary laser ranging and time transfer possible.Furthermore, since most of the link burden (laser power, telescopeaperture) can be carried by the Earth station, the space terminal canbe relatively modest in size, weight, and power consumption .38
Asynchronous Ranging and Time R c(tME tEM)/2 c [(tE2-tE1) (tM2-tM1)]/2Clock Offsetdt [(tE2-tE1)-(tM2-tM1)]/[2(1 R/c)]*J. Degnan, J. Geodynamics, 34, pp. 551-594 (2002).39
Two-Way Transponder Experiment to theMessenger Spacecraft (May/June 2005)*GSFC 1.2 Meter TelescopeMessenger Laser Altimeter(MLA) enroute to Mercury24.3 Million KmRange Accuracy 20 cmScience/Analysis/SpacecraftGround StationDavid SmithMaria ZuberXiaoli SunJan McGarryGreg Neumann John CavenaughTom Zagwodzki John Degnan40D. Barry Coyle*D. E. Smith et al, Science, January 2006.
One-Way Earth-to-Mars LaserTransponder Experiment (Sept. 2005)80 Million Km! 500 laser pulsesobserved at Mars!GSFC 1.2 Meter TelescopeGround StationXiaoli SunJan McGarryTom Zagwodzki John DegnanMOLA at MarsScience/Analysis/SpacecraftMarsOrbiter Laser AltimeterDavid SmithMaria Zuber(MOLA)Greg Neumann Jim Abshire41
Transponder Link Parameters*ExperimentRange (106 km)Wavelength, nmMLA (cruise)MOLA (Mars)24.3 80.010641064Uplink DownlinkUplink1065Pulsewidth, nsec1620150Pulse Energy, mJ240856Repetition Rate, Hz3.840.168.4Laser Power, W6010050Full Divergence, rad2.0421.0030.196Receive Area, m20.000670.020.0294EA-Product, J-m20.1610.1601.64PA-Product, W-mTable 1: Summary of key instrument parameters for recent deep space transponderexperiments at 1064 nm.Note that the PA-product for the MLA space and Earth terminals areroughly the same and most of the link burden for the uplink anddownlink is borne by the Earth terminal.42*J. Degnan, Int. J. Modern Physics D, 16, pp. 1-14 (2007).
BackupSlides43
Two Way Transponders*tt EMM1tdt M2Moon tM1tM2t MEtEMMARStMEEARTHEarth Echo Transponders (R 1 AU)–––tE1t E2t E1Spacecraft transponder detects pulsesfrom Earth and fires a reply pulse backto the Earth station.To determine range, the delay td mustbe known a priori (or measuredonboard and communicated back toEarth) and subtracted from themeasured round-trip time-of-flight atthe Earth station.Works well on “sho
Switched Ruby to Nd:YAG NASA Programs EODAP Earth and Ocean Dynamics Applications Program CDP Crustal Dynamics Project DOSE Dynamics Of the Solid Earth SGP Space Geodesy Project SGP 1960 1970 1980 1990 2000 2010 2020 0.001 0.01 0.1 1 10 Year S i n g l e S h o t P r e c i si o n, m