Transcription
View metadata, citation and similar papers at core.ac.ukbrought to you byCOREprovided by CERN Document ServerStar Formation Triggering Mechanisms in Dwarf Galaxies:The Far-Ultraviolet, Hα, and HI Morphology of Holmberg IISusan G. Stewart1U. S. Naval Observatory, 3450 Massachusetts Ave NW, Washington, DC 20392-5420Michael N. FanelliDept. of Physics, University of North Texas, Denton, TX 76203Gene G. ByrdDept. of Physics and Astronomy, University of Alabama, Tuscaloosa, AL 35487Jesse K. HillHughes STX, 4400 Forbes Blvd., Lanham, MD 20706David J. WestpfahlDept. of Physics, New Mexico Institute of Mining & Technology, Socorro, NM 87801Kwang-Ping ChengDept. of Physics, California State University, Fullerton, CA 92634Robert W. O’ConnellUniversity of Virginia, P.O. Box 3818, Charlottesville, VA 22903Morton S. RobertsNational Radio Astronomy Observatory, Edgemont Rd., Charlottesville, VA 22903Susan G. Neff, Andrew M. Smith, and Theodore P. StecherLaboratory for Astronomy and Solar Physics, NASA/GSFC, Greenbelt, MD 20771ABSTRACTFar-ultraviolet (FUV), Hα, and HI observations of dwarf galaxy Holmberg II areused to investigate the means by which star formation propagates in galaxies lacking1 NASASpace Grant Fellow, University of Alabama 1995-19971
global internal triggering mechanisms such as spiral density waves. The observationstrace the interaction between sites of massive star formation and the neutral and ionizedcomponents of the surrounding ISM in this intrinsically simple system. Both local andlarge-scale triggering mechanisms related to massive star formation are seen, suggestingthat feedback from massive stars is a microscopic process operating in all galaxies to acertain degree.The data emphasize the importance of local conditions in regulating star formationfrom evidence such as massive stars inside ionized shells, compact HII regions surrounding aging clusters, and stars formed in chains of progressing age. Surface brightnessprofiles show current activity correlates with the time averaged level of past star formation at a given radius demonstrating a reliance on local conditions. Large-scale triggeringby HI shells is supported by observations of progenitor populations as well as secondarysites of star formation associated with their dense rims. Analysis of the energy available from massive stars inside HI shells indicates energy deposited into the ISM fromsupernovae and stellar winds is sufficient to account for the HI morphology. Ages ofindividual star forming regions are derived using B, Hα, and FUV photometry and showboth older, diffuse FUV regions and younger, compact HII regions. The distribution ofages is reconciled with the HI morphology, showing a clear preference of young regionsfor areas of dense HI and old regions for HI voids. Global kinematical properties may alsoplay a role in the star formation process since differences in the rotation characteristicsof the neutral gas disk correlate with differences in triggering mechanisms. Large-scalefeedback from massive stars is shown to operate in regions that lack differential shear inthe gas disk.Subject headings: galaxies: individual (DDO 50) – ISM: HII regions, bubbles – stars:formation – ultraviolet: general2
1.to its low surface brightness (van den Bergh 1959).Although it is slightly too bright to fit the magnitudecriterion of a “true dwarf” galaxy of MB 16 (Nilson 1973), it is usually referred to as a dwarf galaxyin the literature. IRAS observations of HoII suggest aminimal presence of dust, so little hidden star formation is taking place (Hunter et al. 1989). The galaxyhas a low metal abundance, Z/Z 0.4 (Hunter &Gallagher 1985), similar to that of the Large Magellanic Cloud (LMC). Hodge et al. (1994) find that thesizes of HII regions as well as their size distributionare statistically normal in comparison to galaxies ofthe same type, distance, and luminosity. HoII has aHI envelope extending to 1.5 DHo , where the Holmberg diameter (DHo ) is the diameter defined by the Bisophote at 26.6 mag arcsec 2 . The HI morphology ofHoII is intriguing due to the various shells and holespresent throughout the galaxy (Puche et al. 1992).Hoessel et al. (1998) estimate a distance of 3.05Mpc using 28 Cepheid candidates. This is differentthan the distance estimate of 3.63 Mpc determined byFreedman et al. (1994) for M81 using Hubble SpaceTelescope observations of Cepheid variables. SinceHoII is likely the closest member of the M81-NGC2403 group, 3.05 Mpc is adopted for the distance ofHoII. Table 1 summarizes the parameters assumed forthe galaxy in this study.Observations in the vacuum ultraviolet (UV, λλ912 - 3200 Å) isolate hot sources from the underlying optical cool star background in galaxies. Ultraviolet observations allow direct detection of youngmassive stars, which are responsible for the majority of photoionization, photodisassociation, elementalsynthesis, and kinetic energy input in galaxies. TheUV observations used in this study are in the FUVwindow (λλ912 - 2000 Å) and are particularly useful in characterizing high-mass star formation sincethe dominant luminosity sources at 1500 Å are OBstars with mass M 5 M (Fanelli et al. 1992).Understanding the UV morphology and its relationto the star formation process has broad implicationsconsidering that the rest frame FUV is detectable athigh redshift, z 3, with optical and IR instruments.O’Connell (1997) stresses that determining a “morphological k-correction” for galaxies is needed to assess the morphology of distant objects. Therefore,understanding the processes responsible for the UVemission in nearby systems will play an importantrole in advancing our understanding of galaxy evolution.IntroductionThe pervading questions surrounding our currentview of large-scale star formation are primarily associated with the need to understand the mechanism fortriggering and globally maintaining star formation.The first step in forming a fundamental theory to describe star formation in all environments is understanding the process in intrinsically simple systems.This study utilizes a unique observational dataset toexplore the processes which may influence new starformation and its relation to the ISM within a relatively uncomplicated dynamical environment. Farultraviolet (FUV), Hα, and HI images of dwarf galaxyHolmberg II (HoII) are used to gain new insight intothe star formation process by studying the interconnection between massive star formation and the ionized and neutral components of the galaxy’s ISM.Irregular galaxies lack a dominant internal globaltriggering mechanism for cloud compression and starformation such as density waves, yet exhibit a widerange of star formation activity. Non-interactinglow surface brightness late-type galaxies, includingMagellanic-type irregulars (Im), are ideal for thisstudy due to the limited number of global internalprocesses influencing star formation while at the sametime having star formation rates per unit area similarto much more massive spiral galaxies (Hunter 1997).Due to their small size, the amount of energy inputper a given star formation event has a pronouncedeffect on the global ISM. Instabilities in the ISM introduced by massive star formation may play an important role in the star formation process in thesesystems. They display relatively uncomplicated internal gas dynamics, generally characterized as slowsolid body rotation. These characteristics create anenvironment of reduced shear allowing features in theISM to be longer lived. They often possess huge gasenvelopes extending well beyond the optical regime ofthe galaxy. Large vertical scale heights allow featuresin the ISM to grow to large sizes before breaking outof the HI layer. In addition, these systems allow forthe test of star formation models at very low metallicities. For these reasons, late-type low surface brightness galaxies are powerful tools for understanding thestar formation process and galaxy evolution.The apparently non-interacting Im-type galaxy HoII(DDO 50, UGC 4305) is a member of the M81-NGC2403 group of galaxies. The galaxy is classified as aDavid Dunlap Observatory (DDO) dwarf galaxy due3
ParameterOptical CenterDynamical nPosition AngleAxial Ratio, q b/aABAFUVValue8h 13m 53.s 570 520 13008h 13m 53s70 520 47.00 33.05 Mpc 16.5241 177 0.740.100.20ReferenceDressel & Condon (1976)Westpfahl (1997)Hoessel, Saha, & Danielson (1998)RC3, de Vaucouleurs et al. (1991)Puche et al. (1992)Puche et al. (1992)Huchtmeier & Richter (1988)RC3, de Vaucouleurs et al. (1991)This studyTable 1: Adopted Parameters for Holmberg IIthe Ultraviolet Imaging Telescope (UIT) which flew asa member of the ASTRO Observatory on two Shuttlemissions in December, 1990 and March, 1995. Together, a total of 35 FUV images of galaxies exhibiting recent star formation were observed. The 300 spatial resolution of the UIT was a 5 20 timesimprovement over previously available UV imagery.Besides the Apollo 16 UV image of the LMC in 1972(Page & Carruthers 1981), the only other UV image of a galaxy similar in type to HoII prior to theASTRO-2 mission was the dwarf galaxy Holmberg IX.It was serendipitously observed during the ASTRO-1mission due to its close proximity to M81. Using theUV data, Hill et al. (1993) characterized the most recent star formation event, confirming that no recentstar formation was occurring in Holmberg IX. Duringthe second flight of the UIT, a dwarf galaxy programwas initiated. The results of this program were firstpresented by Gessner et al. (1995). Detailed analysisof all of the UIT dwarf galaxy targets is presented byStewart (1998).Global photometry of the galaxy is given in §3 andthe radial surface brightness profiles in §4. Photometry of individual star forming complexes along withtheir derived ages and internal extinctions are presented in §5. Comparisons between the relative morphologies of the FUV and Hα emission are given in§6 and that of the FUV and HI in §7. The principalresults are summarized in §8.This study addresses several issues which Hunter(1997) stresses are vital to an improved understandingof star formation processes within irregular galaxies.These key issues are tied to the need for a better understanding of the regulation mechanism for star formation on global and local scales, including a quantitative description of both the feedback processes operating in irregular galaxies and the impact which hugestellar complexes have on the surrounding ISM. Morphological comparisons between the FUV flux andother radiation linked to star formation provide valuable information regarding the interaction between astar forming site and its surrounding medium. For example, the ratio of the FUV and Hα emission from ayoung star forming region is indicative of the clusterage. The suggested link between massive star formation and HI shells can be studied via the relativeFUV and HI emission morphologies. Since the FUVis able to isolate the massive stellar component overtimescales similar to the kinematic ages of HI shells,this comparison could identify a progenitor population. Understanding if characteristic differences inthe ISM are related to differences in star formationmechanisms is another important issue. The FUVimage can be used to probe the possible relationshipbetween massive star formation and the kinematicsof its HI disk. The intrinsic dynamical reduction ofshear in the gas disks compared to spiral galaxies mostlikely influences the overall star formation rate.Despite the wealth of information provided by UVimages, they are seldomly used in star formation studies because spatially-resolved UV images are rare.The FUV images used in this study are provided by4
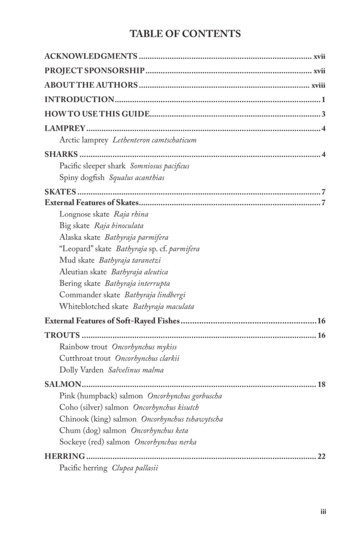
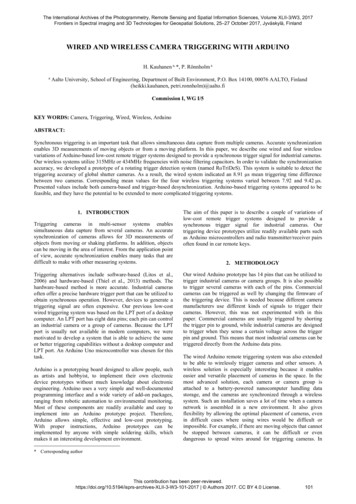
2.by Hunter & Gallagher (1985). This correction is applied using the calibration technique of Waller (1990)and observations of the Hα standard star BD 8 2015(Stone 1977). Attempting to reproduce the irregularapertures defined by Hodge et al. (1994) for H IIregions in HoII provides a check for the Hα calibration constant. Our photometry of these regions agreewithin 9 %. Deviations may be caused by failureto reproduce the irregular apertures exactly. An Hαemission image is produced by scaling stars in the Hαimage with those in the R-band image and subtracting the stellar continuum component.The 21 cm images were obtained with the VLAB, C, and D arrays. The uniformly weighted columndensity map has a spatial resolution of 400 4.00 5, corresponding to a spatial resolution of 60 pc at the distance of HoII. This image is used in the Puche et al.(1992) study of HoII where a complete description ofits observational characteristics is given.Observations and Data ReductionHolmberg II was observed by the UIT during theASTRO-2 mission in March, 1995. Table 2 summerizes the observations of the galaxy used in this study.The targets were observed using the broad-band UITB1 filter, which has λef f 1521 Å and λ 354 Å.The images were recorded on IIaO film and digitizedwith a PDS microdensitometer at Goddard SpaceFlight Center, producing 2048 2048 pixel imageswith scale 1.00 14 pixel 1 . The images were calibratedusing IUE spectrophotometry of stars observed by theUIT. The FUV magnitudes are computed from FUVflux using mF U V 2.5 log10 (FUV) 21.1, whereFUV is the incident flux in erg (cm2 Å s) 1 . Thechief photometric uncertainties are in the form of lowlevel nonuniformities introduced via the developmentand digitization processes. Uncertainty in the absolute calibration can lead to uncertainties of up to 10 15 % in the FUV flux. A detailed discussion of thereduction of the UIT data to flux-calibrated arrays isgiven by Stecher et al. (1992, 1997).The FUV background level (µ 25 mag arcsec 2 )is checked by taking the mean of 20, 20 20 pixelboxes in areas void of any galaxy or stellar flux. TheFUV background level is minimal, 0.0 0.4 analogdata units (ADU’s). The UIT has limited accuracy atthe lowest light levels. The error in the backgroundlevel reflects this intrinsic uncertainty.CCD observations of HoII were obtained in theJohnson U and B bands, and the Kron-Cousins R andHα bands with San Diego State University’s 1.0 mtelescope at the Mount Laguna Observatory (MLO).The optical images are median combined with at leasttwo other images having the same exposure time toremove cosmic rays and other defects. Astrometryand photometry are implemented using standard IDLprocedures for data reduction. Background values aredetermined for each image by taking the mean of pixels in 20, 10 10 pixel boxes. The HoII broad-bandimages are calibrated using unpublished photoelectric photometry of three bright stars in the galaxy(Corwin 1997). Total magnitudes given in the RC3agree with our measured values within reasonable limits providing a check of the calibration constants.The Hα filter at MLO has a centroid wavelength6573 Å and width 61 Å which includes the [N II] lines.A correction for this contribution to the Hα flux ismade by assuming f (Hα) / (f (Hα ) f ( [N II] )) 0.88, based on spectral observations of H II regions3.Global PhotometryIn Figure 1a the 10.0 0 10.0 0 FUV image of HoIIis presented. The FUV morphology is quite patchywith the brightest features contained in a central starforming arc. There is a region of diffuse FUV emissionextending to the southwest and three separate patchesof FUV emission to the north of the central arc.Since galaxies at high redshift are seen in the restframe FUV with optical instruments, the FUV image is compared to the R-band image in Figure 1b toillustrate the importance of understanding the FUVmorphology of local galaxies. The R-band image ofthe galaxy exhibits a relatively smooth distributionof light compared to the irregular distribution shownby the FUV image. The true optical morphology ofa high redshift galaxy could be quite different thanthat observed in the optical bands.Integrated magnitudes of HoII are obtained using elliptical apertures whose shape and orientationare based upon the derived HI structural parametersgiven in Table 1. The dynamical center is adopted asthe aperture center since it has more physical significance than the optical center, especially when comparing integrated parameters from observations ranging from the R-band to the FUV. The optical magnitudes are derived using images with the foregroundstars masked, the brightest of which are given the average flux from the surrounding medium. Therefore,the derived magnitudes may be slightly less than pub-5
TelescopeUITMLOMLOMLOMLOFilterFUV (B1)UBRHαExposureTime (s)13101200300120600DateMar 11, 1995Nov 2, 1995Feb 24, 1995Feb 24, 1995Feb 24, 1995Table 2: Summary of Observations for Holmberg II3.1.lished catalog values. Since the FUV image is freefrom foreground star contamination, foreground starsare masked from optical images in order to make atrue comparison with the FUV band. The total integrated magnitudes, corrected for Galactic extinction,Ag , are given for each bandpass in Table 3. Galacticextinction in the FUV is derived assuming the Galactic reddening curve of Savage and Mathis (1979) integrated over the UIT B1 bandpass. These are related by AFUV / E(B V) 8.33 (Hill et al. 1997).The errors account for the photometric uncertaintyand 7% uncertainty in the distance estimate. Corrections for internal extinction will be discussed later(§5.2).The FUV magnitude is at the faint end of the rangeof absolute magnitudes observed by the UIT. In asample of 35 galaxies exhibiting recent massive starformation, the range of observed absolute magnitudesspans from 17 to 22 (Fanelli et al. 1997b). Thecorresponding FUV B 1.74 0.03 color falls intothe range observed by FAUST (a balloon-born UVcamera) for a sample of Im-type galaxies (Deharvenget al. 1994).The integrated FUV flux as a function of radiusprovides information regarding the concentration ofrecent massive star formation. The FUV growthcurve, corrected for Galactic extinction, is shown inFigure 2. It illustrates that recent massive star formation is not particularly centrally concentrated inHoII despite the presence of the prominent centralstar forming arc. The aperture containing this feature in its entirety (1.0 7) only contains 43% of thetotal FUV flux. Therefore, massive star formationextends well beyond the central star forming arc.Global Star Formation RatesThe intrinsic emission of a young stellar populationcan be translated into a global star formation rate(SFR) by comparing integrated fluxes with predictions from stellar population synthesis models. Thetimescale characterized by a given SFR depends uponthe bandpass of the observation since the luminosity of a single generation of stars decays roughly asa power law (O’Connell 1997). The Lyman continuum (Balmer emission lines) describes the SFR over atimescale 5 Myr while the UV continuum characterizes the SFR over a 100 Myr timescale. Since massivestars (M 10M) are the ionizing sources for the Ly man continuum, observed here via the Hα recombination line, and the UV emission is dominated by stars 5M , the SFR derived using these bandpasses describes the formation history of massive stars. Latetype irregular galaxies are dominated by short-livedmassive stars and are therefore excellent sources toprovide an estimate of the SFR using either FUV orHα observations.The global SFR for massive stars in HoII is derived using both the integrated FUV and Hα fluxby applying formulae which convert the integratedlight from each bandpass to an estimate of the globalSFR. These formulae are taken from Kennicutt (1998)who provides a self-consistent set of formulae for various regimes based on the calibration of Madau et al.(1998) for a fixed Salpeter (1955) IMF with mass limits 0.1 to 100 M . The observed (not corrected for internal extinction) FUV and Hα luminosity and globalSFR are listed in Table 4. The Hα luminosity andSFRHα agree reasonably well with the values derivedby Miller & Hodge (1994) after differences in distancesare removed.Since internal extinction is not extreme low metallicity systems, the comparison between SFRHα and6
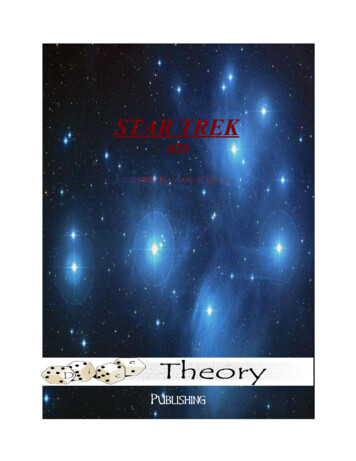
FilterFUVUBRApparentMagnitude9.84 0.0311.48 0.0211.58 0.0210.86 0.01AbsoluteMagnitude 17.58 0.15 15.94 0.15 15.84 0.15 16.56 0.15Ag0.200.120.100.06Table 3: Integrated Magnitudes for Holmberg IINote.—Magnitudes are corrected for Galactic extinction. Optical magnitudes are derived with the foreground stars masked.Log(LHα )39.55Log(LFUV )38.67SFRHαM yr 10.028SFRFUVM yr 10.049SFRFUV /SFRHα1.75Table 4: Global Star Formation Rates for Holmberg IINote.—Rates are not corrected for extinction internal to HoII.ter is important. As with the integrated magnitudes,the dynamical center is chosen as the aperture center instead of the optical center or brightest featurein order to make a uniform physical comparison withother galaxies.SFRFUV is valid to the first order in estimating therecent to current formation history of massive stars.For example, differences in internal extinction effectsbetween the FUV and Hα observations for a givenE(B-V) are likely on the order of AFUV /AHα 4, assuming a LMC extinction curve for internal reddening (this ratio doubles for the SMC extinction curve).This difference translates into a higher SFRFUV thanSFRHα in a given system by underestimating AFUV toa greater degree than AHα . The results indicate the“recent” (traced by the FUV) and “current” (tracedby Hα ) massive star formation rates are comparable.The ratio SFRFUV to SFRHα indicates that the FUVflux traces a slightly larger fraction of massive starformation than the Hα flux, perhaps suggesting HoIIis in a post-burst phase.4.4.1.FUV Surface Brightness ProfilesThe patchy distribution of FUV light shown in theUIT image is represented in the surface brightnessprofiles by pronounced inflections at various radii.The FUV surface brightness profile, shown in Figure 3, has a double peaked shape with a central depression. At the aperture center, the average surfacebrightness is µF U V 21.6 mag arcsec 2 0.11 while atthe first peak, 0.0 9 from the center, the average value isµF U V 21.2 mag arcsec 2 0.03. Surface brightnessmaps of the galaxy indicate that the highest levelsof activity lie in the region responsible for this peak;the brightest knot in the center of the star formingarc has the highest levels, µF U V 18.9 mag arcsec 2in a resolution element (500 ). Following the peak, theprofile exhibits somewhat exponential behavior untilr 20 , where it takes a constant value of µF U V 22.4mag arcsec 2 . The flattening of the profile is due toflux from the group of regions on the eastern side ofthe central star forming arc. A second, yet relativelyRadial Dependence of Star FormationSurface brightness profiles are derived using magnitudes corrected for Galactic foreground extinctionin elliptical annuli 1600 wide. The optical profiles arecreated using images with the foreground star component masked; the brightest of these stars is given theaverage value from their surroundings. To effectivelycompare the behavior of surface brightness profilesof irregular-type galaxies, the choice of aperture cen7
small peak occurs at r 2.70 , after which it falls offsharply. The second peak can be accounted for bythe diffuse patches of emission in the northern part ofthe galaxy.The sample of FUV surface brightness profiles presented by Stewart (1998) offers little uniformity withregard to identifying characteristics for late-type lowsurface brightness systems. It is a relatively heterogeneous group which does not follow either a characteristic R1/4 law or a pure exponential. However, somegeneral trends do emerge which could have important implications in interpreting optical observationsof high redshift galaxies where the observed light isthe redshifted UV continuum. These characteristicsare also exhibited by the HoII profile: generally flatwith inflections associated with prominent star forming complexes, healthy activity far from the galaxycenter, and non-centralized organization of star formation. As compared to FUV profiles of other galaxies observed by the UIT, the HoII profile has characteristics somewhat similar to those of IBm-typegalaxy NGC 4449 (Fanelli et al. 1997a). NGC 4449has an exponential FUV surface brightness profilewith inflections due to blue knots (Hill et al. 1998).The profile does not have a central light depression,but this may be due to the choice of the aperturecenter. Although steeper than the HoII profile, theNGC 4449 profile shows similar characteristic inflections due to star formation at large radii from thecenter.8mFUV R (magnitudes)10121416180Fig. 1.— Registered FUV (A, top) and R-band images (B, bottom) of Holmberg II.123Radius (arcminutes)45Fig. 2.— The FUV growth curve of Holmberg II.8
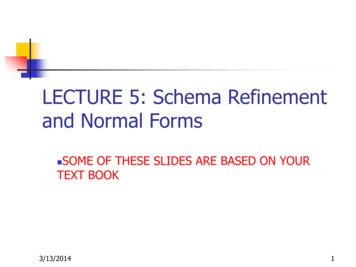
4.2.Optical Surface Brightness ProfilesIn contrast to the lack of FUV profiles, there havebeen numerous studies characterizing the optical lightprofiles of low surface brightness galaxies (Karachentseva et al. 1996; Patterson & Thuan 1996; Vader &Chaboyer 1994). The B-band profile of HoII, shownin Figure 4, can be characterized as exponential witha central depression. This behavior is typical of latetype low surface brightness galaxies. The underlying exponential component indicates the presence ofan optical disk superimposed on bright star formingknots while the central trough demonstrates that starformation is not centrally organized around a nucleus.A rough estimate of the central surface brightness of the HoII B-band profile is made by fittingit with a pure exponential which is extrapolated tothe center of the galaxy. Corrected for Galactic foreground extinction, µB (0) 22.3 0.02 mag arcsec 2 .The range in central surface brightness of the galaxies in the Karachentseva et al. (1996) sample is 22.2 2 µB (0) 24 mag arcsec compared to the canonical value of 21.65 0.30 mag arcsec 2 for disk galaxies (Freeman 1970). Holmberg II falls at the brighterend of the observed range for low surface brightnessirregular galaxies. Other studies report an averagehµB (0)i 23.5 0.2 (Rönnback and Bergvall 1994) andhµB (0)i 23.5 1.6 mag arcsec 2 (Vader & Chaboyer1994).4.3.21µFUV (mag arcsec-2)22232425012Radius (arcminutes)34Fig. 3.— The FUV surface brightness profile of Holmberg II.Radial Continuity of Star Formation21The general lack of correlation between star formation properties and other global properties suchas abundance or global gas parameters in irregulargalaxies suggests that local rather than global conditions are important in regulating star formation. Forexample, Hunter, Elmegreen, & Baker (1998) do notfind a correlation between the star formation and theratio of the HI surface density to the critical density for gas instabilities in a sample of dwarf irregular galaxies, while the stellar surface brightness doescorrelate with this ratio. These results suggest thatstellar energy provides feedback for star formation toa certain degree. Studies of the radial dependenceof the optical and Hα emission also suggest that local regulation of star formation may be important inboth irregular (Hunter & Gallagher 1985) and spiralgalaxies (Ryder & Dopita 1994). The FUV bandpass gives some insight into the radial dependenceof the recent star formation activity, yet over longerFUVURB22µ (mag arcsec-2)23242223242512341234Radius (arcminutes)Fig. 4.— Optical and FUV surface brightness profilesof Holmberg II.9
timescales than the Hα emission allows. Figure 4 displays the FUV, U, B, and R-band profiles of HoIIon the same linear scale. Beginning with the R-bandprofile and moving counterclockwise around the figure, the profiles become less smooth as the wavelengthof the profile decreases. This is expected due to thecontribution from recent star formation, while at increasingly longer wavelengths, the light is more complicated measure of the entire history of star formation. The general shape of each profile is same and theradii at which increased star formation activity occursremains relatively constant over the timescale whichthese profiles track star formation activity, roughly afew Gyrs. Figure 4 suggests that HoII is currentlyforming stars at the same radii as it has in the past,supporting the supposition that star formation in irregular galaxies is a local process and that local conditions such as gas distributions and feedback frommassive stars may play a significant role in the starformation process.5.Properties of Star Forming RegionsStar forming properties are examined in further detail by characterizing the individual star forming complexes. Star formation for individual regions is quantified by means of photometry in the observed bandpassses, used to derive a characteristic age and internal extinction for each region. The physical propertyupon which the age derivation is based is the differenttimescale of decay of the Hα and FUV flux from anevolving cluster. The Hα emission from an evolvingcluster peaks at roughly 1-2 Myr and falls off sharply.The FUV emission coming directly from the youngmassive stars in an evolving cluster peaks at roughly5 Myr and decays on a much longer timescale thanthe Hα emission (see O’Connell 1997, Fig. 1).5.1.Photometry of Star Forming RegionsStar formation regions are defined by selecting regions of associated FUV and Hα flux. Since both theFUV and Hα emission define a star forming region inthis context, the ages provide a snapshot of the pattern of star formation over a 100 Myr timescale. Thisis an unconventional approach in defining the spatialdistribution of young star formation which is normallydescribed by Hα observations alone. The registeredFUV and continuum subtracted Hα images of HoIIare compared in Figure 5 to highlight the differencesbetween the spatial patterns of current and recent starFig. 5.— Registered FUV (A, top) and Hα (B, bottom) images of Holmberg II.10
formation activity.The choice of region boundary is facil
a member of the ASTRO Observatory on two Shuttle missions in December, 1990 and March, 1995. To-gether, a total of 35 FUV images of galaxies ex-hibiting recent star formation were observed. The 300 spatial resolution of the UIT was a 5 20 times improvement over previously available UV imagery. Besides the Apollo 16 UV image of the LMC .