Transcription
c ESO 2010 Astronomy&AstrophysicsHerschel: the first science highlightsSpecial featureA&A 518, L100 (2010)DOI: 10.1051/0004-6361/201014659Letter to the EditorClouds, filaments, and protostars: The Herschel Hi-GAL Milky WayS. Molinari1 , B. Swinyard2 , J. Bally3 , M. Barlow4 , J.-P. Bernard5 , P. Martin6 , T. Moore7 , A. Noriega-Crespo8 ,R. Plume9 , L. Testi10,11 , A. Zavagno12 , A. Abergel13 , B. Ali14 , L. Anderson12 , P. André15 , J.-P. Baluteau12 ,C. Battersby3 , M. T. Beltrán10 , M. Benedettini1 , N. Billot14 , J. Blommaert16 , S. Bontemps15,17 , F. Boulanger13 ,J. Brand18 , C. Brunt19 , M. Burton20 , L. Calzoletti50 , S. Carey8 , P. Caselli22 , R. Cesaroni10 , J. Cernicharo23 ,S. Chakrabarti52 , A. Chrysostomou25 , M. Cohen26 , M. Compiegne27 , P. de Bernardis28 , G. de Gasperis29 ,A. M. di Giorgio1 , D. Elia1 , F. Faustini50 , N. Flagey8 , Y. Fukui31 , G. A. Fuller32 , K. Ganga33 , P. Garcia-Lario34 ,J. Glenn3 , P. F. Goldsmith35 , M. Griffin36 , M. Hoare22 , M. Huang37 , D. Ikhenaode49 , C. Joblin5 , G. Joncas38 ,M. Juvela39 , J. M. Kirk36 , G. Lagache13 , J. Z. Li37 , T. L. Lim2 , S. D. Lord14 , M. Marengo24 , D. J. Marshall5 , S. Masi28 ,F. Massi10 , M. Matsuura4,54 , V. Minier15 , M.-A. Miville-Deschênes13 , L. A. Montier5 , L. Morgan7 , F. Motte15 ,J. C. Mottram19 , T. G. Müller41 , P. Natoli29 , J. Neves40 , L. Olmi10 , R. Paladini8 , D. Paradis8 , H. Parsons40 ,N. Peretto32,15 , M. Pestalozzi1 , S. Pezzuto1 , F. Piacentini28 , L. Piazzo49 , D. Polychroni1 , M. Pomarès12 ,C. C. Popescu42 , W. T. Reach8 , I. Ristorcelli5 , J.-F. Robitaille38 , T. Robitaille24 , J. A. Rodón12 , A. Roy6 , P. Royer16 ,D. Russeil12 , P. Saraceno1 , M. Sauvage15 , P. Schilke30 , E. Schisano1,53 , N. Schneider15 , F. Schuller43 , B. Schulz14 ,B. Sibthorpe36 , H. A. Smith24 , M. D. Smith44 , L. Spinoglio1 , D. Stamatellos36 , F. Strafella21 , G. S. Stringfellow3 ,E. Sturm41 , R. Taylor45 , M. A. Thompson40 , A. Traficante29 , R. J. Tuffs46 , G. Umana47 , L. Valenziano48 , R. Vavrek34 ,M. Veneziani28 , S. Viti4 , C. Waelkens16 , D. Ward-Thompson36 , G. White2,51 , L. A. Wilcock36 , F. Wyrowski43 ,H. W. Yorke35 , and Q. Zhang24(Affiliations are available in the online edition)Received 31 March 2010 / Accepted 14 April 2010ABSTRACTWe present the first results from the science demonstration phase for the Hi-GAL survey, the Herschel key program that will map the inner Galacticplane of the Milky Way in 5 bands. We outline our data reduction strategy and present some science highlights on the two observed 2 2 tilesapproximately centered at l 30 and l 59 . The two regions are extremely rich in intense and highly structured extended emission whichshows a widespread organization in filaments. Source SEDs can be built for hundreds of objects in the two fields, and physical parameters can beextracted, for a good fraction of them where the distance could be estimated. The compact sources (which we will call cores’ in the following) arefound for the most part to be associated with the filaments, and the relationship to the local beam-averaged column density of the filament itselfshows that a core seems to appear when a threshold around AV 1 is exceeded for the regions in the l 59 field; a AV value between 5 and 10 isfound for the l 30 field, likely due to the relatively higher distances of the sources. This outlines an exciting scenario where diffuse clouds firstcollapse into filaments, which later fragment to cores where the column density has reached a critical level. In spite of core L/M ratios being wellin excess of a few for many sources, we find core surface densities between 0.03 and 0.5 g cm 2 . Our results are in good agreement with recentMHD numerical simulations of filaments forming from large-scale converging flows.Key words. stars: formation – ISM: structure – ISM: clouds – Galaxy: general1. IntroductionFrom the diffuse cirrus to the molecular clouds, onto the formation and death of stars, the Galactic plane is the set where all thephases of the Galaxy life-cycle can be studied in context. Dust,best observed in the infrared and in the submillimeter, cyclesthrough all these phases and is, as such, a privileged tracer forthe Galactic ecology. IRAS (Neugebauer et al. 1984) and COBE(Mather et al. 1990) were of tremendous importance in boostingthe research in Galactic star formation and interstellar medium tothe prominent positions they have today. As remote as they maynow seem, however, these missions are only some 20 years away.Since then, a continuing explosion of Galactic plane surveys, Herschel is an ESA space observatory with science instrumentsprovided by European-led Principal Investigator consortia and with important participation from NASA.both in the mid-infrared at λ 70 μm (Omont et al. 2003; Priceet al. 2001; Benjamin et al. 2003; Carey et al. 2009) and in thesubmillimeter at λ 800 μm (Schuller et al. 2009; Rosolowskyet al. 2009), are assembling a picture where the galactic planehas become accessible at sub-30 resolution over three decadesof wavelength. The exception is the critical interval between 70and 500 μm where the bulk of the cold dust in the Galaxy emitsand reaches the peak of its spectral energy distribution (SED).The Hi-GAL key program (Herschel Infrared GALactic planesurvey) will fill this gap.Hi-GAL is the key program (KP) of the Herschel satellite(Pilbratt et al. 2010) that will use 343 h observing time to carryout a 5-band photometric imaging survey at 70, 160, 250, 350,and 500 μm of a b 1 -wide strip of the Milky Way Galacticplane in the longitude range 60 l 60 . Hi-GAL is goingto be the keystone in the multiwavelength Milky Way, openingup unprecedented opportunities with a promise of breakthroughsArticle published by EDP SciencesPage 1 of 5
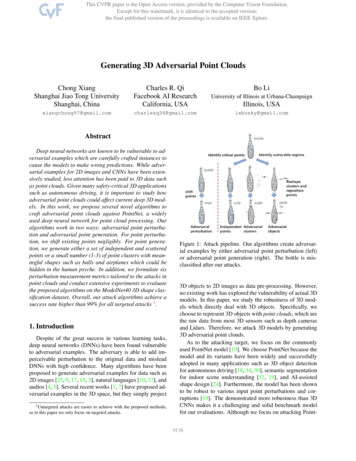
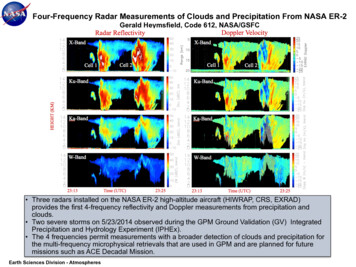
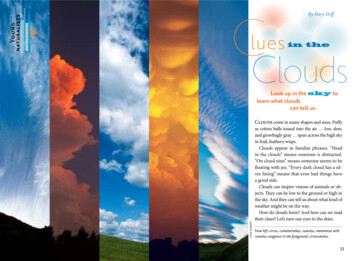
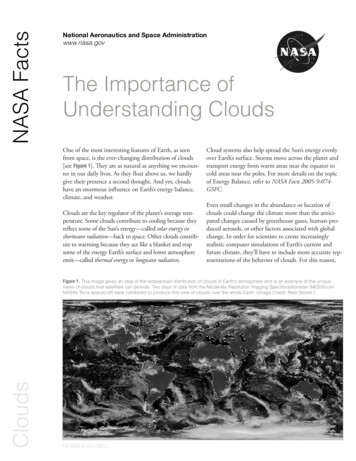
A&A 518, L100 (2010)Fig. 1. Three-color image (blue 70 μm, green 160 μm, red 350 μm) ofthe 2 2 field around l 30 .in several fields of Galactic astronomy. A full description of thesurvey and its science goals are given elsewhere (Molinari et al.2010b). This contribution presents the first Hi-GAL data obtained in the Herschel science demonstration phase (SDP) anddescribes a few of the main early results that will be detailed inother contributions in this volume.2. Observations and data reductionThe Herschel PACS (Poglitsch et al. 2010) and SPIRE (Griffinet al. 2010) imaging cameras were used in parallel mode at 60 /ssatellite scanning speed to obtain simultaneous 5-band coverageof two 2 2 fields approximately centered at [l, b] [30 , 0 ]and [59 , 0 ]. The detailed description of the observation settings and scanning strategy adopted is given in Molinari et al.(2010b). Data reduction from archival data to Level 1 stage wascarried out using the Herschel interactive processing environment (HIPE, Ott 2010) using, however, custom reduction scriptsthat considerably departed from standard processing for PACS(Poglitsch et al. 2010) and, to a lesser extent, for SPIRE (Griffinet al. 2010). Level 1 time ordered data (TODs) were exportedfrom HIPE into FITS files. Further processing including the mapgeneration was carried out using dedicated IDL and FORTRANcodes. Saturation conditions were reached for all detectors onlyin SPIRE 250 μm and 350 μm images in correspondence withthe 3 brightest peaks in the l 30 field. The prescribed fluxcorrection factors for PACS (Poglitsch et al. 2010) and SPIRE(Swinyard et al. 2010) were applied to the maps since their photometric calibration was carried out using the default calibrationtree in HIPE. A detailed description of the entire data processing chain, including the presentation of the maps obtained in thefive bands for the two observed fields, can be found in Traficanteet al. (in prep.). In the present letter we present in Figs. 1 and 2the three-color images obtained using the 70, 160, and 350 μmdata (l 30 and l 59 , respectively).These amazing maps convey the immediate impression ofextended filamentary structures dominating the emission on allspatial scales. Measurements of the standard deviation of thesignal at all wavelengths in the lowest brightness regions ofthe l 59 field yield average values a factor two higher thanthe sensitivity predictions for point source sensitivity from theHSpot time estimator for all bands except at 70 μm where thepredicted limit is effectively reached, confirming that the noisein our maps is dominated by the cirrus confusion at all wavelengths. A more detailed quantitative analysis is presented byMartin et al. (2010).Page 2 of 5Fig. 2. Three-color image (blue 70 μm, green 160 μm, red 350 μm) ofthe field around l 59 .3. Results and science highlights3.1. From IRDCs to mini-starburst and their impacton the ISMHerschel’s ability to observe such large areas with unprecedented wavelength coverage and extraordinary signal dynamicalrange allows us to image simultaneously progenitors clouds formassive protoclusters to entire clusters of young stellar objects(YSOs) in acitve star forming regions, while also measuring theeffect of their strong stellar winds and powerful outflows on thesurrounding medium.Infrared dark clouds (IRDCs) have received considerable attention in recent years (e.g. Rathborne et al. 2006; and Peretto& Fuller 2009) as potential sites for precursors of cluster forming sites. Found in silhouette against the bright mid-IR background, they shine in emission with Herschel. Peretto et al.(2010) shows how temperature effectively decreases from ambient values (20 30 K) down to T 8 15 K toward thedensest ( 1023 cm 2 ) peaks of these objects, resolving furthertemperature substructures that can be proxies for subsequentfragmentation.At the other end of the massive star formation timeline, wefind W43, visible in the left portion of Fig. 1, as an outstanding case of Galactic mini-starburst. Detailed SED constructionand luminosity estimates allow us to assess the very early evolutionary stage of the most luminous and massive YSOs in theregion. It is remarkable how the same images show a prominentridge extending southward which encompasses a 70 pc-widelarge cavity excavated by the W43 cluster and which possiblytriggers further star formation (Bally et al. 2010). Triggered starformation in less extreme environments can also be studied instatistically significant fashion modeling the SED of the sourcesfound in correspondence of the multitude of Hii-driven bubblelike structures found in the images, as shown for the bubble N49by Zavagno et al. (2010).Feedbacks from massive star formation, together with the intricate relationship between the interstellar radiation field andmolecular clouds, are at the origin of the observed complexityof the ISM emission structure, where temperature ranges from 10 K of pre-stellar cores to the 40 50 K of the photodissociation regions (Bernard et al. 2010).3.2. Census of compact sourcesThe extraction of compact sources is quite a challenging task inthese fields, which we faced using a novel approach based on the
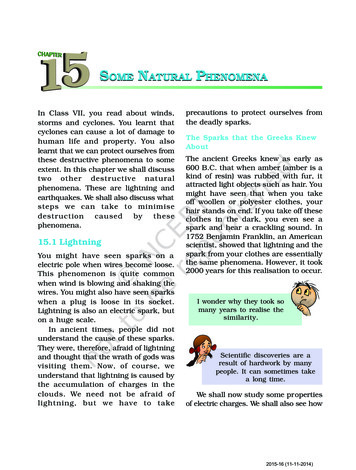
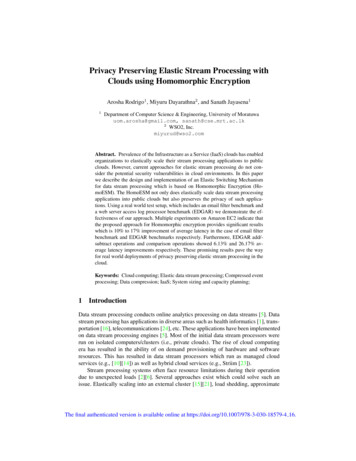
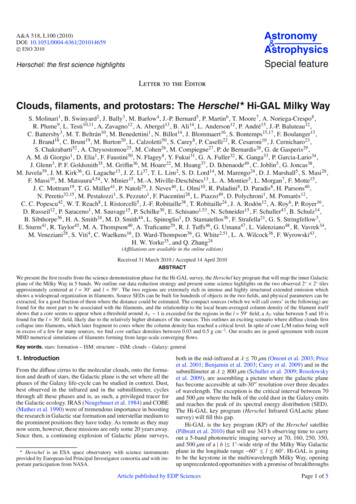
S. Molinari and the Hi-GAL Consortium: The Hi-GAL Milky Way with Herschelstudy of the multidirectional second derivatives in the image toaid in source detection and size estimate, and subsequent constrained multi-Gaussian fitting. This approach greatly increasesthe dynamical range between compact sources and diffuse emission, irrespective of the local absolute value of the emission. Themethod is fully described elsewhere (Molinari et al. 2010a) andhas been applied for this first attempt to generate source catalogs.As the thresholding for source detection is done on the curvatureimage (Molinari et al. 2010a), the S/N of the detected sources isdetermined a posteriori measuring the ratio of the source peakflux over the rms of the residuals after the Gaussian fit. Sourcecatalogs were generated for the two fields and for the 5 bands andare made available in tabular form in the online version of the paper. Catalogs completeness was estimated with artificial sourceinjection experiments, and the peak flux levels for 80% completeness for the 70, 160, 250, 350 and 500 μm photometry are[0.5, 4.1, 4.1, 3.2, 2.5] Jy/beam for the l 30 field, and [0.06,0.9, 0.7, 0.7, 0.8] Jy/beam for the l 59 field. The difference isentirely compatible with the very different intensity regimes ofthe underlying diffuse emission in the two fields.Estimating the source’s physical properties requires that detection in the various band catalogs are merged in coherentSEDs, a process that can only be done coarsely in this earlystage, but which is nonetheless useful for isolating 528 sourcesin the l 30 field and 444 sources in the l 59 field (seeElia et al. 2010). The two observed fields encompass emissionfrom regions at very different distances. In a considerable effort,which involved a critical re-evaluation of available data and evidence, and the collection of additional data for hundreds of previously unknown objects, Russeil et al. (in prep.) provide recommended distances for a fraction of the detected sources (312 outof 528, and 91 out of 444 sources for the two fields, respectively) for which the derivation of masses and luminosities ispossible. Adopting standard prescriptions for Class 0 classification (Lλ 350 μm /Lbol 0.005, André et al. 2000) results in almostthe totality of sources being Class 0 (90 out of 91 sources in l 59 and 306 out of 312 in l 30 , see Elia et al. 2010).3.3. Filamentary star formationThe most extraordinary feature exhibited by the Herschel mapsis the ubiquitous pattern of filaments in the ISM structure. This ismore apparent when we enhance the contrast of the filaments using the same method (see Sect. 3.2) as used for the source detection (Molinari et al. 2010a). Here we start from the 2 derivativescarried out in four directions (x, y, and the two diagonals), as forthe standard detection method, and then create another image Fof the same size so that the maximum curvature is selected foreach pixel: Fi j max[ 2 xi j , 2 yi j , 2 D1i j , 2 D2i j ]. In this waywe are following the direction of maximum curvature pixel-bypixel for all compact features in the image. We show in Fig. 3the result of this processing on the l 59 field at 250 μm.The maps clearly show an interconnected maze of filamentsat different levels of brightness (e.g. different levels of emission intensity and curvature), and the striking aspect is thatthe compact sources detected at 250 μm are distributed for themost part along the brightest filaments. Interestingly, a similar scenario was also reported for Taurus by Goldsmith et al.(2008) where the physical conditions and spatial scales involvedare radically different. Since the source integrated fluxes areestimated by fitting Gaussians on top of planar plateaus, thevalues of the local background at every wavelength are a byproduct of our source extraction and, after applying the absolute correction factors as recommended by Bernard et al. (2010)and subtracting the foreground contribution estimated usingFig. 3. Multidirectional second-derivative image (see text) of the l 59 field at 250 μm. The blue circles represent the compact sources detectedat 250 μm. The filamentary structure of the ISM appears at various levels of intensity, i.e. curvature, and it is striking how the detected compact objects are for the most part distributed only along the brightestfilaments.Bohlin (1975), can be used to estimate the local beam-averagedcolumn density in the hosting filaments. The relationship between the mass of the detected cores (when the SED is reliableand the distance is known, see previous paragraph) and the localbeam-averaged H2 filament column density is reported in Fig. 4.The points for the l 59 field mostly lie in the range of columndensities (1021 cm 2 N(H2 ) 1022 cm 2 ) that corresponds to1 mag AV 10 mag, values that are entirely reasonable forthe transition regime between diffuse ISM and dense molecularclouds (Cambresy 1999; Snow & McCall 2006). Higher valuesof N(H2 ) are found for the points for the l 30 field, most likelydue to the larger relative distances of the sources in this latterfield. The core masses are spread between 1 and 104 M , withno indication of a correlation between the two quantities. Thestrong impression, however, is that of a threshold at AV 1 magfor the l 59 field above which dense cores are found, a threshold that is evidently exceeded only in bright filaments (Fig. 3).More in particular, the AV 1 mag threshold corresponds to 17 M pc 2 in molecular hydrogen, which is suprisingly closeto the 10 M pc 2 value that Krumholz et al. (2009) find criticalfor the dust content in HI clouds to efficiently shield the cloud interior from external FUV field and allow effective H2 formation.It is tempting to relate the appearance of clumps to an extinction regime where the Hi/H2 boundary shields the cloud interiors from interstellar FUV field, causing the photoelectric heatingefficiency to drop considerably and causing in turn a drop in dustand gas temperature (Tielens & Hollenbach 1985). This threshold value seems to be of the order of AV 5 10 for the l 30 field most likely due to the relatively larger distances of sourcesin this field (Russeil et al., in prep.).The ubiquitousness of dense filaments in the ISM, the highdegree of association between bright filaments and cores, andthe suggestion of a column density threshold for the appearanceof dense cores, all appear to coherently support a formation scenario that starts with the condensation of diffuse clouds into longfilaments. As the column density increases, a threshold is exceeded and denser star-forming (or potentially star forming) condensations start to appear. A preliminary association with Spitzer24 μm counterparts (Elia et al. 2010) suggests that our detectedsources may be a mixture of protostellar and pre-stellar objects,although more work will be needed to ascertain the compositionof this mixture.Page 3 of 5
A&A 518, L100 (2010)nearest neighbor: 1.8 pc for the 250 μm sources in the l 59 field for the sources’ average distance (Russeil et al., inprep.). It is also interesting that the typical fragmentation lengthscale decreases with increasing filament density, in broad qualitative agreement with a higher spatial density of sources in thebrightest filaments. This clearly deserves further investigation tobe confirmed as a viable hypothesis.Fig. 4. Mass of detected cores as a function of the hosting filament local column density, for the cores where the distance is known and themass could be estimated. The red diamonds represent the cores in thel 59 region, while the plus signs represent the cores from the l 30 region. The top X-axis represents the equivalent AV .Since our source extraction also yields a measure of the coresizes, we are in the position to estimate their surface density Σ.These values appear to be on average a factor 3 5 higher thanthe column densities of the underlying filaments as reported inFig. 4, spanning a range of 0.03 g cm 2 Σ 0.5 g cm 2 , afterchanging units, with a mean value of 0.1 g cm 2 . It is puzzlingthat the number of cores exceeding L/M ratios of a few (the exact number depending on the core masses), corresponding to thecritical surface density threshold of 1 g cm 2 for the formation ofmassive stars (Krumholz & McKee 2008), is not consistent withvery few of the cores actually exceeding that critical threshold(see also Elia et al. 2010). The difference of a factor 2 betweenthe dust opacities that we used compared to Krumholz & McKee(2008) is not sufficient to reconcile this apparent discrepancy.This result deserves more attention and needs to be confirmed inthe future with more detailed and accurate analysis.Testing of large-scale “dynamical” star formation scenarios (e.g., Hartmann et al. 2001), where filaments are formed inthe post-shock regions of large Hi converging flows, is one ofthe original science goals of Hi-GAL. It is remarkable how thepredictions from recent MHD numerical simulations (Banerjeeet al. 2009) of formation and subsequent fragmentation of filaments, agree with our results. Besides the morphological resemblance of these simulations with the structures we see in ourHerschel maps (Fig. 3), there is striking agreement of their predictions with the N(H) regime we measured for our core-hostingfilaments, as well as with the mass regime of the cores beingformed.Instability and fragmentation of dense filaments has alsobeen investigated in the context of helical magnetic fields enclosing the filaments by Fiege & Pudritz (2000); interestingly,the models predict the formation of regularly spaced condensations at length scales that depend on the properties of the magnetic field, the velocity dispersion, and density of the filament.The predicted length scale for filament velocity dispersion of0.5 km s 1 and density of 104 cm 3 is 2.8 pc, and curiously thisis not at all far from the median distance of each source to itsPage 4 of 54. ConclusionsThe first science highlights presented in this paper, as well asin the accompanying papers in this volume and elsewhere, showthat owing to its optimal use of unique Herschel characteristicsof wavelength coverage, spatial resolution and mapping speed,the Hi-GAL survey has the potential to lead to a quantum leapin our understanding of large-scale Galactic star formation fromcloud to cluster-forming clump formation and of the evolutionof protoclusters and massive protostars.The outstanding feature emerging from these first images isthe impressive and ubiquitous ISM filamentary nature. Densecores seem to appear when a certain beam-averaged columndensity threshold is exceeded in close spatial association withthese filaments.Acknowledgements. Data processing and map production has been possible thanks to generous support from the Italian Space Agency via contract I/038/080/0. We are indebted to Nicola Giordano for the production of thetrichromatic overlay images. Data presented in this paper were also analyzedusing The Herschel interactive processing environment (HIPE), a joint development by the Herschel Science Ground Segment Consortium, consisting of ESA,the NASA Herschel Science Center, and the HIFI, PACS, and SPIRE consortia.ReferencesAndré, P., Ward-Thompson, D., & Barsony, M. 2000, in Protostars andPlanets IV, ed. S. S. Russell, V. Mannings, & A. P. Boss, 59Bally, J., Anderson, L., Battersby, C., et al. 2010, A&A, 518, L90Banerjee, R., Vázquez-Semadeni, E., Hennebelle, P., & Klessen, R. S. 2009,MNRAS, 398, 1082Benjamin, R. A., Churchwell, E., Babler, B. L., et al. 2003, PASP, 115, 953Bernard, J. P., Paradis, D., Marshall, D. J., et al. 2010, A&A, 518, L88Bohlin, R. C. 1975, ApJ, 200, 402Cambresy, L. 1999, A&A, 345, 965Carey, S. J., Noriega-Crespo, A., Mizuno, D. R., et al. 2009, PASP, 121, 76Elia, D., Molinari, S., Schisano, E., et al. 2010, A&A, 518, L97Fiege, J. D., & Pudritz, R. E. 2000, MNRAS, 311, 105Goldsmith, P., Heyer, M., Narayanan, G., et al. 2008, ApJ, 680, 428Griffin, M. J., Abergel, A., Abreu, A., et al. 2010, A&A, 518, L3Hartmann, L., Ballesteros-Paredes, J., & Bergin, E. A. 2001, ApJ, 562, 852Krumholz, M., & McKee, C. F. 2008, Nature, 451, 1082Krumholz, M. R., McKee, C. F., & Tumlinson, J. 2009, ApJ, 693, 216Martin, P. G., et al., G., et al., G., et al. 2010, A&A, 518, L105Mather, J. C., Hauser, M. G., Bennett, C. L., et al. 1990, in Observatories inEarth Orbit and Beyond: Proceedings of the 123rd., ed. Y. Kondo (Dordrecht,Boston: Kluwer Academic Publishers) IAU Colloq., 9Molinari, S., Faustini, F., Schisano, E., Pestalozzi, M., & Di Giorgio, A. 2010a,A&A, submittedMolinari, S., Swinyard, B., Bally, J., et al. 2010b, PASP, 122, 314Neugebauer, G., Soifer, B. T., Beichman, C. A., et al. 1984, Science, 224, 14Omont, A., Gilmore, G. F., Alard, C., et al. 2003, A&A, 403, 975Ott, S. 2010, in Astronomical Data Analysis Software and System XIX,ed. M. O. Y. Mizumoto, K.-I. Morita, ASP Conf. Ser., in pressPeretto, N., & Fuller, G. A. 2009, A&A, 505, 405Peretto, N., Fuller, G. A., Plume, R., et al. 2010, A&A, 518, L98Pilbratt, G. L., et al. 2010, A&A, 518, L1Poglitsch, A., et al., 2010, A&A, 518, L2Price, S. D., Egan, M. P., Carey, S. J., et al. 2001, AJ, 121, 2819Rathborne, J. M., Jackson, J. M., & Simon, R. 2006, ApJ, 641, 389Rosolowsky, E., Dunham, M. K., et al. 2009, ApJS, 188, 123Schuller, F., Menten, K. M., Contreras, Y., et al. 2009, A&A, 504, 415Snow, T. P., & McCall, B. J. 2006, ARA&A, 44, 367Swinyard, B. M., et al. 2010, A&A, 518, L4Tielens, A. G. G. M., & Hollenbach, D. 1985, ApJ, 291, 722Zavagno, A., Anderson, L., Russeil, D., et al. 2010, A&A, 518, L101Page 5 is available in the electronic edition of the journal at http://www.aanda.org
S. Molinari and the Hi-GAL Consortium: The Hi-GAL Milky Way with 52627INAF-Istituto Fisica Spazio Interplanetario, via Fosso del Cavaliere100, 00133 Roma, Italye-mail: sergio.molinari@ifsi-roma.inaf.itSTFC, Rutherford Appleton Labs, Didcot, UKCenter for Astrophysics and Space Astronomy (CASA), Departmentof Astrophysical and Planetary Sciences, University of Colorado,Boulder, USADepartment of Physics and Astronomy, University College London,London, UKUniversité de Toulouse, UPS, CESR, and CNRS, UMR5187,Toulouse, FranceDepartment of Astronomy & Astrophysics, University of Toronto,Toronto, CanadaAstrophysics Research Institute, Liverpool John Moores University,UKSpitzer Science Center, California Institute of Technology,Pasadena, CA, USADepartment of Physics & Astronomy, University of Calgary, CanadaINAF - Osservatorio Astrofisico di Arcetri, Firenze, ItalyEuropean Southern Observatory, Garching bei Muenchen, GermanyLAM, Université de Provence, Marseille, FranceInstitut d’Astrophysique Spatiale, Université Paris-Sud, Orsay,FranceNASA Herschel Science Center, Caltech, Pasadena, CA, USALaboratoire AIM, CEA/DSM – INSU/CNRS – Université ParisDiderot, IRFU/SAp CEA-Saclay, 91191 Gif-sur-Yvette, FranceInstitute for Astronomy, Katholieke Universiteit Leuven, Leuven,BelgiumLAB/CNRS, Université de Bordeaux, BP89, 33271 Floirac Cedex,FranceINAF - Istituto di Radioastronomia, Bologna, ItalySchool of Physics, University of Exeter, Stocker Road, Exeter, EX44QL, UKSchool of physics, University of New South Wales, AustraliaDipartimento di Fisica, Universitá del Salento, Lecce, ItalySchool of Physics and Astronomy, University of Leeds, Leeds, UKCentro de Astrobiologia, CSIC-INTA. Madrid, SpainHarvard-Smithsonian Center for Astrophysics, Cambridge, MA,USAJoint Astronomy Center, Hilo, HawaiiRadio Astronomy Lab., UCB, Berkeley, CA, USACanadian Institute for Theoretical Astrophysics, University ofToronto, Toronto, 51525354Dipartimento di Fisica, Università di Roma 1 “La Sapienza”, Roma,ItalyDipartimento di Fisica, Università di Roma 2 “Tor Vergata”, Roma,ItalyI. Physikalisches Institut der Universität zu Köln, Zülpicher Str. 77,50937 Köln, GermanyDepartment of Astrophysics, Nagoya University, Nagoya, JapanJodrell Bank Center for Astrophysics, School of Physics andAstronomy, University of Manchester, Manchester, M13 9PL, UKAPC/Université Paris 7 Denis Diderot/CNRS, Bâtiment Condorcet,10, Rue Alice Domon et Léonie Duquet, 75205 Paris Cedex 13,FranceHerschel Science Centre, European Space Astronomy Centre,Villafranca del Castillo. Apartado de Correos 78, 28080 Madrid,SpainJet Propulsion Laboratory, Pasadena, USASchool of Physics and Astronomy, Cardiff University, Cardiff, UKNational Astronomical Observatories, Chinese Academy ofSciences, Beijing, PR ChinaDepartement de Physique, Université Laval, Québec, CanadaDepartment of Physics, University of Helsinki, FinlandCentre for Astrophysics Research, Science and TechnologyResearch Institute, University of Hertfordshire, Hatfield, UKMPE-MPG, Garching bei München, GermanyJeremiah Horrocks Institute, University of Central Lancashire,Preston PR1 2HE, UKMPIfR-MPG, Bonn, GermanyCentre for Astrophysics & Planetary Science, University of Kent,Canterbury, UKCenter for Radio Astronomy, University of Calgary, Calgary,CanadaMax-Planck-Institut für Kernphysik, Heidelberg, GermanyINAF - Osservatorio Astrofisico di Catania, Catania, ItalyINAF Istituto di Astrofica Spaziale e Fisica Cosmica, Bologna, ItalyDipartimento di Scienza e Tecnica dell’Informazione e dellaComunicazione, Università di Roma 1 “La Sapienza”, Roma, ItalyASI Science Data Center, 00044 Frascati (Roma), ItalyDepartment of Physics and Astronomy, The Open University,Milton Keynes, UKAstronomy Department, UCB Berkeley, CA, USADipartimento di Fisica, Università di Napoli “Federico II”, Napoli,ItalyMullard Space Science Laboratory, University College London,Holmbury St. Mary, Dorking, Surrey RH5 6NT, UKPage 5 of 5
triggers further star formation (Bally et al. 2010). Triggered star formation in less extreme environments can also be studied in statistically significant fashion modeling the SED of the sources found in correspondence of the multitude of Hii-driven bubble-like structures found in the images, as shown for the bubble N49 by Zavagno et al. (2010).