Transcription
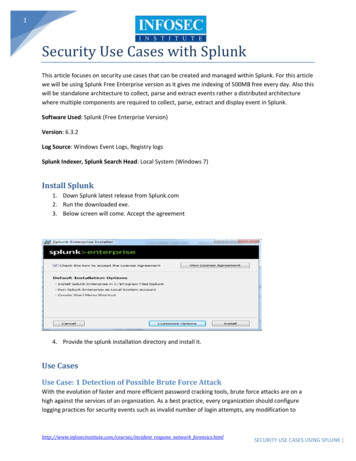
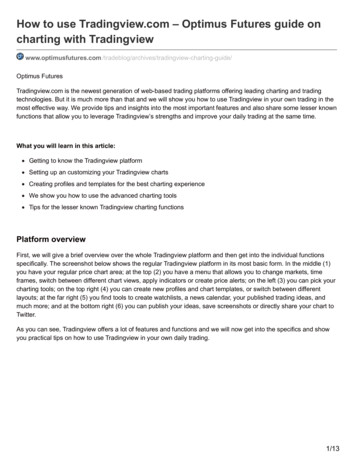
How to use Tradingview.com – Optimus Futures guide oncharting with Tradingviewwww.optimusfutures.com imus FuturesTradingview.com is the newest generation of web-based trading platforms offering leading charting and tradingtechnologies. But it is much more than that and we will show you how to use Tradingview in your own trading in themost effective way. We provide tips and insights into the most important features and also share some lesser knownfunctions that allow you to leverage Tradingview’s strengths and improve your daily trading at the same time.What you will learn in this article:Getting to know the Tradingview platformSetting up an customizing your Tradingview chartsCreating profiles and templates for the best charting experienceWe show you how to use the advanced charting toolsTips for the lesser known Tradingview charting functionsPlatform overviewFirst, we will give a brief overview over the whole Tradingview platform and then get into the individual functionsspecifically. The screenshot below shows the regular Tradingview platform in its most basic form. In the middle (1)you have your regular price chart area; at the top (2) you have a menu that allows you to change markets, timeframes, switch between different chart views, apply indicators or create price alerts; on the left (3) you can pick yourcharting tools; on the top right (4) you can create new profiles and chart templates, or switch between differentlayouts; at the far right (5) you find tools to create watchlists, a news calendar, your published trading ideas, andmuch more; and at the bottom right (6) you can publish your ideas, save screenshots or directly share your chart toTwitter.As you can see, Tradingview offers a lot of features and functions and we will now get into the specifics and showyou practical tips on how to use Tradingview in your own daily trading.1/13
Create profilesWhen you first get started with Tradingview, you probably want to create profiles for your chart layouts. In a profile,you’d typically include different markets that somehow belong together, or that you want to monitor together to makeyour trading more effective and organized.To create a new profile, click in the top right corner (1) where you’ll see the term Unnamed when you haven’tcreated any profiles yet. You can directly type a name here and Tradingview will save it as a new profile. You cancreate new profiles and also switch between your profiles here.Here are some ideas on how you could combine different markets in individual profiles:CommoditiesCurrenciesIndices and otherCrudeEuro FuturesES miniGoldYen FuturesDAX Silver CopperIron OreWhen you then load the profile “Commodities”, you’d see all your previously used charts for Crude Oil, Gold,Silver Copper and Iron Ore. As you can see, each profile is a collection of individual charts and markets that thenallow you to access different views more easily and in a structured way.2/13
Chart templatesAfter you have created your profiles, you want to add markets and style your chart layouts. For that, click on the iconin the top right corner (1) and you’ll see a new menu slide down (2). Here you can first select the chart view and ifyou want to see multiple charts at the same time. You can also sync charts in different ways (3). In the top left (4)you can change the markets you see in the chart area. For that, first select whether you want to change the right orthe left chart (simply click on the chart you want to change) and then type the name of the market you want to see.Tip: Tradingview will save the layouts you have created and also remember all indicators and other charting toolsyou have applied to a chart.3/13
Menu overviewThe top menu has a variety of different functions and styling features. We will go from left to right and explore eachone: In the first field you can search for different markets, you can skip between the different time frames, the nextfield allows you to switch between chart types, “Compare” lets you overlay your chart with different markets, youalso add indicators and create price alerts. Those settings will be saved for your different profiles and chartlayouts so that you can style your charts individually.Market overviewOnce you select the input field for the markets (1), you’ll see anew menu. You can, of course, search for the market manually(1), or you can also browse through the different categories andmarket types (2). You can even change the exchange (3) thatTradingview will use to obtain the price data.This is also the same view you will get when you click on“Compare” at the top menu which lets you overlay your chartwith addition markets which is great if you want to performintermarket analysis and check for correlations.Chart typesBy clicking on the candlestick symbol at the top, you can change the chart type that Tradingview will use to displayyour price data. As you can see, Tradingview provides you with a lot of possibilities which range from regular bars4/13
and candlesticks, to Renko, Point and Figure and even Kagi charts.Chart settingsThe cogs symbol allows you to style your charts and also access some moreadvanced features to personalize your Tradingview experience. You can alsocreate your own, personalized themes (3) that you can then apply across differentcharts and layouts.SessionsOne great feature is the ability to access extended trading hours or also visualize session breaks, and even set yourtime zone which then syncs Tradingview with your current timezome.5/13
EventsThe Events & Alerts tab in the Settings window allows you to display news events directly on your price charts. Thisway you can very easily analyze the impacts of past news events and also perform fundamental analysis very easily.We will get more into this feature later on.Charting menu and tools6/13
Tradingview’s charting and price analysis menu is state of the art and there is nothing you can’t do withTradingview’s charting package as we will see. By default, you find Tradingview’s charting tools on the far left of yourscreen and by clicking and expanding each icon, you will see why Tradingview is so popular among traders; besidesall standard charting tools, you’ll also find a variety of very advanced and exclusive features which we will exploreshortly.Tools and templatesThe great thing about Tradingview is that it allows you to style your charting tools completely individually. Forexample, you can grab the regular tool for drawing horizontal lines (hotkey: ALT H) (1) and once you click on theline on your chart (2), you will see a new menu pop up (3). This menu does not only allow you to style individuallines, you can also create different templates for your tools and then access them later again. This is ideal if youwant to use color-coded charting tools for different purpose, e.g. higher vs. lower chart analysis tools. The menu alsoallows you to create price alerts directly from the charting tool itself by clicking on the alarm clock.This styling possibilities are not limited to horizontal lines, but you can personalize and customize Tradingviewcompletely based on your own needs and wants.7/13
Some more charting tips#1 FibonaccisThe Fibonacci retracement tool is a great example for how flexible and advanced Tradingview’s charting tools are.Let us show you how to turn the Fibonacci retracement tool into the Fibonacci extension tool. For that, simply grabthe Fibonacci Retracement tool (1), plot a Fibonacci retracement on your chart (2), and then open the settings forthe Fibonacci tool as we have shown you for the horizontal lines above. In the new menu (3), you can add or deletecertain Fibonacci retracement levels and also activate the function “Reverse” which will give you Fibonacciextensions on your charts. You can save that as a new template as well and then use the Fibonacci Extension toollater again. You can color-code different levels, make them available on certain time frames only among many otherthings.8/13
PatternsOne of the really great features of the Tradingview platform is the ability to draw and annotate chat patterns on yourprice charts. The icon below the “ABC” (which give you text annotations and price labels) will give you a lot ofdifferent charting patterns from regular triangles, Head and Shoulders, to harmonic patterns such as butterflies andElliot wave analysis.It’s the easiest way to annotate charts with conventional chart patterns in the most effective form.9/13
Create your own menusYou probably don’t want, or need to use all charting tools Tradingview offers. Mostly, traders have 5 or 10 favoritecharting tools that they use on a regular basis. For that, Tradingview has another great time-saver and you cancreate your own menu bars in Tradingview.First, navigate to any charting tool you want to make accessible in your own menu bar (1), then move your mouse abit to the right until you can see the star icon (2) and click the star. This will enable the charting tool in your ownmenu bar and you can directly access for favorite tools much faster with just one click (3).10/13
IndicatorsTradingview also comes with a large variety of indicators and other charting tools. You can access the indicatorwindow by clicking on “Indicators” in the top menu. A new popup opens and on the left, you can see the differentcategories: “Built-Ins” are your regular indicators such as the Bollinger Bands, MACD, RSI and many others.The “Public Library” includes indicators that have been created by other Tradingview users. Just a tip, if you aretrying to find a custom indicator, it’s often better to go with indicators that already have lots of ratings to ensure thatthe quality of the indicator you are using is at a high standard and you won’t experience any bugs.“Volume Profile” shows the most traded prices by displaying the volume profile information on your charts. Here youcan choose between different profile ranges as well.The point “Fundamentals” include stocks and equity specific data. “Economy & Symbols” allows you to analyzebroader economic data such as GDP, unemployment rate, interest rate developments among many other.11/13
Customizing indicatorsJust as you can customize the way your charting tools look, you can also change the setting for all your indicators.After you have chosen a specific indicator, it will be visible on your charts. Next to the indicator description on yourcharts, you find a few options and the cogs symbol opens up the settings menu for that indicator. Again, you canchange color specific settings, period settings and many other things. Besides that, you can also create customthemes for your indicators and personalize your Tradingview experience even further.This guide has to goal to help you get started with Tradingview in the most effective way and it enables you to12/13
completely personalize your Tradingview experience. But there is more. In the next guide we will show you how touse the other Tradingview functions to structure your trading day even more.Read our next chapter about Tradingview: Structuring your trading with Advanced FeaturesThere is substantial risk of loss in futures trading. Past Performance is not Indicative of future results.13/13
As you can see, each profile is a collection of individual charts and markets that then allow you to access different views more easily and in a structured way. 2/13. Chart templates After you have created your profiles, you want to add markets and style your chart layouts. For that, click on the icon in the top right corner (1) and you’ll see a new menu slide down (2). Here you can first .