Transcription
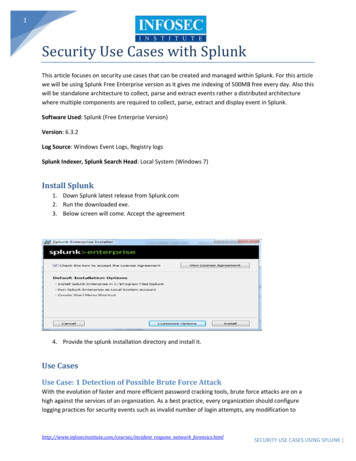
1Security Use Cases with SplunkThis article focuses on security use cases that can be created and managed within Splunk. For this articlewe will be using Splunk Free Enterprise version as it gives me indexing of 500MB free every day. Also thiswill be standalone architecture to collect, parse and extract events rather a distributed architecturewhere multiple components are required to collect, parse, extract and display event in Splunk.Software Used: Splunk (Free Enterprise Version)Version: 6.3.2Log Source: Windows Event Logs, Registry logsSplunk Indexer, Splunk Search Head: Local System (Windows 7)Install Splunk1. Down Splunk latest release from Splunk.com2. Run the downloaded exe.3. Below screen will come. Accept the agreement4. Provide the splunk installation directory and install it.Use CasesUse Case: 1 Detection of Possible Brute Force AttackWith the evolution of faster and more efficient password cracking tools, brute force attacks are on ahigh against the services of an organization. As a best practice, every organization should configurelogging practices for security events such as invalid number of login attempts, any modification tohttp://www.infosecinstitute.com/courses/incident respone network forensics.htmlSECURITY USE CASES USING SPLUNK
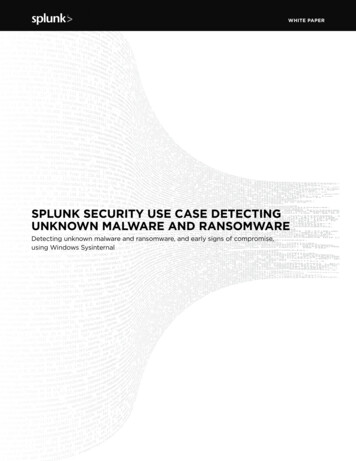
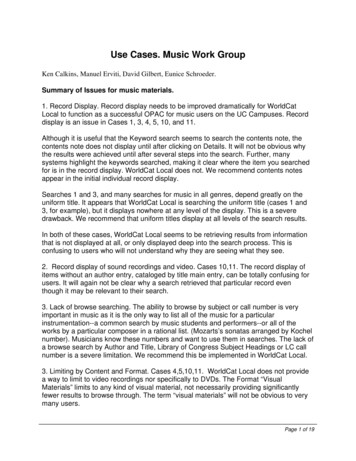
2system files, etc., so that any possible attack underway will get noticed and treated before the attacksucceeds. Organizations generally apply these security policies via a Group Policy Object (GPO) to all thehosts in their network.Problem Statement: Alert in real time whenever a user failed to do a successful login for more than 2times.Log Source: Windows Security LogsSplunk Query: sourcetype "WinEventLog:Security" (EventCode 4625 AND "Audit Failure") statscount by Account Name where count 2How to read this query: We are monitoring windows security even logs and looking for EventCode 4625which is “Failed Logins”. Every space in splunk is a AND operator. Then we are performing a staticallysearch of count variable on Account Name and report where count is greater than 2 i.e. it will reportwhen a user(Account Name) has performed more than 2(count) failed logins.Steps to simulate the Use-Case:1. First make sure your local machine is logging local logon events. Check it viaa. Click Start, type “local Security Policy”. Below Screen will nt respone network forensics.htmlSECURITY USE CASES USING SPLUNK
3b. Click Local Policies Audit Policies. Make sure Auditing for failure, success event isturned on. If it is not double click and select failure events.Below should be the finalscreen for this:2. Start Splunk: Navigate to Splunk directory bin and execute command : splunk start.3. Open Splunk Web . usually It will be at localhost:8000. If 8000 is occupied it will be ent respone network forensics.htmlSECURITY USE CASES USING SPLUNK
44. Provide the credentialsa. Username: adminb. Password: changeme(default)5. Change the default password.6. Feed the data into splunka. Click on Settings Data Inputsb. Click on “Local event log es/incident respone network forensics.htmlSECURITY USE CASES USING SPLUNK
5c. Click on Security Logs. Logs from Windows events will go to splunk default index which iscalled as “main”.d. Click Save. Below Screen should appearsearch7. Click on Splunk Search and Reporting(App).8. Copy the Splunk search: sourcetype "WinEventLog:Security" (EventCode 4625 AND "AuditFailure") earliest -30m@m stats count by Account Name where count 2http://www.infosecinstitute.com/courses/incident respone network forensics.htmlSECURITY USE CASES USING SPLUNK
69. You might get 0 results here. Not to worry we still have to do unsuccessful logins.10. Click on Save As Alerts , to save this search as a alert.11. Fill in details for Alert definition:a. Title: Alert Nameb. Alert Type: Real Timec. Permissions: Privated. Trigger Condition: Per Resulte. Add Throttle Action for Account Name and suppress it for 30 minutes: This means thatalert will suppress the events with same Account Name for next 30 minutes.f. Trigger Actions: Add to Triggered Alertsg. Severity: High12. Log off your System. Perform 3 invalid login ncident respone network forensics.htmlSECURITY USE CASES USING SPLUNK
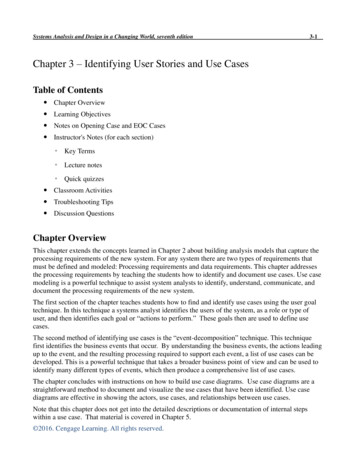
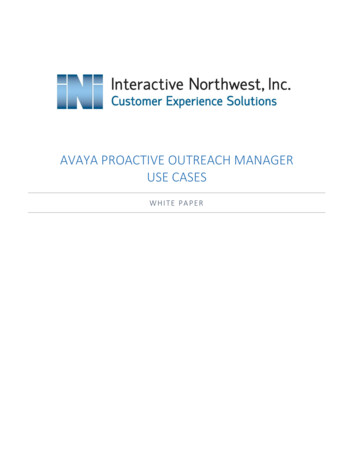
713. Open Splunk. Navigate to Activity Triggered Alert. There you can see the alert triggered. Youwill see a lot of alerts because alert is configured to run in real time so it will continue to run14. Click on the View Results on the top most alert which actually resulted from unsuccessful loginsto see results.Use Case 2: Acceptable Use MonitoringAcceptable Use Monitoring covers a basic questions, i.e. what resource is being accessed bywhom and when. Organizations generally publish policies for users to understand how they canuse the organization’s resources in the best way. Organizations should develop a baselinedocument to set up threshold limits, critical resources information, user roles, and policies, anduse that baseline document to monitor user activity, even after business hours, with the help ofthe SIEM solution.Problem Statement: Alert in real time whenever a user access a file.Log Source: Windows Security LogsSplunk Query: sourcetype "WinEventLog:Security" EventCode 4663 stats count by Account Name,Object Name ,Accesses rename Account Name as UserName,Object Name as FileName,Accesses asAction table UserName,FileName,ActionHow to read this query: we are collection windows security event logsand will moitor EventCode 46663which throws back actions being taken on the file. Space in splunk is a AND operator. Then we areperforming a statistical operation on files with username and action. Finally I am just renaming the fieldsto make them more understandable.Steps to simulate the Use-Case:1. Open Local Security Policy and Enable Auditing for Object Access as shown dent respone network forensics.htmlSECURITY USE CASES USING SPLUNK
82. Create new file on desktop names “Test Access”.3. Enable Auditing for everyone on this. CRight click on File Properties Advanced Auditing4. Enter “Everyone” as the Object Name.5. Enable all type of controls on ent respone network forensics.htmlSECURITY USE CASES USING SPLUNK
96. Open Splunk. We do not need to add new data for this use. Windows Security Event logs will begood enough. IF you have not followed Use Case 1, please see above on how to feed splunk.7. Open Splunk And write this query: sourcetype "WinEventLog:Security" EventCode 4663 statscount by Account Name ,Object Name ,Accesses rename Account Name asUserName,Object Name as FileName,Accesses as Action table UserName,FileName,Action8. Hit enter to run. You might not see the results.9. Save this as an alert. Click on Save as Alert.10. Fill in below Alert definition.a. Name:File Accessb. Alert Type: Scheduled and configured to run it every hour (at oth minute past everyhour).c. Set Triger Condition to: Fire this alert whenever number of results are greater than 0and for each resultd. Set Trigger Action to ‘Add to Triggered ncident respone network forensics.htmlSECURITY USE CASES USING SPLUNK
1011. Open Test Access file and the see the triggered alert under Activity Triggered Alert. Mostprobably you will not see anything. Why? Because your alert is configured to run at 0th minutepast every hour.12. To run this alert now, navigate to Settings ’Searches, reports and Alerts’.13. There you will see all the alerts. Find Alert Name File Access and Click on Run14. Below result screen will come to tell you that who(Username) has performed what Action onwhat courses/incident respone network forensics.htmlSECURITY USE CASES USING SPLUNK
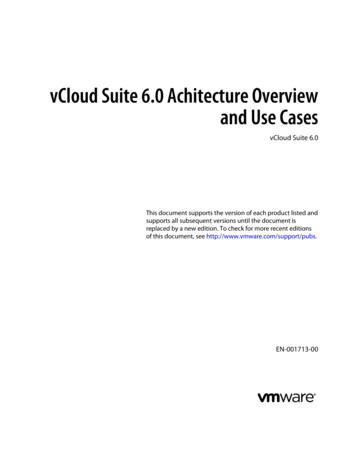
11Use Case 3: Registry MonitoringUsually whenever an executable install it made some changes to registry. So it is worth monitoringregistry events/actions like set, delete etc.Problem Statement: Alert in schedule time whenever a registry SetAction event took placeLog Source: Windows Registry LogsSplunk Query: index main sourcetype WinRegistry stats values(data) by key path,registry type,host rename host as "Machine Name" registry type as Action values(data) as "New Value" key path as"Path to Subkey"How to read this query: We are collection registry events in splunk default index main and monitoringfor Action Values (which is set in this case) and performing a statisctics over the values as shown in.Remember every space in splunk is converted into an AND operator and is a pipeline. At the end weare just renaming the fields to make them more understandable.Steps to simulate the Use-Case:1. Open Splunk, Navigate to Settings Data Inputs.2. Click on Registry Monitoring3. Click t respone network forensics.htmlSECURITY USE CASES USING SPLUNK
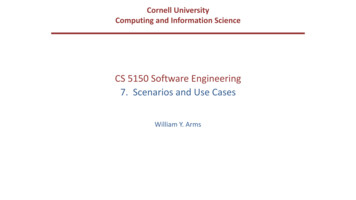
124. Enter the definition of this registry monitoring like belowa. Enter a name for this monitoringb. Click Browse to monitor any hive for this among following:i. HKEY USERSii. HKEY LOCAL MACHINEiii. HKEY CURRENT USERiv. HKEY CURRENT CONFIGc. For demonstrative purpose I have selected HKEY LOCAL MACHINE\SOFTWARE\Splunk.d. Enter the Action that you want to monitor on this hivei. Createii. Deleteiii. Openiv. Renamev. SetFor this exercise, select Action sete. Click Nextf. Confirm the settingg. Click Submit and its done.5. Reconfirm the monitoring of this registry setting by clicking on tings Data Inputs RegistryMonitoring Reg Mon and see the action selected. Make sure that ‘set’ action is ncident respone network forensics.htmlSECURITY USE CASES USING SPLUNK
13‘Set’ action will generate a Set event when a program executes a SetValue method on a Registrysubkey, thus setting a value or overwriting an existing value on an existing Registry entry.6. Now Click on Windows Start button and type ‘regedit’ to open registry. Navigate to HKLM Software Splunk .7. On the right hand pane, double click on ProductName and Change the value from ‘SplunkEnterprise’ to ‘Splunk Use Case Infosec Institute’and click OK.8. Now open search app in splunk and type this queryindex main sourcetype WinRegistry stats values(data) by key path,registry type,host rename host as "Machine Name" registry type as Action values(data) as "New Value" key pathas "Path to Subkey"9. Set this to alert in Splunk as Save As Alert and enter below alert definitions as shown inscreenshot dent respone network forensics.htmlSECURITY USE CASES USING SPLUNK
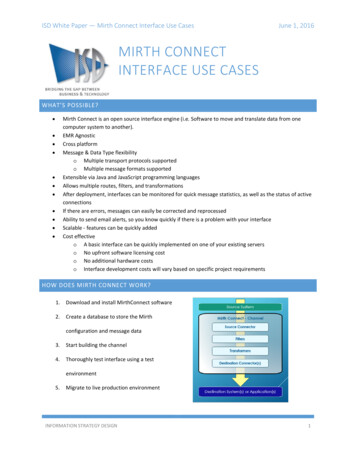
1410. Since this is also a scheduled alert, navigate to Settings ’Searches, reports and Alerts’.11. There you will see all the alerts. Find Alert Name Reg Mon Alert and Click on Run12. Below is the result screen which states the following parameter:a. Path to subkey: Path to subkey which has changedb. Action: What sort of action has taken place.In this case it will be SetActionc. Host: On which host this has changed.d. New Value: What the value of this subkey. I have taken values(data) to concatenate allchanged values for this subkey. You can see the changed value “Splunk Use Case InfosecInstitute” in the ident respone network forensics.htmlSECURITY USE CASES USING SPLUNK
15Other Use Cases which students can do on their ownMonitoring Rouge Name ServersTo monitor this type of activity, DNS, proxy and perimeter firewalls should be configured to send logs toSplunk. Inside Splunk creation of SIEM rule will actually monitor these logs:index perimeter firewall or index dns (TCP 53 OR UDP 53) NOT [ inputlookupinternal dns list append t dns ] dedup dns rename dns as rouge dns tablerouge dnsThis query will perform a lookup of perimeter firewall logs for TCP/UDP 53 with all the knownlocal/internal DNS names and will list all other DNS names which can possibly is a rouge Name server.Monitoring Rouge Proxy serversAlthough bots have become more advanced and uses internal proxy server for outer communication,there are still some versions which do not do this. So whenever the traffic that is hitting theperimeter firewall do not contain proxy ip, raise an alert. Below is a query that can be used to detectthis:Index perimeter firewall NOT [inputlookup proxy ip append t ip] dedup IP] table IPhttp://www.infosecinstitute.com/courses/incident respone network forensics.htmlSECURITY USE CASES USING SPLUNK
16What this will do is to lookout for traffic at perimeter firewall for IP other than the mentionedproxy ip addressee’s which might possible a rouge proxy server. In this also we can leverage thesplunk lookup feature.Monitoring Insecure Ports and ServicesWe can monitor insecure ports and services being opened in the endpoints in splunk. To do this first wehave to feed the endpoint machine data in splunk. A script likeNetstat –ln egrep “ tcp udp” and write the data to log file. If the resulting log file is localto Splunk then we can take this file directly as an input into Splunk or if resulting log file isremote it can be collected using Splunk Universal Forwarder. Then we can monitor forinsecure ports and services.Index endpoint log [inputlookup insecure list append t port, services] table hostname, port, serviceI this the lookup list insecure list contain the known insecure port and services which in turn getsmatched up the endpoint logs. If match found alert is raised.Detection of possible Applications AttacksSince now days insider threats are on the rise, it is very much possible for insiders to conduct attack onapplications like Cross Sit Scripting (
SECURITY USE CASES USING SPLUNK Security Use Cases with Splunk This article focuses on security use cases that can be created and managed within Splunk. For this article we will be using Splunk Free Enterprise version as it gives me indexing of 500MB free every day. Also this will be standalone architecture to collect, parse and extract events rather a distributed architecture where