Transcription
Charts on Q1 FY 2020/21Facts & FiguresTicker: TKA (Share) TKAMY (ADR)February 2021
Q1: Dynamic market (auto) tailwinds – EBIT adj. and FCF in ve territory and above expectations EBIT adj. 78 mn – all segments (except MT) with positive contribution – by demand recovery and value lever executionPerformance Positive FCF bef. M&A 32 mn – by stringent cash control, tight NWC mgmt.turnaround Net Cash unchanged at 5.1 bn Steel Europeo All options – stand-alone, sale, spin-off – under value assessmentPortfolioupdate ELAN Hydro-QuébecMulti Trackso Heavy Plate: closure initiated, completion expected until end of FYo Mining equipment: start of due diligence with biddero Chemical plants: M&A stopped given promising dynamics for Water Electrolysisbusiness for green Hydrogen production - project funnel expandingOutlookraise FY Outlook lifted up due to better than anticipated performance in Q1o FY EBIT adj. towards break-even (before: “mid 3-digit –ve”); all segments (except MT) improving and veo FCF bef. M&A towards (1) bn –ve (before: “ (1.5) bn –ve”)2 thyssenkrupp AG l February 2021Hydrogen: 80 MW Water Electrolysisengineering contract (Jan 21)
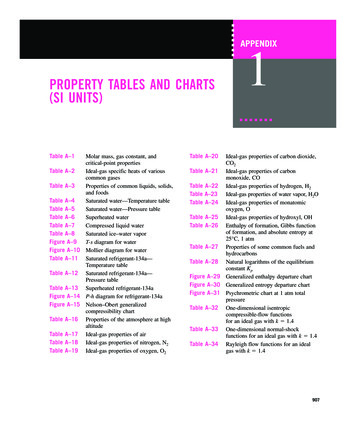
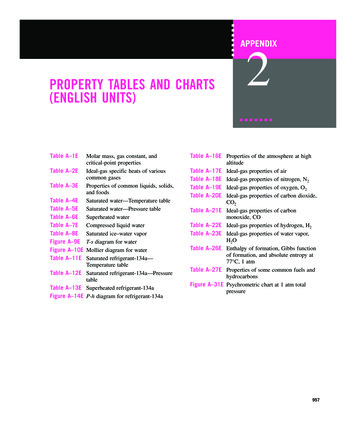
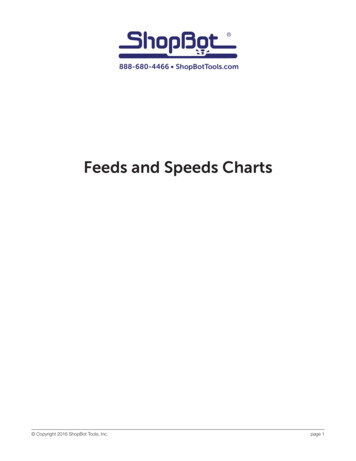
Dynamic markets and strong execution of effective Value Levers drive performance turnaround[ mn]78EBIT adj.[ mn]EBIT adj. Top-line: Higher demand also by market share gains mainly at cyclical auto/truckrelated businesses (AT, IC, SE)(185)(601) Bottom-line: Efficiency and restructuring initiatives under execution and on schedule32 Further headcount reduction of 560 FTEs ( 50% in Germany) in Q1FCF bef. M&A[ mn] Total headcount reduction by 5,500 FTEs yoy;thereof 4,200 FTEs of current target (11,000 FTEs1) already achieved(1,503)(2,407)FCF bef. M&A5.1Net Cash[ bn](7,1)1. Target of 11,000 FTEs until FY 22/233 thyssenkrupp AG l February 20215.1 Performance turnaround Tight NWC mgmt. incl. early customer payments Inventory levels not yet fully aligned with faster than anticipatedmarket dynamicsQ1 19/20Q4 19/20Q1 20/21
Order intake significantly up yoy[ mn]Q1Materials Services (MX)Δ2020/212019/20Q4Q1Q1 yoy1yoyyoy (ex ve Technology (AT)1,1481,1541,1833%5%Steel Europe (SE)2,0541,9652,40817%18%1091,870258 4298,3697,8456%8%Industrial Components (IC)Marine Systems (MS)Multi Tracks (MT)Corporate Headquarters (HQ)ReconciliationGroup continuing operationsMX: Higher warehousing shipments, offset by lowerstainless steel prices and unfavorable product mixIC: Sig. up yoy and qoq due to very positive ordersituation at bearings for wind energy mainly inGermany and China as well as strong demandrecovery at Forged TechnologiesAT:Sequential recovery continues and leads toincrease qoq but also yoy; support by further rampup of new plants and projects (mainly steering)and stable demand from ChinaSE: Significant higher volumes across all industries, inparticular at AutoMS: Positive due to additional volume for a submarineorder as well as a marine electronic order for theRoyal NavyMT: Up yoy due to increasing demand for stainlesssteel; markets for new orders in PT businesses stillchallenging due to pandemic, but positive signalsqoq; lower orders for HP due to planned closureNote: Prior year adjusted for new organizational structure as of 01.10.20204 thyssenkrupp AG l February 2021
Sales[ mn]Q1Materials Services (MX)Δ2020/212019/20Q4Q1Q1 yoy1yoyyoy (ex ive Technology (AT)1,1821,0881,2153%5%Steel Europe 1,200(17%)(15%)175 rial Components (IC)Marine Systems (MS)Multi Tracks (MT)Corporate Headquarters (HQ)ReconciliationGroup continuing operationsMX: Total shipments stable yoy; weak demand in theaerospace industry, lower stainless steel pricesand unfavorable product mix at trading businessIC: Sig. increase yoy mainly driven by bearings forwind energy in China; qoq also supported bystrong recovery at Forged TechnologiesAT: Sales mirror order intake; continued recoveryleads to increase qoq and yoySE: Higher shipments and better product mix with sig.higher auto demand above prior yearMS: Slower progress as planned on the execution ofcontracts due to subcontractors and relatedCorona impactMT: Decline yoy since better volumes in Stainlessbusiness cannot compensate decrease at PT dueto lower order activity in the pastNote: Prior year adjusted for new organizational structure as of 01.10.20205 thyssenkrupp AG l February 2021
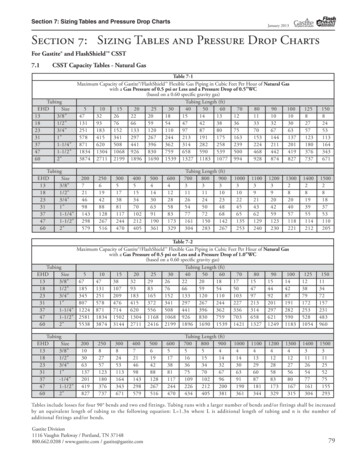
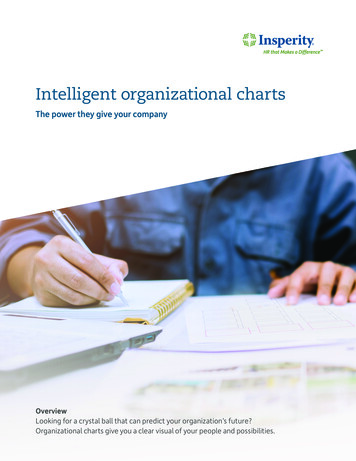
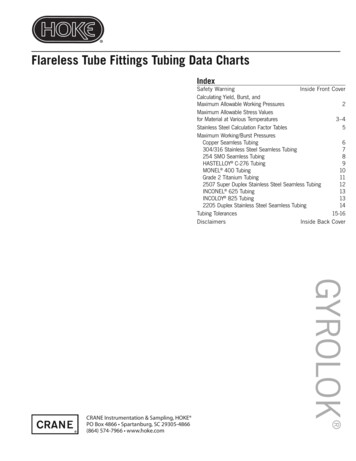
All segments (except MT) with positive contribution to EBIT adj.Dynamic markets and strong execution of effective Value Levers drive performance turnaround [ mn]2019/20Q12020/21ΔQ1yoyQ4Materials Services (MX)12(51)5Industrial Components (IC)4417101 Automotive Technology (AT)46(112)109 (127)(203)20 1125 Multi Tracks (MT)(92)(211)(111)(20%)Corporate Headquarters (HQ)(65)(46)(54)17%(4)(7)3(185)(601)78Steel Europe (SE)Marine Systems (MS)ReconciliationGroup continuing operations(63%) MX: Stable shipments with unfavorable product mix and lower stainlesssteel prices; decline in aerospace industry;reduction of logistics sites plus personnel cuts to support cost baseIC: Mainly due to Bearings (volume, structure and measures) and evenmore qoq Forged Technologies, supported by ongoing recovery;sig. ve margins at FT by higher sales and strict cost reductionAT: Sig. ve margin by stronger sales with higher production efficiency,favorable order structure (incl. new products), lower D/A;also supported by cost savings from restructuringSE: Sig. higher shipments ( 10%), better product mix (auto), improvedutilization and lower D/A; add. supported by ve restructuring effectsMS: Performance initiatives stabilize margins in order backlog and neworders; higher margins in new orders also by optimization of projectexecution as part of consequent cost controlMT: Lower contribution from PT (lower sales) and Stainless (marketrelated developments on price and cost side); qoq however, overalllosses cut by half also with support from cost and efficiencymeasuresNote: Prior year adjusted for new organizational structure and new special items guideline as of 01.10.20206 thyssenkrupp AG l February 2021
Business cash flow (BCF) and Free cash flow before M&A[ mn]2019/20Q1BCFMaterials Services (MX)BCFQ4ΔQ1yoy(681)(368)134 Industrial Components (IC)(50)(45)149 BCFAutomotive Technology (AT)(211)(107)140 BCFSteel Europe (SE)(1,019)(167)(131)87%BCFMarine Systems (MS)(45)(51)(137)--BCFMulti Tracks (MT)(176)(512)56 BCFCorporate Headquarters )27%BCFGroup continuing operations(2,322)(1,452)81 Interest payments(29)(32)(28)3%Tax payments(57)(19)(20)65%(2,407)(1,503)32 FCF b. M&A Group continuing operationsNote: Prior year adjusted for new organizational structure and new special items guideline as of 01.10.202072020/21 thyssenkrupp AG l February 2021Q1 yoyMX: Mainly due to normalization of NWC in priorquarter (omission of Y/E measures)IC: Higher earnings, NWC release (terminationnegative Q1-effects from year-end measures),higher prepaymentsAT: Higher earnings, NWC release (payables) andlower investmentsSE: Higher earnings additionally supported bystringent cash control and NWC-measures(mainly receivables and payables)MS: Determined by milestone payment profile andorder intake related down payment, respectivelyMT: Mainly NWC release at stainless steel business(termination negative Q1-effects from year-endmeasures)
Special items - continued focus on restructuring[ mments on Q1 Sale of activities in Thailand Reduced provision for restructuring at System Engineering Body as aresult of negotiation outcome Restructuring at Heavy Plate in connection with closure1(3)73(1)MSSEATICMXDisposal effectImpairmentRestructuringDisposal effectImpairmentRestructuringDisposal effectImpairmentRestructuringDisposal effectImpairmentRestructuringDisposal effectImpairmentRestructuringDisposal effectImpairmentRestructuringDisposal k cont. ote: Prior year adjusted for new organizational structure and new special items guideline as of 01.10.20208 thyssenkrupp AG l February (54)
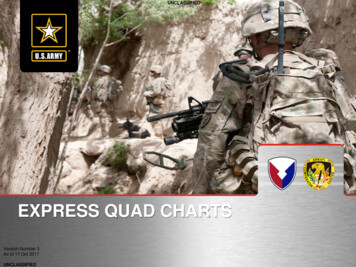
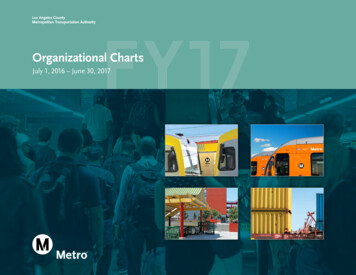
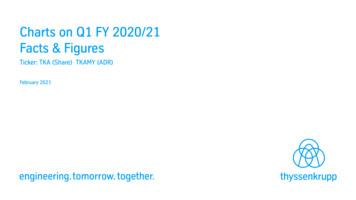
FY outlook raise: EBIT adj. towards break-even with all segments positive (except MT)GDP assumptions 2021: Germany 3.0%, USA 4.3%, China 7.5%towardsbreak evenEBIT adj.mid 3-digit-ve (1.8) bnQ1 better than in Nov 2020 anticipated,for FYE the following has to be considered:FCFbef. M&A (1.5) bn-vetowards (1) bn -ve9 thyssenkrupp AG l February 2021o MT with -ve low-mid 3-digit mn in EBIT adj. and FCF bef. M&Ao Raw material costs with effect also on NWCo Investments for performance and value upside (5.5) bnFY19/20o Limited visibility (lockdowns; progress of vaccinations) for H2 FYOld guidance New guidanceFYE 20/21 Restructuring cash-out by low-mid 3-digit mn Capex for competitiveness and selective growth
Outlook FY 20/21 raised due to better than anticipated performance/market dynamics in Q1[ mn]19/201 20/21EOutlook FY 20/21EQ1 20/21 Q2 20/21EMX(85)Sig. improvement back to positive due to structural improvements, absence of negative one-time effects and sig.increase in volumes (from low level, but not expected to return to pre-crisis levels)IC139Sig. higher, supported by recovery in the market for forgings and continued robust demand for bearings101AT(166)Sig. improvement back to a clearly positive figure mainly from rising contribution from the new plants and projects,continuing efficiency measures and lower D/A109SE(820)Sig. improvement to break-even reflecting structural improvements from Strategy 20-30, lower D/A and sig. volumerecovery (from low level, but not expected to return to pre-crisis levels)20MS20Higher, supported by performance measures and improvements in project execution5MT(593)(221)Cons./Others (57)HQ/EBIT adj. (1,782)Significant improvement to a loss in low to mid 3-digit m range; key drivers are Plant Technology and ASTImprovement vs. prior-year level with a more efficient holding company structureand further reduction in costsSig. improvement towards almost break even as a result of improved demand in our materials and automotivecomponents businesses and due to clear structural progress in all businesses;however still dependent on themarket situationNet income (5,541)High 3-digit mn -ve, despite clear operating improvements and the absence of impairments from the prior yearFCF b. M&A (5,515)Sig. improvement, towards (1) bn, as a result of earnings improvements in all segments, absence of cartel fine atSE, with continuing restructuring cash-out (low to mid 3-digit m range) and depending on cash inflows from OI andpayment profile of projects at MS and PT (MT)1. 2019/20 figures adjusted for Portfolio changes and new special items guideline10 thyssenkrupp AG l February 20215(111)(54)378(121)32
Group of Companies – target portfolio defined for turnaround and true performance cultureReporting structure as of October 01, 2020Former BA TBearingsSprings & StabilizersPowertrain SolutionsBattery ologyCement TechnologiesMSChemical & ProcessTechnologiesForgedTechnologiesMining ATSteelEuropeMarineSystemsSales2 9.9 bnEBIT adj.2,3 (85) mnMSSEDual TrackStand aloneEvolve on their own orby industry consolidationEvolve on their ownSEInfrastructureBearingsMXMXASTGroup of CompaniesMaterials lsServicesM&A processstopped due topromisingdynamics forWater ElectrolysisHeavy PlateMulti Tracks1ASTSPCEMSY PTSSY BTSCCCPTHPtkE stakeMINInfrastructuretk not best sole ownerSell, Partnership, Close 2.1 bn 4.1 bn 7.0 bn 1.8 bn 5.5 bn 139 mn (166) mn (820) mn 20 mn (593) mn1. HP: Heavy plate (SE); Infrastructure: Technical Services excl. Mill Services & Systems (MX); SP: Springs & Stabilizers (AT); BTS: OU Battery Solutions (SY); PTS: OU Powertrain Solutions (SY); AST: Acciai Speciali Terni, stainless steel production and stainlessdistribution (MX); CPT: Chemical Plants, MIN: Mining, CEM: Cement (PT), CC: Carbon Components l 2. Prof-forma based on FY 2019/20 l 3. Adjustments according to stricter guideline special items as of October 01, 2020Shift to Multi Track11 thyssenkrupp AG l February 2021
Key financials1Continuing operations[ mn]Q12019/20Q3Q2Q4FY2020/21Q1Order ,255)24EBIT (810)(3,771)(5,593)(89)Net rib. to tk AG .11)(1.33)(5.75)(8.91)(0.23)Operating cash flow(2,109)(58)(1,004)(1,053)(4,224)265Cash flow from divestm.562114,73814,769873Cash flow from investm.(295)(318)(241)(1,334)(2,188)(274)Free cash flow(2,399)(371)(1,224)12,3518,357864FCF before 23104,356103,598103,598103,128EBITDAEBITDA adjustedEarnings per share ( )EmployeesFull GroupØ Capital Employed17,85118,22018,26617,60817,60813,073(incl. short-term securities)2,0872,5252,59111,55511,55510,619Net financial 41,174(9)10,17410,1749,929Cash and cash equivalents1. Prior year adjusted for new organizational structure and new special items guideline as of 01.10.2020 2. Attributable to tk AG
01.10.2020 · Charts on Q1 FY 2020/21 Facts & Figures Ticker: TKA (Share) TKAMY (ADR) . Dynamic market (auto) tailwinds –EBIT adj. and FCF in ve territory and above expectations EBIT adj. 78 mn –all segments (except MT) with positive contribution –by demand recovery and value lever execution Positive FCF bef. M&A 32 mn –by stringent cash control, tight NWC mgmt. Net Cash .