Transcription
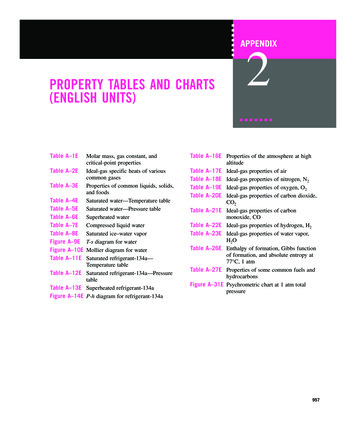
cen2932x ch19-ap02 p957-998.qxd12/18/0910:06 AMPage 957APPENDIXPROPERTY TABLES AND CHARTS(ENGLISH UNITS)Table A–1ETable A–2ETable A–3ETable A–4ETable A–5ETable A–6ETable A–7ETable A–8EFigure A–9EFigure A–10ETable A–11ETable A–12ETable A–13EFigure A–14EMolar mass, gas constant, andcritical-point propertiesIdeal-gas specific heats of variouscommon gasesProperties of common liquids, solids,and foodsSaturated water—Temperature tableSaturated water—Pressure tableSuperheated waterCompressed liquid waterSaturated ice–water vaporT-s diagram for waterMollier diagram for waterSaturated refrigerant-134a—Temperature tableSaturated refrigerant-134a—PressuretableSuperheated refrigerant-134aP-h diagram for refrigerant-134a2Table A–16E Properties of the atmosphere at highaltitudeTable A–17E Ideal-gas properties of airTable A–18E Ideal-gas properties of nitrogen, N2Table A–19E Ideal-gas properties of oxygen, O2Table A–20E Ideal-gas properties of carbon dioxide,CO2Table A–21E Ideal-gas properties of carbonmonoxide, COTable A–22E Ideal-gas properties of hydrogen, H2Table A–23E Ideal-gas properties of water vapor,H2OTable A–26E Enthalpy of formation, Gibbs functionof formation, and absolute entropy at77 C, 1 atmTable A–27E Properties of some common fuels andhydrocarbonsFigure A–31E Psychrometric chart at 1 atm totalpressure957
cen2932x ch19-ap02 p957-998.qxd12/18/0910:06 AMPage 958958PROPERTY TABLES AND CHARTSTABLE A–1EMolar mass, gas constant, and critical-point propertiesSubstanceFormulaMolarmass, bon dioxideCarbon monoxideCarbon hane (R-12)Dichlorofluoromethane (R-21)EthaneEthyl alcoholEthyleneHeliumn-HexaneHydrogen (normal)KryptonMethaneMethyl alcoholMethyl chlorideNeonNitrogenNitrous oxideOxygenPropanePropyleneSulfur dioxideTetrafluoroethane (R-134a)Trichlorofluoromethane 9742.08164.063102.03137.3718.015131.30Gas constant, 520.078110.59560.08172Critical-point 3.193.970.901.90*Calculated from R Ru /M, where Ru 1.98588 Btu/lbmol·R 10.7316 psia·ft3/lbmol·R and M is the molar mass.Source: K. A. Kobe and R. E. Lynn, Jr., Chemical Review 52 (1953), pp. 117–236, and ASHRAE, Handbook of Fundamentals (Atlanta, GA: AmericanSociety of Heating, Refrigerating, and Air-Conditioning Engineers, Inc., 1993), pp. 16.4 and 36.1.
cen2932x ch19-ap02 p957-998.qxd12/18/0910:06 AMPage 959959APPENDIX 2TABLE A–2EIdeal-gas specific heats of various common gases(a) At 80 FGasFormulaAirArgonButaneCarbon dioxideCarbon H4HeH2CH4NeN2C8H18O2C3H8H2OGas constant, 335Source: Gordon J. Van Wylen and Richard E. Sonntag, Fundamentals of Classical Thermodynamics, English/SI Version, 3rd ed.(New York: John Wiley & Sons, 1986), p. 687, Table 041.321.6671.4001.0441.3951.1241.329
cen2932x ch19-ap02 p957-998.qxd12/18/0910:06 AMPage 960960PROPERTY TABLES AND CHARTSTABLE A–2EIdeal-gas specific heats of various common gases (Continued )(b) At various temperaturesTemp., 802.4842.4882.4922.5092.5192.5282.6332.773kCarbon dioxide, 2550.2620.2690.2750.2800.2980.312Hydrogen, 890.1910.1940.1980.2120.222kCarbon monoxide, 690.2730.2870.297Nitrogen, .3281.314Oxygen, 261.3091.298Note: The unit Btu/lbm·R is equivalent to Btu/lbm· F.Source: Kenneth Wark, Thermodynamics, 4th ed. (New York: McGraw-Hill, 1983), p. 830, Table A–4. Originally published in Tables of Properties ofGases, NBS Circular 564, 1955.
cen2932x ch19-ap02 p957-998.qxd12/18/0910:06 AMPage 961961APPENDIX 2TABLE A–2EIdeal-gas specific heats of various common gases (Concluded )(c) As a function of temperaturec p a bT cT 2 dT 3(T in R, cp in ogenCarbon monoxideCarbon dioxideWater vaporNitric oxideNitrous oxideNitrogen dioxideAmmoniaSulfurSulfur dioxideSulfur trioxideAcetyleneBenzeneMethanolEthanolHydrogen .3167.7007.0085.7585.486.58466.4996.1573.9185.21 8.6504.554.757.2444.7501.648 0.9660.945 1.8901.6181.6570.9440.753b 0.020850.20170.02609 0.025420.022220.793610.02552 .43221.2142.781 62c 10 210 210 210 210 210 210 210 210 210 210 210 210 210 210 210 210 210 210 210 210 210 210 210 210 210 210 210 20.05957 0.05275 0.03540 0.02952 0.03960 0.2581 0.07781 0.07185 0.2596 0.260 0.073034 0.1200 0.2810 0.8256 0.4812 2.327 0.0898 0.7651 0.09783 0.09352 0.4722 1.159 1.352 1.696 1.656 2.112 0.6151 0.8981 % errorTemperaturerange, RMax.Avg.d10 510 510 510 510 510 510 510 510 510 510 510 510 510 510 510 510 510 510 510 510 510 510 510 510 510 510 510 5 0.1176 0.05372 0.08052 0.03565 0.09100 0.3059 0.1472 0.1715 0.4331 0.322 0.27402 0.1632 0.3527 1.328 0.7457 3.179 0.329 0.821 0.1776 0.4510 0.2984 1.300 1.433 2.044 1.732 2.363 0.7326 1.008 10 910 910 910 910 910 910 910 910 910 910 910 910 910 910 910 910 910 910 910 910 910 910 910 910 910 910 910 ource: Chemical and Process Thermodynamics 3/E by Kyle, B. G., 2000. Adapted by permission of Pearson Education, Inc., Upper Saddle River, NJ.
cen2932x ch19-ap02 p957-998.qxd12/18/0910:06 AMPage 962962PROPERTY TABLES AND CHARTSTABLE A–3EProperties of common liquids, solids, and foods(a) LiquidsBoiling data at 1 atmSubstanceNormalboilingpoint, FAmmonia 27.9Latent heat ofvaporization,hfg Btu/lbm24.54Freezing dataFreezingpoint, FLatent heatof fusion,hif Btu/lbm 107.9138.6ArgonBenzeneBrine (20%sodium chlorideby mass)n-ButaneCarbon dioxideEthanolEthyl alcoholEthylene uryMethane 302.6176.469.5169.4 308.741.912.054.2219.031.1 109.2*172.8173.5388.6355.8 452.1 423.010.9399–559674.1 258.7—165.699.6 (at 32 F)360.5368344.04199.80191.7157.8108126.7219.60.7 217.3 69.8 173.6 248.812.666.0— 434.5 255.5 12.8 .9025.1MethanolNitrogen148.1 320.447385.4 143.9 346.042.710.9OctaneOil (light)OxygenPetroleumPropane256.6— 297.3— 43.7131.7—91.599–165184.0 71.577.9 361.85.9 305.834.4 141.9—32143.5Refrigerant-134a 15.0Water21293.3970.1Liquid propertiesDensity,r lbm/ft3Specificheat, cpBtu/lbm·R 27.904080 0.2720.4116831.13277686868 452.1 423.010.96877 258.7 16077 320.4 2606877 297.368 43.732100 40 perature, F*Sublimation temperature. (At pressures below the triple-point pressure of 75.1 psia, carbon dioxide exists as a solid or gas. Also, the freezing-pointtemperature of carbon dioxide is the triple-point temperature of 69.8 F.)
cen2932x ch19-ap02 p957-998.qxd12/18/0910:06 AMPage 963963APPENDIX 2TABLE A–3EProperties of common liquids, solids, and foods (Concluded )(b) Solids (values are for room temperature unless indicated otherwise)Specificheat, cpBtu/lbm·RDensity,r lbm/ft3SubstanceDensity,r lbm/ft3SubstanceMetalsSpecificheat, cpBtu/lbm·RNonmetalsAluminum 100 F32 F100 F200 F300 F400 F500 FBronze (76% Cu, 2% Zn,2% Al)Brass, yellow (65% Cu,35% Zn)Copper 60 F0 F100 F200 F390 FIronLeadMagnesiumNickelSilverSteel, 0.09555190.0955170AsphaltBrick, commonBrick, fireclay (500 C)ConcreteClayDiamondGlass, windowGlass, pyrexGraphiteGraniteGypsum or plaster boardIce 50 F0 F20 F32 FLimestoneMarblePlywood (Douglas fir)Rubber (soft)Rubber (hard)SandStoneWoods, hard (maple, oak, etc.)Woods, soft (fir, pine, 0(c) FoodsFoodApplesBananasBeef roundBroccoliButterCheese, SwissCherriesChickenCorn, sweetEggs, wholeIce creamWatercontent,% (mass)8475679016398074747463Specific heat,Btu/lbm·RFreezingpoint, FAbovefreezingBelowfreezingLatentheat 110896129235611510610610690FoodLettuceMilk, wholeOrangesPotatoesSalmon fishShrimpSpinachStrawberriesTomatoes, 839390946493Specific heat,Btu/lbm·RFreezingpoint,AboveBelow Ffreezing t rce: Values are obtained from various handbooks and other sources or are calculated. Water content and freezing-point data of foods are fromASHRAE, Handbook of Fundamentals, I-P version (Atlanta, GA: American Society of Heating, Refrigerating, and Air-Conditioning Engineers, Inc., 1993),Chap. 30, Table 1. Freezing point is the temperature at which freezing starts for fruits and vegetables, and the average freezing temperature for otherfoods.
cen2932x ch19-ap02 p957-998.qxd12/18/0910:06 AMPage 964964PROPERTY TABLES AND CHARTSTABLE A–4ESaturated water—Temperature tableSpecific volume,ft3/lbmSat.press.,Psat psiaTemp.,T 1703.1Internal .01603 1430.40.01604 1206.10.01604 981.90978.52975.141036.71038.31040.01
Table A–26EEnthalpy of formation, Gibbs function of formation, and absolute entropy at 77 C, 1 atm Table A–27EProperties of some common fuels and hydrocarbons Figure A–31EPsychrometric chart at 1 atm total pressure PROPERTY TABLES AND CHARTS (ENGLISH UNITS) 957 APPENDIX2 cen2932x_ch19-ap02_p957-998.qxd 12/18/09 10:06 AM Page 957. TABLE A–1E Molar mass, gas File Size: 317KBPage Count: 42