Transcription
Intelligent organizational chartsThe power they give your companyOverviewLooking for a crystal ball that can predict your organization’s future?Organizational charts give you a clear visual of your people and possibilities.
TABLE OF CONTENTSIntroduction . . . . . . . . . . . . . . . . . . . . . . . . . . . . . . . . . . . . . . . . . . . . . . . . . . . . . . . . . . . . . . . . . . 3The business challenge. . . . . . . . . . . . . . . . . . . . . . . . . . . . . . . . . . . . . . . . . . . . . . . . . . . . . . . . 4The problem with current systems . . . . . . . . . . . . . . . . . . . . . . . . . . . . . . . . . . . . . . . . . . . . . 5The solution . . . . . . . . . . . . . . . . . . . . . . . . . . . . . . . . . . . . . . . . . . . . . . . . . . . . . . . . . . . . . . . . . . 6Obtaining a real-time view of the organization. . . . . . . . . . . . . . . . . . . . . . . . . . . . . . . . . . 7The rich analytics of workforce data. . . . . . . . . . . . . . . . . . . . . . . . . . . . . . . . . . . . . . . . . . . . 8Platform for planning and managing change. . . . . . . . . . . . . . . . . . . . . . . . . . . . . . . . . . . 10Measuring return on investment. . . . . . . . . . . . . . . . . . . . . . . . . . . . . . . . . . . . . . . . . . . . . . 11Indirect benefits: shortened planning cycles, faster reaction time . . . . . . . . . . . . . . 13Organizational management tools can help. . . . . . . . . . . . . . . . . . . . . . . . . . . . . . . . . . . . 14About Insperity . . . . . . . . . . . . . . . . . . . . . . . . . . . . . . . . . . . . . . . . . . . . . . . . . . . . . . . . . . . . . . 15
IntroductionOrganizations today need to evolve rapidly in order to react to market risks andopportunities. These needs require a holistic, unified view of the workforce andthe tools to quickly plan and execute future workforce scenarios.Employees need a way to navigate the organizational structure, tounderstand their roles and to quickly find information and resources theyneed to be effective.Most organizations rely on manual processes, which are disconnected andinaccurate, to create organizational charts. This is an expensive, imperfect andinefficient process.New technology solves the problems of creating real-time, unified charts. Itdelivers analytics about the organization and its key performance metrics andprovides intuitive tools to plan for the future – intelligent organizational charts.This technology can provide a significant return on investment (ROI), by helpingprovide increased productivity and gives you the ability to proactively manageorganizational plans to help reduce costs.Most important, intelligent organizational charting technology enablescompanies to react more quickly to opportunities and threats as they arise. Thatbenefit must be measured in opportunity cost terms, rather than traditional ROI.3
The business challengeManaging organizational changeIn a turbulent global economy with rapidly evolving technology and fast-moving political and social trends, the ability of anorganization to react to change is a key requirement to compete and survive.Management must respond quickly to threats and opportunities and rapidly execute changing business strategy. To do so,managers need the ability to instantly assess how their employees are being used and to rapidly plan responses to changingmarket conditions.At the same time, employees need to understand and navigate the changing company structure to effectively communicate,collaborate and plan.There is a need for human resources to understand and track the keyhuman capital metrics that affect business performance and risk,monitor changes and prepare the workforce for the future.However, getting and maintaining a comprehensive view of the workforce can be a challenge. Basic employee informationis often maintained in more than one system, while additional information supporting crucial business decisions is stored insolutions such as sales, cost center, performance management or succession planning systems.Without a system for planning change, supported by relevant and accurate information, timely decisions about how to planfor and utilize human capital are often not achieved. Valuable time is wasted by employees who can’t efficiently collaborate,and human resources is ill-equipped to manage or advise the executive branch on the greater human capital picture.4
The problem with current systemsOrganizational charts are the traditional tools for representing and managing the structure of an organization. But mostorganizations today are still challenged with the limitations of manual charts and don’t have an automated system to createand manage them.Current systems are characterized by: Charts are created manuallySimple drawing software is still the most frequently used tool for creating charts. They’re difficult to maintain andtime-intensive to format, update and distribute. These simple tools aren’t suitable for charts containing more than30-50 employees. Charts are inaccurateManual charts are usually outdated in a short period of time. Charts are expensive to create and maintainBecause these processes are manual, they’re expensive to create. Chart data is simplisticBecause manual data is laborious, the resulting charts generally contain only the most basic information, such asemployee name and title and don’t contain additional employee information or overall branch or company analytics. Chart data cannot be accessedWhen data is not stored in an accessible database, it doesn’t lend itself to analysis, navigation or reporting. Chart data is for visual consumption onlyOutput is typically a visual chart or printout; neither the software nor the data can be used for more than rudimentaryplanning or scenario building.With these limitations, it’s easy to understand why most companies have given up creating organizationalcharts or limp along with a semi-automated system that requires a high degree of management andmanual intervention.5
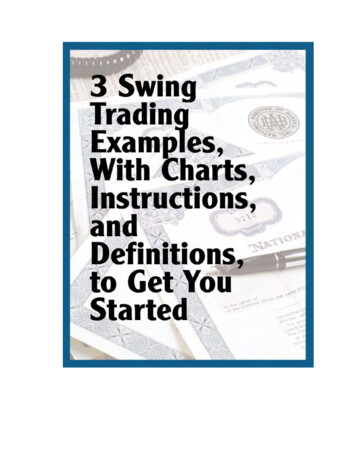
The solutionOrganizations need effective, intelligent charting technology that can provide: A unified, real-time, secure and accurate view of the organization, incorporating information from different systems Insightful analytics regarding key business and human resource drivers An easy-to-use platform for planning and executing change, based on company goals and strategy.Having a holistic view of your workforce makes it easier to make better business decisions and spur companywide growth.Organizational PlanningOrganizational planning helps you: Know your employees Learn how they’re affecting your company’s growth Align them to best realize your company goals6
Obtaining a real-time viewof the organization Provides a holistic viewAn HR system may contain all of the transactional data on employees, such as salary, tenure and location, but decisionmaking information is often stored in point solutions for sales, performance management or succession planning. Thisinformation needs to be consolidated with the HR system information to provide a holistic view of an employee ordepartment for organizational metrics. Represents all employeesIn large enterprises, employee data is often stored in multiple databases or systems. Companies that have grown throughconsolidation or without a strong, centralized human resources information system (HRIS) often don’t show outsourcedemployees, contractors, open positions or project teams in the source system. They may exist only in a spreadsheet oroffline system. An intelligent organizational charting system is able to merge data structures for a single unified view. Allows validation of dataMaking data available to relevant employees provides an opportunity to discover and correct bad data. Commonexamples include incorrect reporting relationships, employees no longer with the company, incorrect job titles andother information. Distributing the organizational chart results in much cleaner data, as the problem of validation andcorrection is taken care of at the source. Organizations converting to this new system find that collecting, validating anduploading information is significantly shortened and enhanced using an organizational charting system. Provides access to informationOn-demand information and accessibility to key performance data where employees can drill down through theorganization and zoom in on specific areas, search criteria and filter lists.7
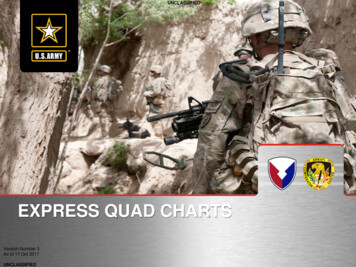
Provides collaboration of informationShare plans for workforce changes and easily analyze data for organizational restructures and future growth plans. Workwithin a sand-box environment to create and share what-if scenarios and review with business stakeholders for feedbackand approval. Analyze data for compliance criteriaOrganizations need to be able to evaluate structure for compliance purposes. Being able to visually assess division ofresponsibilities, reporting relationships and chain of command are achieved with intelligent organizational charts.The rich analytics of workforce dataIn addition to being able to navigate and search HR data, intelligent organizational charts provide integrated reporting,metrics and analysis. With this functionality, managers can study and seek to understand areas of risk or opportunity. Integrated reporting Workforce metrics Risk management Opportunity information8
Identify riskAn effective approach to establishing an “early warning system” to help identify business risks is to create a series of viewsin the chart. Developing views with calculated ongoing operational metrics that roll up into departments helps monitorcompliance deviation, succession risks and other potential organizational red flags.Metrics such as turnover, performance reviews, absenteeism, training compliance and workers’ injuries can be displayedvia the charting platform. The early warning system can be developed using the standard features of an intelligent chartingsystem for a fraction of the time and cost to implement generic business intelligence solutions.Reveal opportunitiesMetric reporting capabilities are used to avert risk as well as identify opportunities and plan for change. A succession plananalysis, for example, may include highlighting open positions based on certain criteria, the bench strength of nominatedcandidates, and gaps between base position competency and the nominees’ competencies.Merging HR data into one secure platform enables companies to assess their workforce effectiveness in detail and fromevery type of hierarchy, including geography and cost center. From basic headcount and salary to more sophisticatedmetrics, such as span of control and succession planning reports, an intelligent organizational chart can provide theknowledge necessary to drive smart decisions, leading to reduced risk, and higher productivity and effectiveness.There are high-performing people within your organization who you can trust to help your companythrive. You just have to find them. Learn how to determine which employees are really going above andbeyond in Pinpointing Your Company’s Key Players. Download this free guide today.A superior platform for chartingOrganizational charting software understands hierarchical data, such as the meaning of a manager orco-manager, a branch, a subordinate, an assistant, a dual reporting relationship, a peer or a level. Thismakes calculations easy.For example, calculating average salary for all non-managers between levels 3-7, in branches 1-2,excluding assistants or contractors, but including part-time employees, is simple using an intelligentorganizational charting solution.9
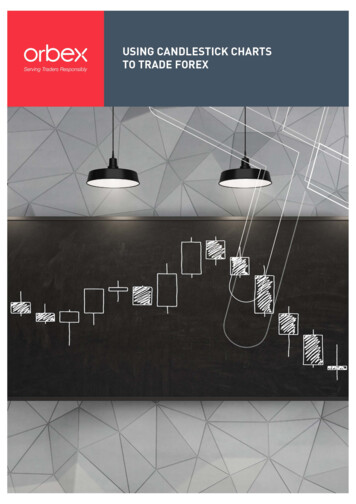
Platform for planning andmanaging changeAn organizational chart represents the configuration of human capital to meet organizational objectives. When theseobjectives change, it’s likely that the organizational chart needs to change as well. The technology platform not onlyprovides real-time information, but also the tools for planning and making decisions.HR departments routinely establish metrics that provide information on key performance areas like average salary, tenure,gender and diversity, turnover, absenteeism, productivity, competencies or readiness.A true workforce planning system goes further, however, and gives HR professionals and managers the ability to establishand monitor key performance indicators (KPI) based on scenarios for which they’re planning.This enables managers to establish a set of constraints or a dashboard that dynamically updates as the planning processevolves, indicates when a threshold or constraint has been reached, and keeps the planning process within establishedparameters or goals.A planning platform can allow companies to: Take a snapshot of the current organization Create constraints and goals for planning activity Create scenarios in collaboration with stakeholders Update personnel changes during the planning process Compare scenarios and help identify risks or conflicts10
Measuring return on investmentDirect savings of intelligent organizational chartsThe intelligent organizational chart is a powerful communication and planningsolution that drives workforce productivity. Beyond showing just a name andtitle, intelligent organizational charts provide visual communication of workforceinformation, visual access to HR metrics, and they can serve as an electronic platformfor planning and executing workforce change.Automated chart creation and distributionAutomation of the charting process results in considerable cost savings byeliminating the need for manual data gathering and chart creation. Manually createdcharts are never entirely accurate, since change often occurs during the collectionand creation process.See example on next page.Automation allows secure access to up-to-date information through an employeeportal or company intranet on demand. The labor and print costs of manualdistribution are eliminated. Unlike paper or static charts, role-based an
An organizational chart represents the configuration of human capital to meet organizational objectives. When these objectives change, it’s likely that the organizational chart needs to change as well. The technology platform not only provides real-time information, but also