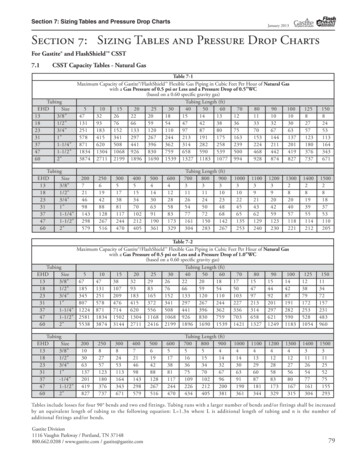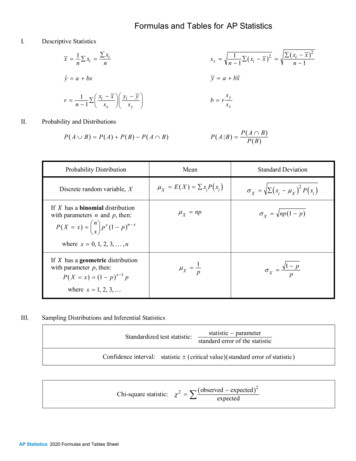
Transcription
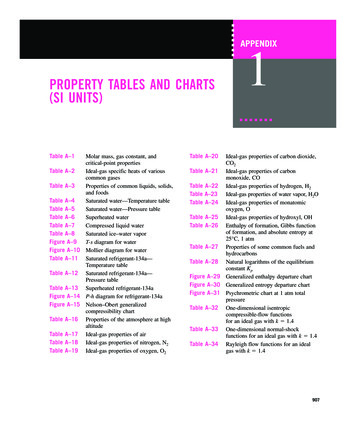
cen2932x ch18-ap01 p907-956.qxd12/18/0910:05 AMPage 907APPENDIXPROPERTY TABLES AND CHARTS(SI UNITS)Table A–1Molar mass, gas constant, andcritical-point propertiesTable A–2Ideal-gas specific heats of variouscommon gasesTable A–3Properties of common liquids, solids,and foodsTable A–4Saturated water—Temperature tableTable A–5Saturated water—Pressure tableTable A–6Superheated waterTable A–7Compressed liquid waterTable A–8Saturated ice–water vaporFigure A–9T-s diagram for waterFigure A–10 Mollier diagram for waterTable A–11 Saturated refrigerant-134a—Temperature tableTable A–12 Saturated refrigerant-134a—Pressure tableTable A–13 Superheated refrigerant-134aFigure A–14 P-h diagram for refrigerant-134aFigure A–15 Nelson–Obert generalizedcompressibility chartTable A–16 Properties of the atmosphere at highaltitudeTable A–17 Ideal-gas properties of airTable A–18 Ideal-gas properties of nitrogen, N2Table A–19 Ideal-gas properties of oxygen, O21Table A–20Ideal-gas properties of carbon dioxide,CO2Table A–21 Ideal-gas properties of carbonmonoxide, COTable A–22 Ideal-gas properties of hydrogen, H2Table A–23 Ideal-gas properties of water vapor, H2OTable A–24 Ideal-gas properties of monatomicoxygen, OTable A–25 Ideal-gas properties of hydroxyl, OHTable A–26 Enthalpy of formation, Gibbs functionof formation, and absolute entropy at25 C, 1 atmTable A–27 Properties of some common fuels andhydrocarbonsTable A–28 Natural logarithms of the equilibriumconstant KpFigure A–29 Generalized enthalpy departure chartFigure A–30 Generalized entropy departure chartFigure A–31 Psychrometric chart at 1 atm totalpressureTable A–32 One-dimensional isentropiccompressible-flow functionsfor an ideal gas with k 1.4Table A–33 One-dimensional normal-shockfunctions for an ideal gas with k 1.4Table A–34 Rayleigh flow functions for an idealgas with k 1.4907
cen2932x ch18-ap01 p907-956.qxd12/18/0910:05 AMPage 908908PROPERTY TABLES AND CHARTSTABLE A –1Molar mass, gas constant, and critical-point ominen-ButaneCarbon dioxideCarbon monoxideCarbon hane (R-12)Dichlorofluoromethane (R-21)EthaneEthyl alcoholEthyleneHeliumn-HexaneHydrogen (normal)KryptonMethaneMethyl alcoholMethyl chlorideNeonNitrogenNitrous oxideOxygenPropanePropyleneSulfur dioxideTetrafluoroethane (R-134a)Trichlorofluoromethane 3ClNeN2N2OO2C3H8C3H6SO2CF3CH2FCCl3FH2OXeMolar mass,M 31.30Gasconstant,R 490.060520.46150.06332Critical-point 00.19980.18100.12170.19930.24780.05600.1186*The unit kJ/kg·K is equivalent to kPa·m3/kg·K. The gas constant is calculated from R Ru /M, where Ru 8.31447 kJ/kmol·K and M is the molarmass.Source: K. A. Kobe and R. E. Lynn, Jr., Chemical Review 52 (1953), pp. 117–236; and ASHRAE, Handbook of Fundamentals (Atlanta, GA: AmericanSociety of Heating, Refrigerating and Air-Conditioning Engineers, Inc., 1993), pp. 16.4 and 36.1.
cen2932x ch18-ap01 p907-956.qxd12/18/0910:05 AMPage 909909APPENDIX 1TABLE A–2Ideal-gas specific heats of various common gases(a) At 300 KGasFormulaAirArgonButaneCarbon dioxideCarbon H4HeH2CH4NeN2C8H18O2C3H8H2OGas constant, 4051.2991.6671.4001.0441.3951.1261.327Note: The unit kJ/kg·K is equivalent to kJ/kg· C.Source: Chemical and Process Thermodynamics 3/E by Kyle, B. G., 2000. Adapted by permission of Pearson Education, Inc., Upper Saddle River, NJ.
cen2932x ch18-ap01 p907-956.qxd12/18/0910:05 AMPage 910910PROPERTY TABLES AND CHARTSTABLE A–2Ideal-gas specific heats of various common gases (Continued)(b) At various 69810.859kCarbon dioxide, n, on monoxide, 131.1261.1391.1631.185Nitrogen, 641.3581.3531.3431.335Oxygen, 501.3431.3371.3321.3271.3191.313Source: Kenneth Wark, Thermodynamics, 4th ed. (New York: McGraw-Hill, 1983), p. 783, Table A–4M. Originally published in Tables of ThermalProperties of Gases, NBS Circular 564, 1955.
cen2932x ch18-ap01 p907-956.qxd12/18/0910:05 AMPage 911911APPENDIX 1TABLE A–2Ideal-gas specific heats of various common gases (Concluded)(c) As a function of temperaturecp a bT cT 2 dT 3(T in K, cp in nmonoxideCarbondioxideWater vaporNitric oxideNitrous nen-HexaneEthylenePropyleneFormulaab 0.15711.5200.1967 0.1916c10 2 10 2 10 2 10 .265.981 32.240.1923 29.34 0.09395 24.115.8632 OHClCH4C2H6C3H8C4H10C4H10C5H12C6H14C2H4C3H60.8081 0.71550.48020.4003% errorTemperaturerange, KMax. Avg.d10 5 10 5 10 5 10 5 2.8731.312 1.966 0.8704 10 910 910 910 .721.010.340.280.330.260.1675 10 20.5372 10 5 2.222 10 9273–18000.890.3710 210 210 210 2 3.501 10 51.055 10 50.9747 10 5 3.562 10 57.469 3.595 4.18710.5810 910 910 910 .970.590.220.240.360.265.715 10 22.5630 10 22.218 10 2 3.52 10 50.99072 10 5 1.628 10 57.87 10 9 6.6909 10 93.986 10 60.385.795 10 2 3.812 10 58.612 10 9273–18000.450.24 10 210 210 210 210 2 11.20 6.527 31.57 1.22 10.38 10 510 510 510 510 532.4218.2177.62 8.03920.05 10 910 910 910 910 00.291.460.340.180.400.130.590.200.080.2230.33 0.7620 10 219.895.024 10 26.90017.27 10 2 4.0430.48 10 23.9637.15 10 2 7.91341.60 10 26.77445.43 10 26.93855.22 10 23.9515.64 10 23.1523.83 10 21.3271.269 6.406 15.72 18.34 23.01 22.46 28.65 8.344 12.18 10 510 510 510 510 510 510 510 510 510 5 4.338 11.017.28531.7435.0049.9142.2957.6917.6724.62 10 910 910 910 910 910 910 910 910 910 .280.120.240.130.210.200.130.1716.4021.8 36.2219.019.914.589.214348.4759.15220.96 Source: B. G. Kyle, Chemical and Process Thermodynamics (Englewood Cliffs, NJ: Prentice-Hall, 1984). Used with permission.
cen2932x ch18-ap01 p907-956.qxd12/18/0910:05 AMPage 912912PROPERTY TABLES AND CHARTSTABLE A–3Properties of common liquids, solids, and foods(a) LiquidsBoiling data at 1 atmSubstanceNormalboilingpoint, CAmmonia 33.3 185.980.2Latent heat ofvaporizationhfg , kJ/kg1357Freezingpoint, C 77.7 189.35.5Latent heatof fusionhif , kJ/kg322.4ArgonBenzeneBrine (20% sodiumchloride by mass)n-ButaneCarbon dioxideEthanolEthyl alcoholEthylene uryMethane103.9 0.5 78.4*78.278.6198.1179.9 268.9 252.8 11.7204–293356.7 161.5—385.2230.5 (at 0 C)838.3855800.197422.8445.7367.1251294.7510.4 17.4 138.5 56.6 114.2 156 10.818.9— 259.2 160 24.9 38.9 olNitrogen64.5 195.81100198.6 97.7 21099.225.3124.8306.3 57.5180.7 218.813.7 187.780.0OctaneOil (light)OxygenPetroleumPropane 183— 42.1Refrigerant-134a 26.1Water100161.6394Freezing data212.7230–384427.8217.02257 96.60.028126—80.3—333.7Liquid propertiesTemperature, CDensityr, kg/m3Specificheatcp, kJ/kg·K 33.3 20025 20 0.5025202020 268.9 252.8 11.72025 161.5 10025 195.8 1602025 18320 42.1050 50 .184.184.194.22* Sublimation temperature. (At pressures below the triple-point pressure of 518 kPa, carbon dioxide exists as a solid or gas. Also, the freezing-point temperatureof carbon dioxide is the triple-point temperature of 56.5 C.)
cen2932x ch18-ap01 p907-956.qxd12/18/0910:05 AMPage 913913APPENDIX 1TABLE A–3Properties of common liquids, solids, and foods (Concluded )(b) Solids (values are for room temperature unless indicated otherwise)Density,r kg/m3SubstanceSpecific heat,cp kJ/kg·KMetalsDensity,r kg/m3SubstanceSpecific heat,cp kJ/kg·KNonmetalsAluminum200 K250 K300 K350 K400 K450 K500 KBronze (76% Cu, 2% Zn,2% Al)Brass, yellow (65% Cu,35% Zn)Copper 173 C 100 C 50 C0 C27 C100 C200 CIronLeadMagnesiumNickelSilverSteel, 970.4008,3100.4002,700AsphaltBrick, commonBrick, fireclay (500 C)ConcreteClayDiamondGlass, windowGlass, pyrexGraphiteGraniteGypsum or plaster boardIce200 K220 K240 K260 K273 KLimestoneMarblePlywood (Douglas Fir)Rubber (soft)Rubber (hard)SandStoneWoods, hard (maple, oak, etc.)Woods, soft (fir, pine, 8001.261.38(c) FoodsSpecific heat,kJ/kg·KFoodApplesBananasBeef roundBroccoliButterCheese, swissCherriesChickenCorn, sweetEggs, wholeIce creamWatercontent,% (mass)8475679016398074747463Latentheat ofFreezing AboveBelowfusion,point, C freezing freezing kJ/kg 1.1 0.8— 0.6— 10.0 1.8 2.8 0.6 0.6 0153130267247247247210Specific heat,kJ/kg·KFoodLettuceMilk, wholeOrangesPotatoesSalmon fishShrimpSpinachStrawberriesTomatoes, ripeTurkeyWatermelonWatercontent,% (mass)9588877864839390946493Freezingpoint, CAbovefreezingBelowfreezingLatentheat offusion,kJ/kg 0.2 0.6 0.8 0.6 2.2 2.2 0.3 0.8 0.5— 261214277311301314214311Source: Values are obtained from various handbooks and other sources or are calculated. Water content and freezing-point data of foods are from ASHRAE,Handbook of Fundamentals, SI version (Atlanta, GA: American Society of Heating, Refrigerating and Air-Conditioning Engineers, Inc., 1993), Chapter 30,Table 1. Freezing point is the temperature at which freezing starts for fruits and vegetables, and the average freezing temperature for other foods.
cen2932x ch18-ap01 p907-956.qxd12/18/0910:05 AMPage 914914PROPERTY TABLES AND CHARTSTABLE A–4Saturated water—Temperature tableSpecific volume,m3/kgTemp.,T CSat.press.,Psat kPa0.0151015202530354045Internal t.Evap., .53188.432304.32290.22276.02261.92247.7
Table A–1 Molar mass, gas constant, and critical-point properties Table A–2 Ideal-gas specific heats of various common gases Table A–3 Properties of common liquids, solids, and foods Table A–4 Saturated water—Temperature table Table A–5 Saturated water—Pressure table Table A–6 Superheated water Table A–7 Compressed liquid water Table A–8 Saturated ice–water vaporFile Size: 1MBPage Count: 50