Transcription
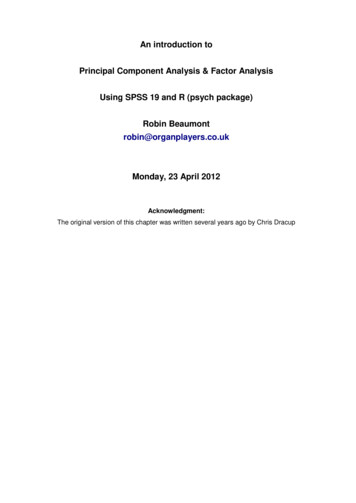
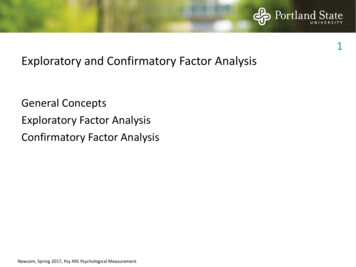
East African Scholars Journal of Economics, Business and ManagementAbbreviated Key Title: East African Scholars J Econ Bus ManagISSN 2617-4464 (Print) ISSN 2617-7269 (Online) Published By East African Scholars Publisher, KenyaVolume-2 Issue-4 April-2019 Research ArticleAnalysis of Internal Factor Evaluation Matrix, External Factor EvaluationMatrix, Threats-Opportunities-Weaknesses-Strengths Matrix, andQuantitative Strategic Planning Matrix on Milk Products and NutritionSegment of Nestlé India11Felicia Juliani Leliga , Janet Devina Koapaha. , Anastasia Cherry Sulu.11Universitas Pelita Harapan Surabaya, Indonesia.*Corresponding AuthorFelicia Juliani LeligaAbstract: A lot of Indians started moving towards healthy lifestyle. Nestle is one of the largest multinational foodcompanies in India. Most of its income comes from Milk Products and Nutrition (MPN) sales. Nestle has to maintain oreven improve the quality of their nutritious products, in order to be able to secure their market share in India. Thepurpose of this study is to determine the strategic alternatives for this segment. Secondary data such as annual reports,news articles, and analysis on trusted websites were used to conduct this study. the data was processed by using IFE,EFE, TOWS, and QSPM matrices. This study aims to identify external and internal indicators affecting MPN salesperformance, to present the strategies that could be implemented based on those indicators, and to determine the prioritystrategy to execute the plan. The result shows that Nestle India should prioritize to apply product development strategyfirst, then related diversification strategy.Keywords: milk products and nutrition, strategic planning, strategic management, IFE, EFE, TOWS, QSPM.1.INTRODUCTIONMore than fifty percent of the globalpopulation lives in Asia, with China and India being themost populated countries in the world, each having 1.4billion and 1.3 billion respectively (www.un.org/en).Nowadays, a lot of people especially millennials startedto shift away from meat, and opt for healthier or morenutritious food. When purchasing foods, they take thefood source, animal welfare, and environmental impactsinto consideration before reaching any decisions(www.forbes.com, 2018). This trend also happens inIndia, where millennials make up sixty five percent ofthe population (www.posist.com). Not only millennials,people in general who live in urban India like Kolkata,Pune, and Delhi reportedly starting to move towardshealthy lifestyle which is shown through their use .com). The Food Safety andStandards Authority of India (FSSAI) alsolaunched ‘Eat Right Movement’ which is supported indiatimes.com).Quick Response CodeNestle is one of multinational food companiesthat operate in India. It was established in 1866 and hascommitment to improving quality of life andcontributing to a healthier future. The headquarter islocated in Switzerland, and is one of the largest foodandbeveragecompaniesintheworld(www.forbes.com, 2018). Nestle has sixteen principalmarkets which are United States, Greater China Region,France, Brazil, United Kingdom, Mexico, Germany,Philippines, Canada, Italy, Japan, Russia, Spain,Australia, India, and Switzerland (www.nestle.com,2018). In India, Nestle has Milk Products and Nutrition(MPN), Prepared Dishes and Cooking Aids (PDCA),Powdered and Liquid Beverages (PLB), andConfectionery as its product groups (www.nestle.in,2018). The PDCA products are sold the most in 2018,but the highest income comes from the MPN productssale (see figure 1). As explained above, customers’demand towards nutritious foods is increasing each day.Therefore, Nestle has to maintain the quality of theirMPN products, considering the threat that comes fromJournal le HistoryReceived: 10.03.2019Accepted: 25.03.2019Published: 09.04.2019Published By East African Scholars Publisher, KenyaCopyright @ 2019: This is an open-accessarticle distributed under the terms of theCreative Commons Attribution license whichpermits unrestricted use, distribution, andreproduction in any medium for noncommercial use (NonCommercial, or CC-BYNC) provided the original author and sourceare credited.186
Felicia Juliani Leliga et al., East African Scholars J Econ Bus Manag; Vol-2, Iss-4 (April, 2019): 186-191local competitor, Anand Milk Union Limited (Amul),which is the biggest dairy cooperative and retail chainin India (https://qz.com).Figure 1. Details of Product Sales (Nestlé India annual report, 2018)Strategic planning is a critical mean to helpcompanies to reach their goals. It is a part and a key tosuccessful strategic management (Gurel, E., & Tat, M.2017). Studer implies that strategic management is a setof managerial decisions and actions that determine thecompany’s performance over the long term (Widiatama,et al., 2018; Studer, S. 2016). Formulating a good set ofstrategies will improve the performance sale, vice versa.Hence, SWOT analysis was conducted to find solutionsto maintain the MPN products sales performance.SWOT Analysis is a tool used for buildingorganizational strategy and competitive strategy (Gurel,E., & Tat, M. 2017). It consists of “Strengths”,“Weaknesses”, “Opportunities”, and “Threats”.Strengths and weaknesses are the internal factors thatcan be found from within the company, andopportunities and threats are the external factors thataffect the company’s performance. After analyzing theSWOT, Internal Factor Evaluation (IFE) matrix,External Factor Evaluation (EFE) matrix, ThreatsOpportunities-Weaknesses-Strengths (TOWS) matrix,and Quantitative Strategic Planning Matrix (QSPM)were conducted to find strategic alternatives for NestleIndia’s MPN segment. The purposes of this study are toidentify external and internal indicators affecting MPNsales performance, to present the strategies that couldbe implemented based on those indicators, and todetermine the priority strategy to execute the plan.2. Literature Review1.1 Internal Factor Evaluation (IFE) and ExternalFactor Evaluation (EFE) MatrixIFE and EFE are part of the input stage ofstrategy-formulation. Making small decisions in theinput matrices regarding the relative importance ofexternal and internal factors allows strategists to moreeffectively generate and evaluate alternative strategies(David, F. R. 2011). According to David (2011), afterlisting all the identified internal and external factorsderived from the SWOT analysis, a weight that rangesfrom 0.0 (not important) to 1.0 (all-important) isassigned to each indicator. The percentage form canalso be used instead of the decimal form. The weight is East African Scholars Publisher, Kenyaused to measure the importance of a given indicator tothe company’s industry. And then, ratings from 1-4should be assigned to represent the value of response,where 1 is major weakness (IFE) or poor response(EFE), 2 is minor weakness (IFE) or average response(EFE), 3 is minor strength (IFE) or above averageresponse (EFE), and 4 is major strength (IFE) orsuperior response (EFE). Afterward, multiply eachindicator’s weight by its rating to determine weightedscores for variables. The weighted scores must besummed to get the total weighted hs(TOWS) MatrixTOWS matrix is a part of the matching stage ofstrategy-formulation. Weihrich states that a lot ofexperts suggest a company to use its strengths to takeadvantage of opportunities, but then they ignore otherimportant relationships, such as the challenges ofovercoming weaknesses to exploit opportunities (Puri,P. 2017). This matrix was first introduced by him in1982 by pairing the external factors (threats andopportunities) with the company’s internal factors(weaknesses and strengths) (Weihrich, H. 1982). Itconsists of four types of strategies which are (David, F.R. 2011): S-O strategies, that use a company’s internalstrengths to take advantage of externalopportunities,W-O strategies, that aim to improve internalweaknesses by taking advantage of externalopportunities,S-T strategies, that use a company’s strengthsto avoid or reduce the impact of externalthreats, andW-T strategies, which are defensive tacticsdirected at reducing internal weakness andavoiding external threats.187
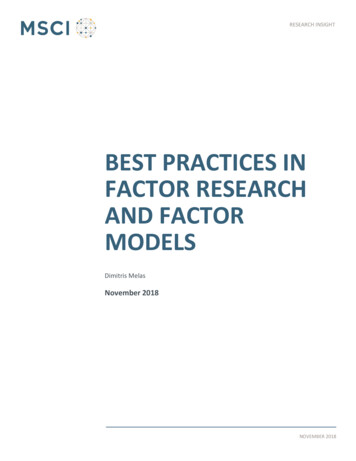
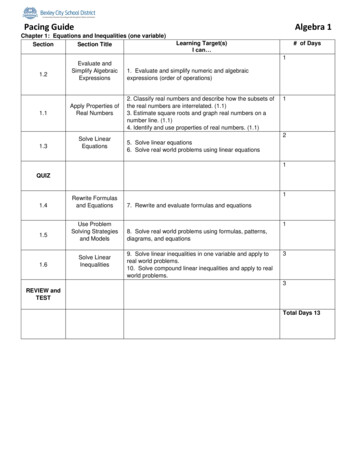
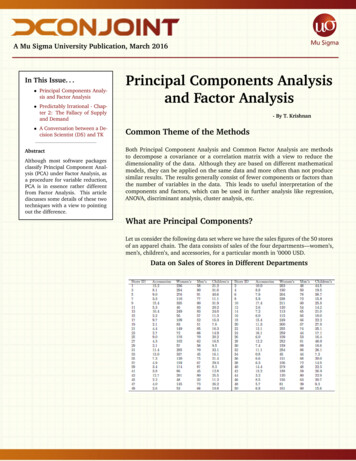
Felicia Juliani Leliga et al., East African Scholars J Econ Bus Manag; Vol-2, Iss-4 (April, 2019): 186-1912.3 Quantitative Strategic Planning Matrix (QSPM)QSPM falls within the final stage of strategyformulation, which is the decision stage. Indicatorsare derived from the previous internal and externalfactors. This is used to determine or rank the bestalternative strategies for the business. According toAbratt and also Dibb (in David, et al.,), QSPMdetermines the relative attractiveness of variousstrategies based on the extent to which thealternative strategies will enable the firm tocapitalize upon strengths and opportunities,improve upon weaknesses, and avoid or mitigateexternal threats (Abratt, R. 1993; Dibb, S. 1995;David, M. E. 2016). It requires subjectivedecisions, where making decisions throughout theprocess increasing the likelihood that the finalstrategy decision for the organization (Zulkarnain,A. 2019). New additional components for s Scores (TAS), and the Sum of TAS.3. RESEARCH METHOD3.1 Research ApproachThe type of data that is used in this study issecondary data, which are annual report, newsarticles, and writings or analysis found on trustedwebsites. Descriptive method was used to presentthe problems with the aim to find proper strategiesfor the company.3.2 Data Analysis TechniquesThis study uses three matrices for data processing,which are IFE and EFE matrices (the input stage),TOWS matrix (the matching stage), and QSPM(the decision stage). Final decision was made byusing QSPM.4.RESEARCH FINDINGSThe result of IFE analysis was obtained through anumber of indicators of strengths and weaknesses.The ratings in this matrix refer to the strong orweak level of each factor. The ratings range from 4to 1, where 4 means a major strength, 3 – minorstrength, 2 – minor weakness and 1 – majorweakness. Strengths can only receive ratings 3 & 4,while weaknesses – 2 & 1.Table1. Internal Factor Evaluation (IFE) MatrixKey 10.10.1StrengthsProduct InnovationBusiness ExpansionStrong Brand Image and Brand ValuePremium and Natural Raw MaterialRecycle-able packaging and Waste Free-ProductNutrition improvementExcellent Financial PerformanceWeaknessesMislabeled Ads and Nutrition Information on baby formulaThe management is slow to provide solutions for customer complaintsThe Stakeholders and Shareholders started to doubt about the integrity and consistency ofinformation of existing productsTotal100%2,96The result of EFE analysis was obtained through a number of indicators of opportunities and threats. The ratings range from 4 to 1, where 4 means asuperior response, 3 – above average response, 2 – average response and 1 – poor response.Table 2. External Factor Evaluation (EFE) MatrixKey FactorsOpportunitiesFast-changing trend among the customers in IndiaCustomers started to think of the importance of healthy food that have proper nutrition in itModern technologyThe existence of eco-friendly movement in India, which is about keeping the environmentsafe and healthy.The vegan community crave for vegan products and caterings in IndiaMillennials are adopting fast, practical, and instant lifestyleThreatsFierce competition with other competitors that have similar products like Nestle IndiaWater Scarcity.Nutrition inspections on products sold by food companies are required in accordance togovernment rules and regulationMost people with lactose intolerance can’t comfortably consume some dairy food, but stillneed calcium in their nutrition.People started realizing that breastfeeding is the best nutrition source for babies.Total East African Scholars Publisher, KenyaWeightRatingsWeighted %10%10%4440.40.40.48%30.2410%100%30.33,82188
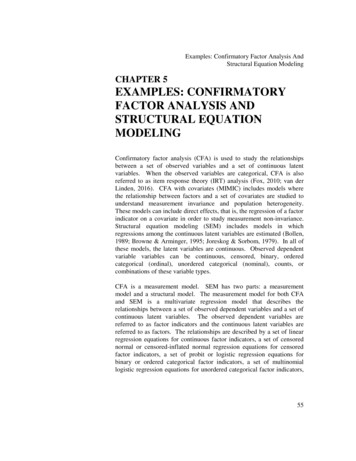
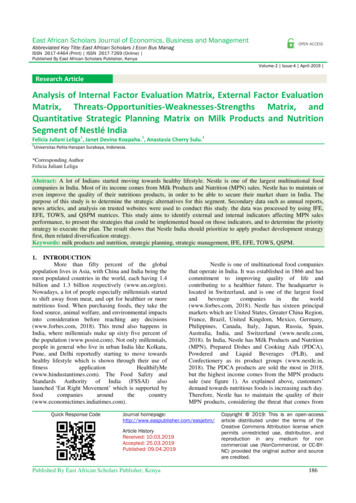
Felicia Juliani Leliga et al., East African Scholars J Econ Bus Manag; Vol-2, Iss-4 (April, 2019): 186-191Table3. TOWS MatrixQSPM (Quantitative Strategic Planning Matrix) is the final method, where the data is derived from IFE, EFE, and TOWS(Threats-Opportunities-Weaknesses-Strengths) Matrix. East African Scholars Publisher, Kenya189
Felicia Juliani Leliga et al., East African Scholars J Econ Bus Manag; Vol-2, Iss-4 (April, 2019): 186-191Table4. QSPM MatrixKey FactorsWeightSTRATEGIC tionASTASASTASFast-changing trend among the customers in IndiaCustomers started to think of the importance of healthy food that have propernutrition in itModern technologyThe existence of eco-friendly movement in India, which is about keeping theenvironment safe and healthy.The vegan community craves for vegan products and caterings in IndiaMillennials are adopting fast, practical, and instant lifestyleThreatsFierce competition with other competitors that have similar products likeNestle IndiaWater scarcityNutrition inspections on products sold by food companies are required inaccordance to government rules and regulationMost people with lactose intolerance can’t comfortably consume some dairyfood, but still need calcium in their nutritionPeople started realizing that breastfeeding is the best nutrition source forbabiesStrengthsProduct innovationBusiness expansionStrong brand image and brand valuePremium and natural raw materialRecycle-able packaging and waste-free productNutrition improvementExcellent financial performanceWeaknessesMislabeled ads and nutrition information on baby formulaThe management is slow to provide solutions for customer complaintsThe stakeholders and shareholders started asking about the integrity andconsistency of existing .21320.10.30.2Opportunities5. DISCUSSION AND CONCLUSIONThe alternative strategies were generated fromIFE, EFE, TOWS, and QSPM Matrix. All of thesematrices helped to determine the right solution for everycase. These alternatives are matched with vision,mission, goals, and objectives of the Nestle India,especially on Milk Products and Nutrition segment.Structured strategic priorities are: (1) ProductDevelopment, (2) Related Diversification.Thecompany is suggested to implement the productdevelopment strategy first, then related diversificationstrategy. These strategies below are suggested for thisbusiness line:1.Product developmentTo keep up with instant and fast-changing ofcustomer lifestyle, and also the threats that come fromcompetitors, Nestle India can implement productinnovation and brand expansion strategies to increasesales performance. Suggestion for this strategy will be East African Scholars Publisher, Kenya7.216.262as follow: (1). the company can combine nutritionproducts with confectionery products by creating asnack bar that contains nutrients. For example, Kit Katwith one of its nutrition products, which is Resource(for individuals that has diabetes). The sugar level inKit Kat also needs to be decreased. Indians in generaland millennials can get their nutrition through snacks.This can dismiss the unhealthy image of Nestle’sconfectionery. (2) To execute this, the company canprovide training and development programs for theemployees. This activity allows the employees tocontribute their ideas about the innovation and also toenrich their skills to do the product development. (3)Nestle is known as one of the market leaders in MilkProducts and Nutrition in India. By having thisadvantage, they don’t have to hesitate to develop andrelease new products to the market because they alreadyhave customers’ trust and loyalty. For example, theycan create a yoghurt product with Indian traditionalrecipe.190
Felicia Juliani Leliga et al., East African Scholars J Econ Bus Manag; Vol-2, Iss-4 (April, 2019): 186-1912.Related DiversificationBy improving the nutrition products,maintaining the quality of premium and natural rawmaterials, and having strong and powerful brand imageand value, Nestle India may add new product line orservices that’s still related to existing products. Moderntechnology can be used for quality improvement andalso like its slogan, “to help the customers to live agood life with Nestle India”. Suggestion for thisstrategy will be as follow: (1) Create a new smartphoneapplication that is able to scan and analyze the level oflactose, protein, and vitamin in customers’ body. Thisapp can help the customers to choose which Nestle’sdairy and nutrition product is the best for their bodies.This program can be named “Ask Nestle Doc” and itwill help the company to collect customer data byconducting surveys through their registered emailregularly. (2) Create a new product line for cerealbreakfast which is focused on local Indian taste. Forexample, it can be named as “Muskurao” which meansSmile in local language. It will be made of Indian spicesor Indian traditional recipe. With this line, the companycan strive to put a smile on customers’ face in themorning by allowing them to have some breakfast withlocal taste. (3) The company can do research and testregularly to combine the taste of traditional recipe withexisting product which is milk and nutrition product.This effort can help Nestle to keep innovating andimproving their products so they can keep up with theircompetitors in India, without eliminating the local taste.6.REFERENCES1. ion/2. 40a4a43. staurant-business.html4. d-the-way/storytoipndZrb5ZBQ9cVqHcclL.html5. s?from mdr15. East African Scholars Publisher, documents/annual e.in/investors/stockandfinancials/documents/annual from-mncs-like-nestle/Gurel, E., & Tat, M. (2017). SWOT Analysis: ATheoretical Review. The Journal of InternationalSocial Research, 10 (5), 1994-1006.Widiatama, Y., Hamid, A. A., & Martono. (2018).Business Environmental Analysis with CompetitiveProfile Matrix Method on Market Optimization inReal Estate Company (A Case Study at TangerangSelatan Area). International Journal of Economicsand Financial Issues, 8 (4), 222-226.Studer, S. (2016). Volunteer management:Responding to the uniqueness of volunteers.Nonprofit and Voluntary Sector Quarterly, 45(4),688-714.David, F. R. (2011). Strategic Management:Concepts and Cases, Prentice Hall: New Jersey13th ed, 80 (122), 177-179.Weihrich, H. (1982). The TOWS Matrix- A Toolfor Situational Analysis. Long Range Planning, 15(2), 54-66.Puri, P. (2017). Tows Analysis for Strategic Choiceof Business Opportunity and Sustainable Growth ofSmall Businesses. Pacific Business ReviewInternational, 10 (5), 144-152.Abratt, R. (1993). Market segmentation practices t, 22, 79–84.Dibb, S. (1995). Developing a decision tool foridentifying operational and attractive segments.Journal of Strategic Marketing, 3, 189–204.David, M. E., David, F. R., & David, F. R. (2016).The quantitative strategic planning matrix: a newmarketing tool. Journal of Strategic Marketing.Zulkarnain, A., Wahyuningtias, D., & Putranto, T.S. (2018). Analysis of IFE, EFE and QSPM matrixon business development strategy. IOP ConferenceSeries: Earth and Environmental Science.191
The management is slow to provide solutions for customer complaints 10% 1 0.1 The Stakeholders and Shareholders started to doubt about the integrity and consistency of information of existing products 10% 1 0.1 Total 100% 2,96 The result of EFE analysis was obtained through a number of indicators of opportunities and threats.