Transcription
Joint CommissionJournal on Quality and SafetyMicrosystems in Health CareMicrosystems inHealth Care:Part 2. Creating a Rich InformationEnvironmentn the first article of this series on microsystemsin health care, we outlined the qualitative research completed and findings on 20 highperforming microsystems from the care continuum.1We stressed the strategic and practical importanceof focusing on the small, functional, frontline unitsthat provide most health care to most people. Thisarticle further advances microsystems knowledgeby demonstrating the importance of creating a richinformation environment that supports microsystemfunctioning.Some microsystems—medical practices and clinicalunits—consistently generate superb clinical care, basedon science, on compassion, and on specific andunique knowledge of what “this patient” wants—and needs—right now. These same microsystemsconsistently use data to review their performance—to monitor, manage, and improve quality, safety, andefficiency. This is exceptional. As an IOM reportshows, it is not the way things work in mostclinical units.2 Most microsystems use data todaythe same way they did decades ago, with little thoughtgiven to planning the flow of information to supportclinical decision making and to optimize total practiceperformance.We present three case examples of clinical microsystems that are using data in everyday practice to provide high-quality, cost-effective care. After providingthese cases, we offer principles for using data inmicrosystems and discuss some useful concepts andframeworks.IJanuary 2003Eugene C. Nelson, DSc, MPHPaul B. Batalden, MDKaren Homa, MSMarjorie M. Godfrey, MS, RNChristine CampbellLinda A. Headrick, MD, MSThomas P. Huber, MSJulie J. Mohr, MSPH, PhDJohn H. Wasson, MDArticle-at-a-GlanceBackground: A rich information environmentsupports the functioning of the small, functional, frontline units—the microsystems—that provide most healthcare to most people. Three settings represent caseexamples of how clinical microsystems use datain everyday practice to provide high-quality andcost-effective care.Cases: At The Spine Center at Dartmouth, Lebanon,New Hampshire, a patient value compass, a one-pagehealth status report, is used to determine if the provided care and services are meeting the patient’s needs. InSummit, New Jersey, Overlook Hospital’s emergencydepartment (ED) uses uses real-time process monitoring on patient care cycle times, quality and productivityindicator tracking, and patient and customer satisfaction tracking. These data streams create an informationpool that is actively used in this ED icrosystem—minuteby minute, hourly, daily, weekly, and annually—toanalyze performance patterns and spot flaws thatrequire action. The Shock Trauma Intensive Care Unit(STRICU), Intermountain Health Care, Salt Lake City,uses a data sytstem to monitor the “wired” patientremotely and share information at any time in real time.Staff can complete shift reports in 10 minutes.Discussion: Information exchange is the interfacethat connects staff to patients and staff to staff withinthe microsystem; microsystem to microsystem; andmicrosystem to macro-organization.Volume 29 Number 15
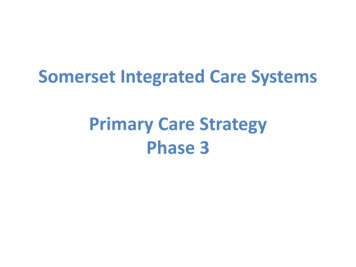
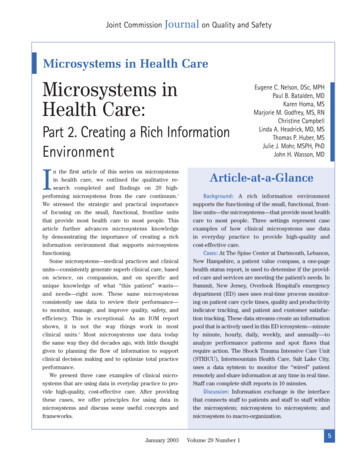
Joint CommissionJournal on Quality and SafetyCase 1. Specialty Care: The SpineCenter at Dartmouth, Lebanon, NewHampshireWe needed a language to work with our patients. Thevalue compass provides the language that helps our multidisciplinary team work with our patients to get themback to work, back to play, one back at a time.—JamesWeinstein, DO, Spine Center Founderrecord current health status and thereby update thechanges in health outcomes such as back pain, physicalfunction, and mental health that he has achieved. After 6months, the patient is back on the job, is free fromdepression, and has pain that is only slightly worse thanthat of the average adult.3Other Facts About the Center The Spine Center uses a data wall to display impor-A Typical Illness Episode: Health OutcomesTracking and MoreA patient comes for his first visit to the Spine Center.He is greeted by the receptionist, given a touch pad computer, and asked to answer a set of important questionsabout his health, using the computer, before seeing thephysician. He takes less than 30 minutes to answer questions about his back problem, functional status, expectations for treatment, and working status. When thepatient finishes, he hands the computer back to thereceptionist. The receptionist transfers the survey datato the reception desk computer, which has a customdesigned database application for processing and printing the patient value compass (PVC) on a one-page summary report (Figure 1, p 7). The PVC is used to enhancecommunication between the provider and patient to better meet the patient’s needs. The PVC is then placed onthe front of the medical record, and the patient sees thephysician for an initial assessment, during which theyreview the PVC, which describes the patient’s health status in areas such as bodily pain, physical health, mentalhealth, and role performance compared to the averageperson of their age and sex.This patient’s PVC shows not only that he is sufferingfrom acute back pain but also that he has an extremesleeping problem, is possibly suffering from depression,has been unable to work at his job for 3 weeks becauseof his back problem, and has had chronic back pain formore than 3 years. The patient and physician discussthese results, and after gathering additional data throughhistory taking and physical examination, they develop acare plan based on the patient’s preferences and healthneeds that blends behavioral medicine, physical therapy,and occupational therapy.On each subsequent visit to the Spine Center duringthe next 2 months, the patient uses the touch pad to6January 2003tant indicators of clinical outcomes, patient satisfaction,and business performance. (A data wall displays keymeasures for use by the clinical team to show currentperformance and trends over time.) The various data displays create a “story” about practice performance thatcan be viewed by the entire practice staff. The practice views statistical process control chartsand measures of processes and outcomes as essentialkeys to practice management and improvement. The Spine Center creates an outcomes-based annualreport and uses it as the basis for an all-staff annualretreat to review improvements made and to set up smallteams to work on needed improvements for the comingyear. The Spine Center contributes data to the NationalSpine Network, which is composed of 28 independentclinics that share outcomes data, enabling cross-sitecomparisons. The Spine Center is the lead organization for a 15 million, 11-site, NIH-sponsored, randomized clinical trial onthe value of spine surgery for the three most commondiagnoses for which spine surgery is performed. Many patients are delighted with the care theyreceive, but the Spine Center has important improvements to make, especially with respect to improvingaccess to care.Case 2. Overlook Hospital EmergencyDepartment, Summit, New JerseyWe have a culture of change right here that goes backmany years to our first work with the reduction ofthrombolytic cycle time. The ED moved to understanding how to use industrial quality improvement methodsand microsystems thinking to be safer, more reliable,and better able to meet customer needs and expectations.—James Espinosa, MD, Medical DirectorVolume 29 Number 1
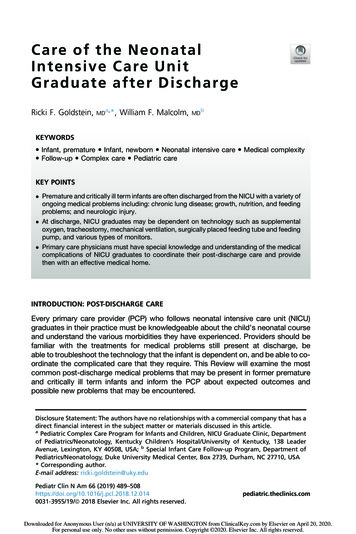
Joint CommissionJournal on Quality and SafetyPatient Value Compass for a Typical Spine PatientFigure 1. The patient value compass provides a balanced view of clinical and functional status, patient expectations,and satisfaction with his or her clinical care management, and other data on the patient related to work status andcosts of care.A Glimpse at the Uses of Data: Real-Time FlowMonitoring and MoreThe Overlook Hospital emergency department (ED) hasmade data a critical part of its continuous improvementefforts, which began in 1994. The following are a few examples of how the ED uses data to create a rich, self-awareJanuary 2003information environment that supports improved flow,quality, productivity, and patient and staff satisfaction: Real-time process monitoring: Real-time dataon patient care cycle times are monitored and displayed continuously on software to show if the systemis flowing well or is experiencing bottlenecks.Volume 29 Number 17
Joint CommissionJournal on Quality and SafetyMeasures that are tracked in real time include time toinitial treatment, time to transfer to an inpatient unit,x-ray time, and cycle time for fast-track and routinepatients. Quality and productivity indicator tracking: A systemof process and outcome metrics is compiled and displayed using control charts and other graphical displays.Process indicators monitor trends in many areas, such asx-ray false-negative report rates, patient fall rates, andother indicators of growth and safety. Patient and customer satisfaction tracking: TheOverlook ED uses several formats to gain knowledgeof its customers. It uses a national comparativedatabase on patient satisfaction, in which it frequentlyscores at the 99th percentile, as well as locally developedcustomer satisfaction surveys for key internal customers(for example, residents in training, ED staff) and for“peer” microsystems (for example, pediatric intensivecare unit, radiology, and emergency medical technician[EMT] squads).These “data streams” create an information poolthat is actively used in this ED microsystem—minuteby minute, hourly, daily, weekly, and annually—toanalyze performance patterns and to spot flawsthat require action. Two regularly scheduled forums inwhich the staff use the data for continual betterment are(a) the dynamic monthly “Microsystem” meetings,chaired by Dr Espinosa, which are freewheelingexchanges of data, dialogue, and ideas, and (b) full-dayannual retreats called “summits,” which look back toreview progress and problems and establish prioritiesand plans.Other Facts About the Overlook ED 80% of the ideas that have surfaced during the annu-al summits in the past several years have beenimplemented. The ED has the highest staff satisfaction rating of anyclinical unit in the four-hospital system. The ED has been recognized nationally—for example,HCFA’s (Centers for Medicare & Medicaid Services)Best-Practice for Time-to-Thrombolytics, the CardiologyAdvisory Board’s North American Gold Standard forThrombolytic Delivery, and the American HospitalAssociation’s Quality Award.8January 2003Case 3. Shock Trauma Intensive CareUnit (STRICU), Intermountain HealthCare (IHC), Salt Lake CityThe data system allows us to monitor the patient remotely and share information at any time in real time. I get tosee and use data and information to help me take bettercare of the patient.—a STRICU clinicianDaily Work—The Wired Patient and Real-TimeMonitoringThe data system is built around the patient and theclinical care team and is used every minute of every daywith every patient. The injured patient is “wired” to monitor vital clinical parameters, such as vital signs,intake/output, blood gases, and infusions, in real time.Each patient room has a bedside computer for enteringall relevant information into the patient’s electronic medical record (EMR). Every day starts with formal, interdisciplinary rounds that take 2 or more hours to review andplan the care for the 8 to 12 patients in the unit at any onetime. During rounds the patient’s clinical team—intensivist, nurse, technician, medical resident, primary physician, respiratory therapist, social worker, andfamily—reviews all aspects of the patient’s status, withthe assistance of the EMR projected on a large screen.On the basis of the data and discussion of alternatives, the patient’s team adjusts the care plan and tracksthe impact of the changes on the patient’s clinical parameters. Despite the complexity of the patients’ conditions,the informatics environment makes it possible for staffto complete shift reports in 10 minutes. Physicians candial in to the information system from home to monitorthe patient remotely at any time of the day or night andcan communicate with everyone on the care team anytime and from any place. Current data, based on the localepidemiological profile, are available on the mostcommon types of nosocomial infections, and decisionsupport is built in to the informatics system to guide thecost-effective selection of medications for patients whoacquire infections.Time-trended statistics are a way of life in theSTRICU. Trends over time on key performance indicators, such as medication error rates, protocol use rates,complication rates, and costs, are compiled and reviewedat monthly staff meetings by the unit’s coordinatingVolume 29 Number 1
Joint CommissionJournal on Quality and SafetyTable 1. Tips and Nuggets to Foster a RichInformation EnvironmentSpine Center Specialty Practice Use full assessment of patient’s health status tomatch treatment plan to the patient’s changingneeds. Integrate data collection and information technology into the flow of patient care delivery. Use information technology to provide patients andstaff with tailored health status. Use outcomes tracking over time to evaluate resultsof care for individual patients and for specific subpopulations of patients. Build a clinical research infrastructure on top of arich clinical information environment that makesuse of structured data collection from patients andstaff.Use leadership, cultural patterns, and systems tomake a firm foundation for technology.Overlook Emergency Department Improve patient flow by monitoring cycle times andvisibly key results in real time to promptly initiateneeded actions. Use comparative data to stimulate improvements inclinical processes and in patient satisfaction.Shock Trauma Intensive Care Unit Use biomedical monitoring—for patients withcomplex, critical problems—to provide ongoinginformation on the patient’s status. Use graphical and visual data displays to connectstaff to staff and staff to patients to develop optimal care plans. Build local epidemiological knowledge and use it toguide clinical decision making.council and at annual all-staff retreats to monitor, manage, and improve performance.Other Facts About the STRICU Protocols, which address topics such as heparinuse, prevention of deep vein thrombosis, and pain relief,are developed and refined locally (by any member of theclinical team); each is typically less than one page long. Inflation-adjusted costs have been reduced over timeand are currently at 82% of their 1991 levels.January 2003 Safety is a primary concern; more than 30 differenttypes of errors are tracked. Current improvement projects involve potassium targetlevels, nosocomial infections, and sedation level reduction.The EMR has been under development at IHC fordecades, and the STRICU has a full-time staff memberdevoted to ongoing EMR/informatics refinements.Tips and “Nuggets” to Foster a RichInformation EnvironmentThe three cases reviewed give rise to a set of tipsthat may be useful to guide microsystems and macroorganizations in their quests to provide great care (thatis, care that meets patients’ needs) and to minimizedelays and unnecessary costs. Some of the obvious tipsor informatics “gold nuggets” embedded in these casesare listed in Table 1 (left).Basics: Fundamental Principles forCreating a Useful InformationEnvironmentIn addition to the specific tips and nuggets, it is possible toidentify a few main principles concerning information,information technology, data, and performance results. Theprinciples (Table 2, p 10) come from a detailed qualitativeanalysis of the 20 high-performing clinical microsystems.1DiscussionInformation is the Connector of All to AllAccording to Figure 2 (p 11), information and informationtechnology are a feeder system to support all four key success themes—leadership, staff, patients, and performance.Information exchange is the interface that connects Staff to patients and staff to staff within the microsystem; Microsystem to microsystem; and Microsystem to macro-organization,Information technology facilitates effective communication. Multiple formal and informal channels are usedto maintain accurate, honest, and timely dialogue amongall parties.Smallest Replicable Units (SRUs) of Activity and theDesign of Information FlowA rich information environment does not just happen,but it can be designed and improved over time. It can beVolume 29 Number 19
Joint CommissionJournal on Quality and SafetyTable 2. Fundamental Principles for Creating a Useful Information Environment1. Design it. Provide access to a rich information environment.This is the first principle among all principles. Information guides intelligent action. Lack of information precludes theability to take intelligent action. Processes that support Principle 1 are: Designing the information environment to support and inform daily work and to promote core competencies andcore processes that are essential for care delivery. Establishing multiple formal and informal communication channels to keep all the microsystem players—patients,families, staff—informed in a timely way.2. Connect with it. Use information to connect patients to staff and staff to staff.The success of the microsystem (composed of patients in relationship to clinical staff and support staff) is contingenton the interactions between the players (patients and staff). The players must be connected for positive and productive interactions to take place and for the right things to be done in the right way at the right time. Processes thatcontribute to Principle 2 are: Giving everyone the right information at the right time to do the work.Investing in software, hardware, and expert staff to take full advantage of information technology to support medical care delivery.Hearing everyone’s ideas and connecting them to benefit the patient and actions that support servicing the patient.Providing multiple channels for patients to interact with the microsystem and to receive information from themicrosystem (for example, written information, telephone, e-mail, Web-based information, group visits).3. Measure it. Develop performance goals and linked measures that reflect the primary values and the corecompetencies essential for providing needed services to patients.To improve performance or to maintain performance in the desired range of excellence, it is important to set goalsthat are aligned with critical values, competencies, and processes and to measure goal attainment over time.Processes that promote Principle 3 are: Working with the microsystem team to set goals and linking rewards and incentives to measured results. Using measures to gauge performance, ideally in real time, in both “upstream” processes and “downstream”outcomes.4. Use it for betterment. Measure processes and outcomes, feed back data, and redesign continuously based onthe data.This last overarching principle completes the loop. It emphasizes using the information being gathered to provideinsight to all the players, to instigate actions to improve or innovate, and to use the information streams to determinethe impact of design changes. Processes that promote Principle 4 are: Building data collection into the daily work of clinical staff and support staff. Creating and using “self-coding” forms and checklists as part of work flow. Turning the primary customer—the patient—into an information source for providing critical data elements in astandard or systematic manner. Designing work processes and supporting technology to automatically “throw off,” or generate, important resultsthat show how the system is working and the pattern of results that it is generating.engineered in order to support the organization’s ability todeliver high-quality services to patients (and customers) atthe level of the SRUs of activity within mi
ical record (EMR). Every day starts with formal, interdis-ciplinary rounds that take 2 or more hours to review and plan the care for the 8 to 12 patients in the unit at any one time. During rounds the patient’s clinical team—inten-sivist, nurse, technician, medical resident, prim