Transcription
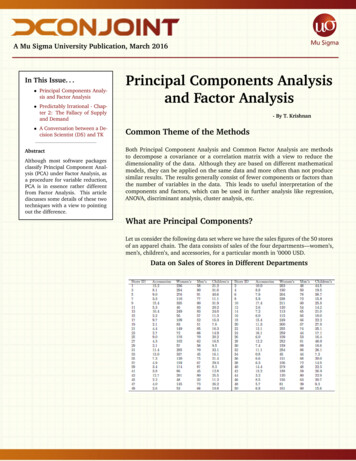
A Mu Sigma University Publication, March 2016In This Issue. . . Principal Components Analysis and Factor Analysis Predictably Irrational - Chapter 2: The Fallacy of Supplyand Demand A Conversation between a Decision Scientist (DS) and TKAbstractAlthough most software packagesclassify Principal Component Analysis (PCA) under Factor Analysis, asa procedure for variable reduction,PCA is in essence rather differentfrom Factor Analysis. This articlediscusses some details of these twotechniques with a view to pointingout the difference.Principal Components Analysisand Factor Analysis- By T. KrishnanCommon Theme of the MethodsBoth Principal Component Analysis and Common Factor Analysis are methodsto decompose a covariance or a correlation matrix with a view to reduce thedimensionality of the data. Although they are based on different mathematicalmodels, they can be applied on the same data and more often than not producesimilar results. The results generally consist of fewer components or factors thanthe number of variables in the data. This leads to useful interpretation of thecomponents and factors, which can be used in further analysis like regression,ANOVA, discriminant analysis, cluster analysis, etc.What are Principal Components?Let us consider the following data set where we have the sales figures of the 50 storesof an apparel chain. The data consists of sales of the four departments—women’s,men’s, children’s, and accessories, for a particular month in ’0000 USD.Data on Sales of Stores in Different Departments
A Mu Sigma University Publication, March 2016The covariance and correlation matrices of the four variables are as follows:In This Issue. . . Principal Components Analysis and Factor Analysis Predictably Irrational - Chapter 2: The Fallacy of Supplyand Demand A Conversation between a Decision Scientist (DS) and TKThe issue dealt with by principal components is a representation of the four dimensions (variables) in terms of a smaller number (one or more) of dimensions withoutlosing much information. The notion of information used in this context is thevariation among the observational units of the four variables. The four dimensionstogether have a variance of 7261.384 (sum of the diagonal elements of the covariance matrix given above). Can a large part of this total variance be captured byone or more combinations of the four dimensions? Let us simplify this question byasking for only linear combinations of the four dimensions represented by a generalform:Y1 1 Accessories 2 W omen1 s 3 M en1 s 4 Children1 sIf we ask for only one combination, the question reduces to asking for 1 , 2 , 3 , 4such that Y1 has the largest variance among all choices of 1 , 2 , 3 , 4 . But thisquestion is ill formulated; for, if we find one such Y1 , then cY1 for c ¡ 1 will havec2 V arpY1 ) and so this variance can be made infinite. But then Y1 and cY1 representthe same variable in different units. Thus a meaningful formulation of the problemcan be to constrain the 1 , 2 , 3 , 4 in a way. One such way is to make them relative,that is by saying 1 2 3 4 1, in which case the above ill-posed nature ofthe problem will disappear. Another way is to make 21 22 23 24 1. Let uscall such a linear combination a normalized one. Although both constraints arereasonable, the latter leads to mathematically and computationally elegant andconvenient solutions.In our example, the normalized linear combination with the largest variance is0.0412Accessories0.995W omen1 s0.0463M en1 s0.075Children1 swith a variance of 7010.734. This is called the first principal component of thecovariance matrix. It captures a proportion of 0.9655 of the total variance of7261.384. This component is heavily weighted towards the Women’s clothingvariable, the reason being that Women’s clothing has a large variance relative to theother variables. We shall discuss this issue of whether we should consider differentvariables with largely different variances for this analysis in a later section.In situations where the first principal component does not capture an adequateamount of the overall variance, we might want another component. This componentshould ideally not contain information (variance) contained in the first component.A statistical way of formulating this idea is to ask for another component which isuncorrelated with the first one and among such has the largest variance. This iscalled the second principal component. If there are p dimesnions in the originaldata, we can thus extract p components with decreasing variance, each uncorrelated
A Mu Sigma University Publication, March 2016In This Issue. . . Principal Components Analysis and Factor Analysis Predictably Irrational - Chapter 2: The Fallacy of Supplyand Demand A Conversation between a Decision Scientist (DS) and TKwith all the earlier ones. These then will have a total variance the same as that ofthe original variables; the components will then be just a transformed version of theoriginal variables. A useful situation is one where the few first components explaina large amount of the total variance.The mathematical solution to this problem is the computation of eigenvalues andeigenvectors of the covariance or the correlation matrix. These eigenvalues will allbe non-negative (0 will be an eigenvalue if and only if the matrix is singular). If theeigenvalues are arranged in decreasing order then they represent the variancesof the first, second, . components and the corresponding eigenvectors give thecoefficients of the linear combinations representing the corresponding principalcomponents.In the example the second, third, and the fourth components are: 0.0448Accessories 0.0588W omen s 0.9769M en s0.07989Accessories 0.0676W omen s 0.2005M en s 0.9949Accessories 0.0389W omen s 0.0582M en s1111110.2007Children1 s0.9741Children1 s0.0723Children1 swith variances 202.01, 42.12, and 6.17 respectively of the total 7261.38 withproportions 0.0278, 0.0058, and 0.00085 respectively.The first component has positive signs for all the variables and so can be interpretedas an overall sales level, whereas the other components are differences of variouskinds.Covariance or CorrelationThe correlation matrix is the covariance matrix of standardized variables. Thus allthe variances are 1 as you notice in the correlation matrix above. If your variablesare measured on very different scales, you may want to work with correlationsrather than covariances. In that case the variances of the four components are:2.480, 0.990, 0.357, and 0.173respectively adding upto 4. The proportions explained are:0.620, 0.247, 0.089, 0.043respectively. The components are given byComponent 1: 0.536Accessories 0.583Women’s 0.278Men’s 0.543Children’sComponent 2: 0.418Accessories 0.188Women’s 0.873Men’s 0.167Chilkdren’sComponent 3: 341Accessories 0.268Women’s 0.378Men’s 0.818Children’sComponent 4: 0.649Accessories 0.743Women’s 0.134Men’s 0.000Children’s An explanation for the coefficients (loadings) is that each coefficient is the correlation between the component and the variable concerned. As before, the firstcomponent is a kind of sales level being a weighted average of the four sales figures.The other components are differences of various kinds. The first component explainsonly about 62% of variance and the first two together about 87%.
A Mu Sigma University Publication, March 2016In This Issue. . . Principal Components Analysis and Factor AnalysisFor each case (store) in the data, scores based on each of the principal componentscan be computed. Since the first two components capture a great proportion ofthe data, a plot of the first two component scores for each case can be plotted as ascatter plot. This can sometimes help in finding clusters in the data. Predictably Irrational - Chapter 2: The Fallacy of Supplyand Demand A Conversation between a Decision Scientist (DS) and TKFactor AnalysisWe have seen how principal component analysis is a procedure for computingnew variables that summarize variation in reduced space parsimoniously. The firstprincipal component of the correlation matrix was0.536Accessories 0.583Women’s 0.278Men’s 0.543Children’sThis equation is of the form:Component Linear combination of observed variablesFactor analysis turns this equation around:Observed variable Linear combination of Factors ErrorIn mathematical terms the factor model can be written asy Λxzwhere y is a p-vector of observed variables, x is a k-vector (kp) of latent(unobserved) variables, z is a p-vector of the so-called unique scores, Λ is a p k matrix of factor loadings. It is assumed that E pxq E py q 0, E pxxT q regressionΦ, E pzz T q Ψ, a diagonal matrix. Although this looks like a linearmodel, it is not such a model since there are no unique observable or of factorscores or residuals to examine.Factor analysts are less interested in prediction than in decomposing a covarianceor a correlation matrix. Hence the fundamental equation of factor analysis is not interms of the linear model stated above, but its quadratic form as:Observed covariances Factor covariances Error Covariances
A Mu Sigma University Publication, March 2016The mathematical version of this is:Σ ΛΦΛTIn This Issue. . . Principal Components Analysis and Factor Analysis Predictably Irrational - Chapter 2: The Fallacy of Supplyand Demand A Conversation between a Decision Scientist (DS) and TKΨwhere Σ is the p p covariance matrix, Φ is a k k matrix of factor correlations andΨ is a p p matrix of unique/error variances. The diagonal elements of matrices Φand Ψ are hypothetical ones arrived at by the analysis and are known respectivelyas communalities and specificities. Thus factor analysis expresses variation withinand relations among the observed variables partly as common variation amongfactors and partly as specific variation among random errors.From the correlation or covariance matrix, factor loadings are estimated. Thisis called initial factor extraction. There are many methods for doing this, likegeneralized least squares and maximum likelihood.The initial factors or the principal components do not necessarily give interpretablefactors or components. Factors or components are rotated in order to make theminterpretable. This is achieved by making the large loadings larger and the smallerones smaller so that each variable is associated with a small number of factors orcomponents. It is hoped that variables that load strongly with a given factor orcomponent will have a clear meaning in the context of the data.Generally, the initial factor analysis called Exploratory Factor Analysis is followedwith Confirmatory Factor Analysis to confirm the hypothesized factor structure andto validate it by computing goodness-of-fit measures.In the stores sales example, only one factor could be extracted since the numberof parameters to be estimated will be too high for more than one factor. Thefactor scores are 0.818, 0.979, 0.262, 0.683 which are correlations of the fourdepartmental sales with the latent factor extracted. This shows that the factor is anoverall weighted summary of the four sales figures.Principal Components versus Factor AnalysisOne of the main differences between principal components and factors is thatfactors are indeterminate or latent whereas principal components are explicit.Unlike principal components, there are no natural factor scores for observationalunits. The reason is that in factor analysis there are more indeterminable parametersthan observations. Interpretations have to be done, as done above, by consideringfactor weights as correlations of factors with the variables.References Frank Walkey and Garry Welch (2010): Demystifying Factor Analysis:: How ItWorks and How To Use It. Xlibris, corp. Marjorie A. Pett, Nancy R. Lackey, and John J. Sullivan (2003): Making Senseof Factor Analysis: The Use of Factor Analysis for Instrument Development inHealth Care Research. Sage Publications.
Predictably Irrational - Chap-ter 2: The Fallacy of Supply and Demand A Conversation between a De-cision Scientist (DS) and TK Abstract Although most software packages classify Principal Component Anal-ysis (PCA) under Factor Analysis, as a procedure for variable reduction, PCA is in essence rather different from Factor Analysis. This article