Transcription
Matplotlibi
MatplotlibAbout the TutorialMatplotlib is one of the most popular Python packages used for data visualization. It is across-platform library for making 2D plots from data in arrays. It provides an objectoriented API that helps in embedding plots in applications using Python GUI toolkits suchas PyQt, WxPythonotTkinter. It can be used in Python and IPython shells, Jupyter notebookand web application servers also.AudienceThis tutorial is designed for those learners who wish to acquire knowledge on the basicsof data visualization.PrerequisitesMatplotlib is written in Python and makes use of NumPy, the numerical mathematicsextension of Python. We assume that the readers of this tutorial have basic knowledge ofPython.Copyright & Disclaimer Copyright 2016 by Tutorials Point (I) Pvt. Ltd.All the content and graphics published in this e-book are the property of Tutorials Point (I)Pvt. Ltd. The user of this e-book is prohibited to reuse, retain, copy, distribute or republishany contents or a part of contents of this e-book in any manner without written consentof the publisher.We strive to update the contents of our website and tutorials as timely and as precisely aspossible, however, the contents may contain inaccuracies or errors. Tutorials Point (I) Pvt.Ltd. provides no guarantee regarding the accuracy, timeliness or completeness of ourwebsite or its contents including this tutorial. If you discover any errors on our website orin this tutorial, please notify us at contact@tutorialspoint.comi
MatplotlibTable of ContentsAbout the Tutorial . iAudience . iPrerequisites . iCopyright & Disclaimer . iTable of Contents . ii1.Matplotlib – Introduction . 12.Matplotlib – Environment Setup . 23.Matplotlib – Anaconda distribution . 44.Matplotlib – Jupyter Notebook . 55.Matplotlib – Pyplot API . 96.Matplotlib – Simple Plot . 127.Matplotlib – PyLab module . 16Basic Plotting . 168.Matplotlib – Object-oriented Interface . 19Matplotlib – Figure Class. 229.Matplotlib – Figure Class10. Matplotlib – Axes Class . 2311. Matplotlib – Multiplots . 2712. Matplotlib – Subplots() Function. 3113. Matplotlib – Subplot2grid() function. 3314. Matplotlib – Grids . 35Matplotlib – Formatting Axes. 3615. Matplotlib – Formatting Axes16. Matplotlib – Setting Limits . 3917. Matplotlib – Setting Ticks and Tick Labels . 4118. Matplotlib – Twin Axes . 43ii
Matplotlib19. Matplotlib – Bar Plot . 4420. Matplotlib – Histogram . 4821. Matplotlib – Pie Chart . 5022. Matplotlib – Scatter Plot . 5223. Matplotlib – Contour Plot . 5424. Matplotlib – Quiver Plot . 5625. Matplotlib – Box Plot . 5826. Matplotlib – Violin Plot . 6027. Matplotlib – Three-dimensional Plotting . 6228. Matplotlib – 3D Contour Plot . 6529. Matplotlib – 3D Wireframe plot . 6730. Matplotlib – 3D Surface plot . 6931. Matplotlib – Working With Text . 7132. Matplotlib – Mathematical Expressions . 7333. Matplotlib – Working with Images . 7534. Matplotlib – Transforms . 77iii
1. Matplotlib – IntroductionMatplotlibMatplotlib is one of the most popular Python packages used for data visualization. It is across-platform library for making 2D plots from data in arrays. Matplotlib is written inPython and makes use of NumPy, the numerical mathematics extension of Python. Itprovides an object-oriented API that helps in embedding plots in applications using PythonGUI toolkits such as PyQt, WxPythonotTkinter. It can be used in Python and IPython shells,Jupyter notebook and web application servers also.Matplotlib has a procedural interface named the Pylab, which is designed to resembleMATLAB, a proprietary programming language developed by MathWorks. Matplotlib alongwith NumPy can be considered as the open source equivalent of MATLAB.Matplotlib was originally written by John D. Hunter in 2003. The current stable version is2.2.0 released in January 2018.1
2. Matplotlib – Environment SetupMatplotlibMatplotlib and its dependency packages are available in the form of wheel packages onthe standard Python package repositories and can be installed on Windows, Linux as wellas MacOS systems using the pip package manager.pip3 install matplotlibIncase Python 2.7 or 3.4 versions are not installed for all users, the Microsoft Visual C 2008 (64 bit or 32 bit forPython 2.7) or Microsoft Visual C 2010 (64 bit or 32 bit forPython 3.4) redistributable packages need to be installed.If you are using Python 2.7 on a Mac, execute the following command:xcode-select –installUpon execution of the above command, the subprocess32 - a dependency, may becompiled.On extremely old versions of Linux and Python 2.7, you may need to install the masterversion of subprocess32.Matplotlib requires a large number of dependencies: Python ( 2.7 or 3.4) NumPy setuptools dateutil pyparsing libpng pytz FreeType cycler sixOptionally, you can also install a number of packages to enable better user interfacetoolkits. tk PyQt4 PyQt5 pygtk2
Matplotlib wxpython pycairo TornadoFor better support of animation output format and image file formats, LaTeX, etc., you caninstall the following: mpeg/avconv ImageMagick Pillow ( 2.0) LaTeX and GhostScript (for rendering text with LaTeX).3
3. Matplotlib – Anaconda distributionMatplotlibAnaconda is a free and open source distribution of the Python and R programminglanguages for large-scale data processing, predictive analytics, and scientific computing.The distribution makes package management and deployment simple and easy. Matplotliband lots of other useful (data) science tools form part of the distribution. Package versionsare managed by the package management system Conda. The advantage of Anaconda isthat you have access to over 720 packages that can easily be installed withAnaconda's Conda, a package, dependency, and environment tionathttps://www.anaconda.com/download/. For installation on Windows, 32 and 64 bitbinaries are /archive/Anaconda3-5.1.0-Windows-x86 64.exeInstallation is a fairly straightforward wizard based process. You can choose betweenadding Anaconda in PATH variable and registering Anaconda as your default Python.For installation on Linux, download installers for 32 bit and 64 bit installers from thedownloads /Anaconda3-5.1.0-Linux-x86 64.shNow, run the following command from the Linux terminal: bash Anaconda3-5.0.1-Linux-x86 64.shCanopy and ActiveState are the most sought after choices for Windows, macOS andcommon Linux platforms. The Windows users can find an option in WinPython.4
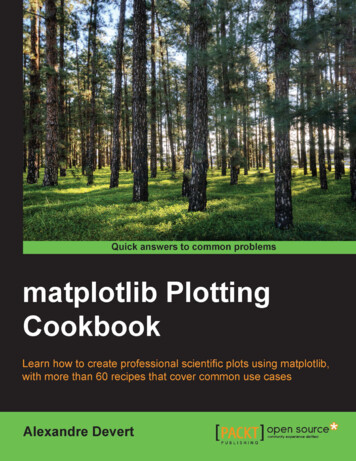
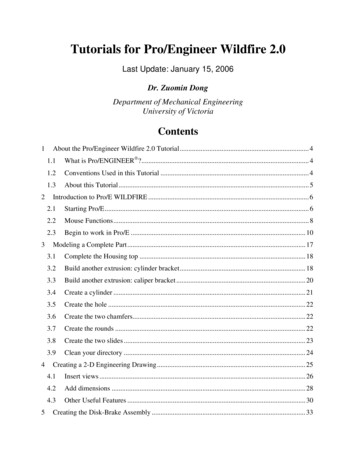
4. Matplotlib – Jupyter NotebookMatplotlibJupyter is a loose acronym meaning Julia, Python, and R. These programming languageswere the first target languages of the Jupyter application, but nowadays, the notebooktechnology also supports many other languages.In 2001, Fernando Pérez started developing Ipython. IPython is a command shell forinteractive computing in multiple programming languages, originally developed for thePython.Consider the following features provided by IPython: Interactive shells (terminal and Qt-based). A browser-based notebook with support for code, text, mathematical expressions,inline plots and other media. Support for interactive data visualization and use of GUI toolkits. Flexible, embeddable interpreters to load into one's own projects.In 2014, Fernando Pérez announced a spin-off project from IPython called Project Jupyter.IPython will continue to exist as a Python shell and a kernel for Jupyter, while the notebookand other language-agnostic parts of IPython will move under the Jupyter name. Jupyteradded support for Julia, R, Haskell and Ruby.To start the Jupyter notebook, open Anaconda navigator (a desktop graphical userinterface included in Anaconda that allows you to launch applications and easily manageConda packages, environments and channels without the need to use command linecommands).5
MatplotlibNavigator displays the installed components in the distribution.6
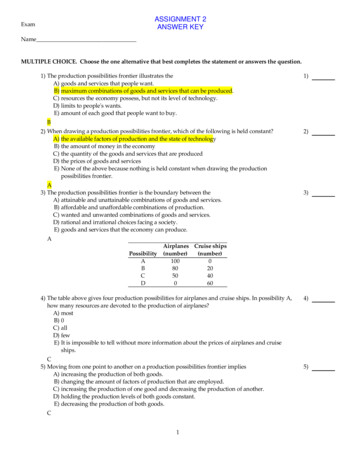
MatplotlibLaunch Jupyter Notebook from the Navigator:You will see the applicationaddress: ollowing7
MatplotlibYou probably want to start by making a new notebook. You can easily do this by clickingon the "New button" in the "Files tab". You see that you have the option to make a regulartext file, a folder, and a terminal. Lastly, you will also see the option to make a Python 3notebook.8
5. Matplotlib – Pyplot APIMatplotlibA new untitled notebook with the .ipynb extension (stands for the IPython notebook) isdisplayed in the new tab of the browser.matplotlib.pyplot is a collection of command style functions that make Matplotlib worklike MATLAB. Each Pyplot function makes some change to a figure. For example, a functioncreates a figure, a plotting area in a figure, plots some lines in a plotting area, decoratesthe plot with labels, etc.Types of PlotsFunctionDescription9
MatplotlibBarMake a bar plot.BarhMake a horizontal bar plot.BoxplotMake a box and whisker plot.HistPlot a histogram.hist2dMake a 2D histogram plot.PiePlot a pie chart.PlotPlot lines and/or markers to the Axes.PolarMake a polar plot.ScatterMake a scatter plot of x vs y.StackplotDraws a stacked area plot.StemCreate a stem plot.StepMake a step plot.QuiverPlot a 2-D field of arrows.Image FunctionsFunctionDescriptionImreadRead an image from a file into an array.ImsaveSave an array as in image file.ImshowDisplay an image on the axes.10
MatplotlibAxis FunctionsFunctionDescriptionAxesAdd axes to the figure.TextAdd text to the axes.TitleSet a title of the current axes.XlabelSet the x axis label of the current axis.XlimGet or set the x limits of the current axes.XscaleSet the scaling of the x-axis.XticksGet or set the x-limits of the current tick locations and labels.YlabelSet the y axis label of the current axis.YlimGet or set the y-limits of the current axes.YscaleSet the scaling of the y-axis.YticksGet or set the y-limits of the current tick locations and labels.Figure FunctionsFunctionDescriptionFigtextAdd text to figure.FigureCreates a new figure.ShowDisplay a figure.SavefigSave the current figure.CloseClose a figure window.11
6. Matplotlib – Simple PlotMatplotlibIn this chapter, we will learn how to create a simple plot with Matplotlib.We shall now display a simple line plot of angle in radians vs. its sine value in Matplotlib.To begin with, the Pyplot module from Matplotlib package is imported, with an alias plt asa matter of convention.import matplotlib.pyplot as pltNext we need an array of numbers to plot. Various array functions are defined in theNumPy library which is imported with the np alias.import numpy as npWe now obtain the ndarray object of angles between 0 and 2π using the arange() functionfrom the NumPy library.x np.arange(0, math.pi*2, 0.05)The ndarray object serves as values on x axis of the graph. The corresponding sine valuesof angles in x to be displayed on y axis are obtained by the following statement:y np.sin(x)The values from two arrays are plotted using the plot() function.plt.plot(x,y)You can set the plot title, and labels for x and y e('sine wave')The Plot viewer window is invoked by the show() function:plt.show()12
MatplotlibThe complete program is as follows:from matplotlib import pyplot as pltimport numpy as npimport math #needed for definition of pix np.arange(0, math.pi*2, 0.05)y l("sine")plt.title('sine wave')plt.show()When the above line of code is executed, the following graph is displayed:Now, use the Jupyter notebook with Matplotlib.Launch the Jupyter notebook from Anaconda navigator or command line as describedearlier. In the input cell, enter import statements for Pyplot and NumPy:from matplotlib import pyplot as pltimport numpy as np13
MatplotlibTo display plot outputs inside the notebook itself (and not in the separate viewer), enterthe following magic statement:%matplotlib inlineObtain x as the ndarray object containing angles in radians between 0 to 2π, and y as sinevalue of each angle:import mathx np.arange(0, math.pi*2, 0.05)y np.sin(x)Set labels for x and y axes as well as the plot le('sine wave')Finally execute the plot() function to generate the sine wave display in the notebook (noneed to run the show() function):plt.plot(x,y)14
MatplotlibAfter the execution of the final line of code, the following output is displayed:15
7. Matplotlib – PyLab moduleMatplotlibPyLab is a procedural interface to the Matplotlib object-oriented plotting library. Matplotlibis the whole package; matplotlib.pyplot is a module in Matplotlib; and PyLab is a modulethat gets installed alongside Matplotlib.PyLab is a convenience module that bulk imports matplotlib.pyplot (for plotting) andNumPy (for Mathematics and working with arrays) in a single name space. Although manyexamples use PyLab, it is no longer recommended.Basic PlottingPlotting curves is done with the plot command. It takes a pair of same-length arrays (orsequences):from numpy import *from pylab import *x linspace(-3, 3, 30)y x**2plot(x, y)show()The above line of code generates the following output:16
MatplotlibTo plot symbols rather than lines, provide an additional string argument.symbolscolors- , –, -., , . , , , o , , v , , , s , , x , D , d , 1 , 2 , 3 , 4 , h , H , p , ,b, g, r, c, m, y, k, wNow, consider executing the following code:from pylab import *x linspace(-3, 3, 30)y x**2plot(x, y, 'r.')show()It plots the red dots as shown below:Plots can be overlaid. Just use the multiple plot commands. Use clf() to clear the plot.from pylab import *plot(x, sin(x))plot(x, cos(x), 'r-')plot(x, -sin(x), 'g--')show()17
MatplotlibThe above line of code generates the following output:18
8. Matplotlib – Object-oriented InterfaceMatplotlibWhile it is easy to quickly generate plots with the matplotlib.pyplot module, the use ofobject-oriented approach is recommended as it gives more control and customization ofyour plots. Most of the functions are also available in the matplotlib.axes.Axes class.The main idea behind using the more formal object-oriented method is to create figureobjects and then just call methods or attributes off of that object. This approach helpsbetter in dealing with a canvas that has multiple plots on it.In object-oriented interface, Pyplot is used only for a few functions such as figure creation,and the user explicitly creates and keeps track of the figure and axes objects. At this level,the user uses Pyplot to create figures, and through those figures, one or more axes objectscan be created. These axes objects are then used for most plotting actions.To begin with, we create a figure instance which provides an empty canvas.fig plt.figure()Now add axes to figure. The add axes() method requires a list object of 4 elementscorresponding to left, bottom, width and height of the figure. Each number must bebetween 0 and 1:ax fig.add axes([0,0,1,1])Set labels for x and y axis as well as title:ax.set title("sine wave")ax.set xlabel('angle')ax.set ylabel('sine')Invoke the plot() method of the axes object.ax.plot(x,y)If you are using Jupyter notebook, the %matplotlib inline directive has to be issued; theotherwistshow() function of pyplot module displays the plot.Consider executing the following code:from matplotlib import pyplot as pltimport numpy as npimport mathx np.arange(0, math.pi*2, 0.05)19
Matplotliby np.sin(x)fig plt.figure()ax fig.add axes([0,0,1,1])ax.plot(x,y)ax.set title("sine wave")ax.set xlabel('angle')ax.set ylabel('sine')plt.show()OutputThe above line of code generates the following output:20
MatplotlibThe same code when run in Jupyter notebook shows the output as shown below:21
9. Matplotlib – Figure ClassMatplotlibThe matplotlib.figure module contains the Figure class. It is a top-level container for allplot elements. The Figure object is instantiated by calling the figure() function from thepyplot module:fig plt.figure()The following table shows the additional parameters:Figsize(width,height) tuple in inchesDpiDots per inchesFacecolorFigure patch facecolorEdgecolorFigure patch edge colorLinewidthEdge line width22
10. Matplotlib – Axes ClassMatplotlibAxes object is the region of the image with the data space. A given figure can containmany Axes, but a given Axes object can only be in one Figure. The Axes contains two (orthree in the case of 3D) Axis objects. The Axes class and its member functions are theprimary entry point to working with the OO interface.Axes object is added to figure by calling the add axes() method. It returns the axes objectand adds an axes at position rect [left, bottom, width, height] where all quantities are infractions of figure width and height.ParameterFollowing is the parameter for the Axes class: rect: A 4-length sequence of [left, bottom, width, height] quantities.ax fig.add axes([0,0,1,1])The following member functions of axes class add different elements to plot:LegendThe legend() method of axes class adds a legend to the plot figure. It takes threeparameters:ax.legend(handles, labels, loc)Where labels is a sequence of strings and handles a sequence of Line2D or Patch instances.loc can be a string or an integer specifying the legend location.Location stringLocation codeBest0upper right1upper left2lower left3lower right4Right5center left6Center right7lower center823
Matplotlibupper center9Center10axes.plot()This is the basic method of axes class that plots values of one array versus another aslines or markers. The plot() method can have an optional format string argument to specifycolor, style and size of line and marker.Color ck‘w’WhiteMarker codesCharacterDescription‘.’Point marker‘o’Circle marker‘x’X marker‘D’Diamond marker‘H’Hexagon marker‘s’Square marker‘ ’Plus markerLine stylesCharacterDescription‘-‘Solid line24
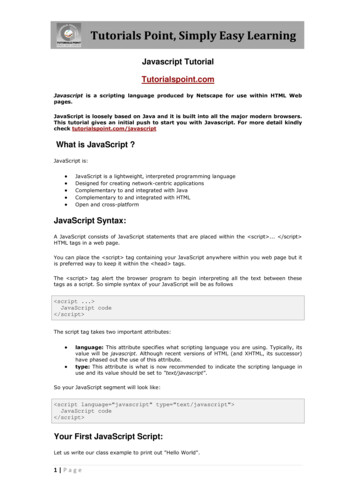
Matplotlib‘—‘Dashed line‘-.’Dash-dot line‘:’Dotted lineFollowing example shows the advertisement expenses and sales figures of TV andsmartphone in the form of line plots. Line representing TV is a solid line with yellow colourand square markers whereas smartphone line is a dashed line with green colour and circlemarker.import matplotlib.pyplot as plty [1, 4, 9, 16, 25,36,49, 64]x1 [1, 16, 30, 42,55, 68, 77,88]x2 [1,6,12,18,28, 40, 52, 65]fig plt.figure()ax fig.add axes([0,0,1,1])l1 ax.plot(x1,y,'ys-') # solid line with yellow colour and square markerl2 ax.plot(x2,y,'go--') # dash line with green colour and circle markerax.legend(labels ('tv', 'Smartphone'), loc 'lower right') # legend placed atlower rightax.set title("Advertisement effect on sales")ax.set xlabel('medium')ax.set ylabel('sales')plt.show()25
MatplotlibWhen the above line of code is executed, it produces the following plot:26
11. Matplotlib – MultiplotsMatplotlibIn this chapter, we will learn how to create multiple subplots on same canvas.The subplot() function returns the axes object at a given grid position. The Call signatureof this function is:plt.subplot(subplot(nrows, ncols, index)In the current figure, the function creates and returns an Axes object, at position index ofa grid of nrows by ncolsaxes. Indexes go from 1 to nrows * ncols, incrementing in rowmajor order.Ifnrows, ncols and index are all less than 10. The indexes can also be givenas single, concatenated, threedigitnumber.For example, subplot(2, 3, 3) and subplot(233) both create an Axes at the top right cornerof the current figure, occupying half of the figure height and a third of the figure width.Creating a subplot will delete any pre-existing subplot that overlaps with it beyond sharinga boundary.import matplotlib.pyplot as plt# plot a line, implicitly creating a subplot(111)plt.plot([1,2,3])# now create a subplot which represents the top plot of a grid with 2 rows and1 column.#Since this subplot will overlap the first, the plot (and its axes) previouslycreated, will be lot(212, facecolor 'y') # creates 2nd subplot with yellow backgroundplt.plot(range(12))27
MatplotlibThe above line of code generates the following output:28
MatplotlibThe add subplot() function of the figure class will not overwrite the existing plot:import matplotlib.pyplot as pltfig plt.figure()ax1 fig.add subplot(111)ax1.plot([1,2,3])ax2 fig.add subplot(221, facecolor 'y')ax2.plot([1,2,3])When the above line of code is executed, it generates the following output:29
MatplotlibYou can add an insert plot in the same figure by adding another axes object in the samefigure canvas.import matplotlib.pyplot as pltimport numpy as npimport mathx np.arange(0, math.pi*2, 0.05)fig plt.figure()axes1 fig.add axes([0.1, 0.1, 0.8, 0.8]) # main axesaxes2 fig.add axes([0.55, 0.55, 0.3, 0.3]) # inset axesy np.sin(x)axes1.plot(x, y, 'b')axes2.plot(x,np.cos(x),'r')axes1.set title('sine')axes2.set title("cosine")plt.show()Upon execution of the above line of code, the following output is generated:30
12. Matplotlib – Subplots() FunctionMatplotlibMatplotlib’spyplot API has a convenience function called subplots() which acts as a utilitywrapper and helps in creating common layouts of subplots, including the enclosing figureobject, in a single call.Plt.subplots(nrows, ncols)The two integer arguments to this function specify the number of rows and columns of thesubplot grid. The function returns a figure object and a tuple containing axes objects equalto nrows*ncols. Each axes object is accessible by its index. Here we create a subplot of 2rows by 2 columns and display 4 different plots in each subplot.import matplotlib.pyplot as pltfig,a plt.subplots(2,2)import numpy as npx np.arange(1,5)a[0][0].plot(x,x*x)a[0][0].set et title('square root')a[1][0].plot(x,np.exp(x))a[1][0].set title('exp')a[1][1].plot(x,np.log10(x))a[1][1].set title('log')plt.show()31
MatplotlibThe above line of code generates the following output:32
13. Matplotlib – Subplot2grid() functionMatplotlibThis function gives more flexibility in creating an axes object at a specific location of thegrid. It also allows the axes object to be spanned across multiple rows or columns.Plt.subplot2grid(shape, location, rowspan, colspan)In the following example, a 3X3 grid of the figure object is filled with axes objects ofvarying sizes in row and column spans, each showing a different plot.import matplotlib.pyplot as plta1 plt.subplot2grid((3,3),(0,0),colspan 2)a2 plt.subplot2grid((3,3),(0,2), rowspan 3)a3 plt.subplot2grid((3,3),(1,0),rowspan 2, colspan 2)import numpy as npx np.arange(1,10)a2.plot(x, x*x)a2.set title('square')a1.plot(x, np.exp(x))a1.set title('exp')a3.plot(x, np.log(x))a3.set title('log')plt.tight layout()plt.show()33
MatplotlibUpon execution of the above line code, the following output is generated:34
14. Matplotlib – GridsMatplotlibThe grid() function of axes object sets visibility of grid inside the figure to on or off. Youcan also display major / minor (or both) ticks of the grid. Additionally color, linestyle andlinewidth properties can be set in the grid() function.import matplotlib.pyplot as pltimport numpy as npfig, axes plt.subplots(1,3, figsize (12,4))x np.arange(1,11)axes[0].plot(x, x**3, 'g',lw 2)axes[0].grid(True)axes[0].set title('default grid')axes[1].plot(x, np.exp(x), 'r')axes[1].grid(color 'b', ls '-.', lw 0.25)axes[1].set title('custom grid')axes[2].plot(x,x)axes[2].set title('no grid')fig.tight layout()plt.show()35
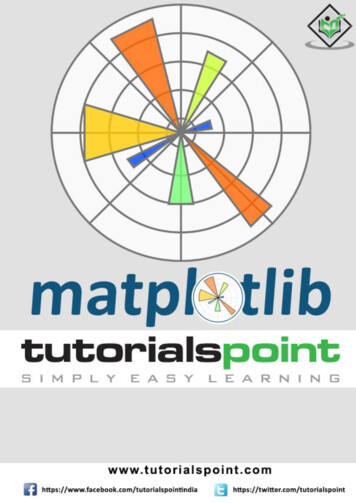
15. Matplotlib – Formatting AxesMatplotlibSometimes, one or a few points are much larger than the bulk of data. In such a case, thescale of an axis needs to be set as logarithmic rather than the normal scale. This is theLogarithmic scale. In Matplotlib, it is possible by setting xscale or vscale property of axesobject to ‘log’.It is also required sometimes to show some additional distance between axis numbers andaxis label. The labelpad property of either axis (x or y or both) can be set to the desiredvalue.Both the above features are demonstrated with the help of the following example. Thesubplot on the right has a logarithmic scale and one on left has its x axis having label atmore distance.import matplotlib.pyplot as pltimport numpy as npfig, axes plt.subplots(1, 2, figsize (10,4))x np.arange(1,5)axes[0].plot( x, np.exp(x))axes[0].plot(x,x**2)axes[0].set title("Normal scale")axes[1].plot (x, np.exp(x))axes[1].plot(x, x**2)axes[1].set yscale("log")axes[1].set title("Logarithmic scale (y)")axes[0].set xlabel("x axis")axes[0].set ylabel("y axis")axes[0].xaxis.labelpad 10axes[1].set xlabel("x axis")axes[1].set ylabel("y axis")plt.show()36
MatplotlibAxis spines are the lines connecting axis tick marks demarcating boundaries of plot area.The axes object has spines located at top, bottom, left and right.37
MatplotlibEach spine can be f
Matplotlib is one of the most popular Python packages used for data visualization. It is a cross-platform library for making 2D plots from data in arrays. Matplotlib is written in Python and makes use of NumPy, the numerical mathematics extension of Python. It provides an object-oriented API that helps in embedding plots in applications using .