Transcription
Excel 2016Charts and Graphstraining@health.ufl.edu
Excel 2016: Charts and Graphs2.0 hoursThis workshop assumes prior experience with Excel, Basics I recommended. Topicsinclude data groupings; creating and modifying charts; chart types; source data; chartoptions; chart locations; formatting; adding trend lines and error bars.Charts. 1Creating a Chart . 2Chart Tools. 3Chart Tool Tabs . 4Format Pane . 6How do I ? . 7Change Axis Numbers . 7Change Distance Between Columns . 7Explode a Pie Chart . 7Add Trendlines and Error Bars . 7Make Charts the Same Size . 7Changing the Data Source . 8From the Worksheet . 8From the Select Data Source Window . 8Removing data . 8Types of Charts . 9Column and Bar Charts . 9Line and Area Charts . 10Pie and Donut Charts . 12Hierarchy Chart . 13Statistic Charts . 13Scatter (X,Y) and Bubble Charts . 14Radar and Surface Charts . 15Class Exercise . 16Pandora Rose CowartEducation/Training SpecialistUF Health IT TrainingC3-013 CommunicorePO Box 100152Gainesville, FL 32610-0152(352) .eduUpdated: 2/15/2019
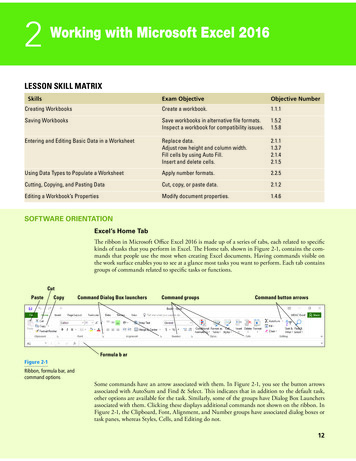
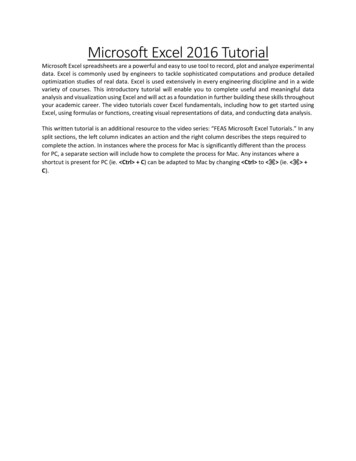
ChartsA chart helps you display your data into a graphical representation. There are many types of charts, but in thisclass we'll focus on simple column, line, and pie charts. There are examples of other charts near the end of thishandouts.The first thing to know is the data has to be organized so Excel can understand what you are trying to chart.Excel will chart your data selection or your connected data range. As long as there are no blank columns and noblank rows within your dataset, you can skip selecting the cells.Chart TitleValue AxisCategory AxisLegendHere is a dataset we will use in class:ItemPantsShoesSocksBlousesHats1st Qtr4564981285791262nd Qtr489435168498129This is a structured collection of related data set in a tableformat. When plotted onto a clustered column chart, like theone shown above, the titles in the first column of the datasetappear along our category axis. The titles in the first rowappear within the legend. The values are represented by theheight of each column.Line charts are usually set up to go across a period of time,think Time Line. For this chart I've used the Switch RowColumn tool so we can see the trend of the sales through theyear. In this case our first column titles appear in the legend,and the first row of titles appears in our category axis.Pie charts are usually created to display the breakdown ofthe total values within the whole. Pie charts can only bebased on one set of data. When you try to create one withthe above dataset, you will only see the first value set appearwithin the chart. If you want to go to an extreme and have allfour quarters show, try using a Doughnut chart.Page 13rd Qtr4234721575311234th Qtr468436138589119
Creating a ChartTo create a chart make sure your cursor is in the dataset you would like to plot. If you want a subset of thedataset, select that portion. You can use your Ctrl key to add to a current selection.You will find the Charts group on the Insert tab. Click on any small chart button to see a list of possible charts.If you are unsure of the best chart option for your data use the Recommend Charts button. It will open theInsert Chart window shown here.Page 2
Chart ToolsWhen you select a chart, three buttons appear along the right side of the selection.The plus sign is the Add Chart Element button. This option is used to add andremove different pieces of your chart. The list of options will vary depending onthe type of chart. For example, a pie chart will not have a set of category axistitles. As you hover your mouse over each option, you will see a small arrow headpointing to the right. This will open another menu with more detailed choices.Each menu also has a "More Options " button which will open a Format Pane onto customize each chart element.There is a Chart Style Gallery and a Colors menu on theDesign tab, but the Chart Styles button, the paint brushnext to the chart, offers the same options.If you are patient while you hover over each option, Excelwill provide you with a Live Preview of the result.The Color options are available at the top of the menu.The third button is a funnel. This is a Chart Filters button.The Values group allows you to add and remove datapoints from the chart.The Names page allows you to change the labels thatappear in the legend (series) and axis titles (category).The Select Data option at the bottom of the windowopens the same window as the Select Data button on theDesign tab. From there you can change or adjust therange of cells used to create this chart.Page 3
Chart Tool TabsWhen a chart is selected two chart tool tabs appear at the end of the ribbon, Design and Format.Design Tab123456781. Add Chart Element – A menu of chart elements that can be added or removed to the chart. Each optionwill have a expand arrow at the end of the element name that will provide specifics and a More Optionsbutton to open the Format Pane. This is the same as the Add Chart Element button that appears next tothe selected chart.2. Quick Layout – A variety of layouts that offer suggested views and choices that adjust the chartelements such as adding a title, varying the space between columns, and moving the legend.3. Change Colors – Different color that can be applied to your chart. Changing the Theme on the PageLayout tab will give you a different sets of colors.4. Chart Style Gallery – Different chart styles that can be applied to your chart. Because Excelautomatically adjusts the Ribbon to fit on your screen, your copy of Excel may show less options thanthe picture above. Use the scroll arrows and open menu buttons at the right side of the gallery for more.5. Switch Row/Column – Changes the direction the chart looks atthe data. In our column chart, each column is plotted on thechart, when we Switch each row is plotted. We are swappingthe category labels with the legend labels.6. Select Data – Opens a Select Data Source windowwhere you can customize the source of the chartdata, even edit the labels. Use this window toreorder your legend and change how Line charts dealwith blank cell values.7. Change Chart Type – Opens Insert Chart windowwhere you can change to other chart types. If youhave multiple series you can change each to bedifferent chart type by choosing the Combo charttype from the bottom of the left pane.8. Move Chart – By default when you create a chart it isplaced on the same worksheet as your data set. You canmove the chart to its own worksheet or to any existingworksheet with the workbook.Page 4ItemPantsShoesSocksBlousesHats1st Qtr4564981285791262nd Qtr4894351684981293rd Qtr4234721575311234th Qtr468436138589119
Format Tab1. Current Selectiona. Chart Elements – This box shows the currently selected Chart Element, and the menu provides alist of the major chart elements. Choose an item from this list to select that element.b. Format Selection – Opens the Format Pane based on the current selection shown in the ChartElements box.c. Reset to Match Style – Changes the current selection to match the original style of the chart.2. Insert Shapea. Shape Gallery – Use this gallery to find a shape such as a block arrow to addto your chart.b. Change Shape – Use this tool to change the current shape to a different one,perhaps a rectangle into a rounded rectangle.3. Shape Stylesa. Style Gallery – Different shape styles, options will vary based onthe current selection.b. Shape Fill – Menu of the most common fill colors and options,such as pictures and textures. For more options, open theFormat Pane.c. Shape Outline – Menu of the most common outline colors andoptions, such as dashes and arrows. For more options open theFormat Pane.d. Shape Effects – Menu of the most common shape effects, suchas shadows. For more options open the Format Pane.4. WordArt Stylesa. WordArt Gallery – Different WordArt stylesb. Text Fill – Menu of the most common fill colors and options,such as pictures and textures.c. Text Outline – Menu of the most common outline colors andoptions, such as dashes and line weight.d. Text Effects – Menu of the most common Text effects, such asshadows. For more options open the Format Pane.5. Arrange – Change the alignment and arrangement of multiple charts. Use the Shift key to select morethan one chart at a time.6. Size – Change the height and width of the chart.Page 5
Format PaneThere are multiple ways to open the Format Pane. Click on the Format Selection button in the Format tabClick on More option from any menuRight-click on a chart element and choose Format Double-click on a chart elementThe format pane can remain open for as long as you need it. The properties shown change depending on thecurrent selection. The current selection is shown on the Format tab and in the title of the Format Pane.The pane can be pulled free from the side by dragging the title toward the middle of the window. To return thepane to the side of the window drag it back into place or double-click the title of the Format Pane.To close the pane, click on the X in the upper right hand corner. If you accidentally close the pane, use anymethod above to reopen it.Within the Format Pane, click on each icon to see the subset of properties. Click on the expand arrow in front ofthe options to see the relevant properties.Fill & LineEffectsSize & PropertiesOptionsText Fill & OutlineText EffectsText Box OptionsThe Fill & Line and Effects options are the same for all the of the chart elements. If an option cannot be appliedto that chart element, Excel will disable (grey out) that option.Below are the fill options for a Chart Element. Each Fill choice provides a new set of options.Page 6
How do I ?Change Axis NumbersSelect the Axis by clicking on a number in the area. Open the Format pane, be sure the title says Format Axis.Click on the Options button.From here you can: Change the Minimum and Maximum numbers shown. These can be greater than the minimum and lessthan the maximum if you want. Change the Major unit, this is how the displayed number is chosen. If the major unit is 100 the chart axiswill read 100, 200, 300. If it's 25 the chart will show 25, 50, 75. Change the Display Units to Thousands, Millions, Billions. This will change the unit shown in the labelsand data tables as well. Change the Format of the numbers; number of decimals, include a dollar sign, etc.Change Distance Between ColumnsSelect any column. Open the Format pane, be sure the title says Format Data Series.Click on the Options button.From here you can: Change the selected series to be on a secondary axis Change the distance the series overlap Change the width between the each category groupingExplode a Pie ChartIn the chart: Hover over a pie wedge. Click and drag the piece away from the center. To move one piece at atime, select the single pie wedge first, and then move it from the middle.In the properties: Select a pie wedge. Open the Format pane, be sure the title says Format Data Series.Click on the Options button.From here you can: Change the rotation without changing the order of the data Change the explosion, how close the wedges are to each otherAdd Trendlines and Error BarsSelect the chart. Click on the Add Chart Element button in the Design tab, or on thebutton next to the chart.You can add your own custom error bars, if needed, from the error bar options. You do have to format oneseries of error bars at a time.Make Charts the Same SizeUse the Height and Width properties found on the Format tab in the ribbon, or on the Format Pane for the ChartArea's Size & Options. You can use the alignment options on the format tab to make the charts line up.Page 7
Changing the Data SourceFrom the WorksheetWhen you select a chart, you will see the Chart Tooltabs in the ribbon, and the three options buttons alongthe right side of the chart. If you can see the cells inthe worksheet used for the chart, you will also be ableto see the data is selected and each section is shaded.If you hover your mouse over the bottom right-handcorner of the data grouping you will get the two-waysizing arrow. If you click and drag the selection, youcan manually change the chart data source.If you know, you will have more categories and seriesyou can grow the data area beyond what's showingand Excel will assign new colors and make room in thechart for the new values.From the Select Data Source WindowFrom the Chart Tools Design tab, choose Select Data.The Chart data range option can be a bit finicky so Irecommend deleting the current range and selectingthe new set from the worksheet.The chart is initially arranged to follow the order of thedata, but if you would like the legend in a different order,you can rearrange the Legend Entries using the up anddown arrows.Removing dataBoth of the above options will help you add and remove data. You can manually adjust the range in theworksheet or you can select a different range from the Select Data Source window. Both are great as long as youare using a consecutive range of data.The Select Data Source window also had a Remove button to delete a series fromthe chart. Notice there is not one for the Category/Axis labels. To be able to removeone you will need to first Switch Row/Column. Once you have removed thecategories, Switch Row/Column again.From the chart itself, you can click on the series you want to remove and pressDelete on the keyboard. You can only delete the series, so the same actions apply inorder to remove a category you will need to switch the row/columns first.However, we now have a Filters button along the side of the selected chart. Fromhere, we can uncheck any of the values we do not want on the chart; Series andCategories. You must click the Apply button at the bottom of the menu for the filterto take effect.Page 8
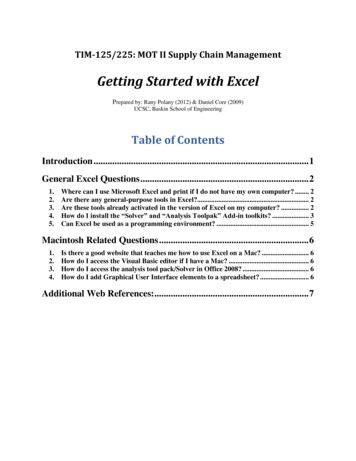
Types of ChartsColumn and Bar ChartsPage 9
Line and Area ChartsPage 10
Page 11
Pie and Donut ChartsPage 12
Hierarchy ChartStatistic ChartsPage 13
Scatter (X,Y) and Bubble ChartsPage 14
Radar and Surface ChartsPage 15
Class ExerciseExplore workbook-Open ChartData.xlsx-View each worksheet-Discuss 'consistent' range of dataROW TITLEROW TITLECOLUMN TITLEDATADATACOLUMN TITLEDATADATACreate Chart-Turn to Sheet 'Sales by Quarter'-Turn to the Insert Tab-Click on Recommended ChartsoClick on each suggestion to see a preview of our datasetoClick on the ALL CHARTS page at the top of the window and explore the optionsoChoose first Column Chart-Chart Tool tabs – Design and Format-Click outside of chart to deselectoTabs disappearDesign Tab--Add Chart ElementoAdd: Data Labels on the Outside EndoRemove: Chart TitleoMove: Legend to the topExplore different Quick LayoutsoChoose first layout (title above, legend on right)-Explore different Chart Colors-Explore different Chart Styles---oNotice it changes the Chart LayoutoReturn to the Quick Layout menu and choose the first one againSwitch Row/ColumnoNotice it's switching the legend with the category axisoLeave the chart with quarter in the legendSelect DataoRearrange legend 4th Qtr - 1st QtroCancel the windowChange Chart Type to different optionso-Reset it back to the original, first column chartMove chart to its own sheetPage 16
Format Tab – Current Selection-Select Plot Area from Current Selection dropdown-Click Format Selection buttonoFill o-Border Solid line Increase width GradientSelect Legendoo-Solid FillGradient Fill Preset ColorsPicture or Texture Fill Textures Insert a fileLegend Options Move legend to different positions Try it with overlapping the chartEffects Add a Shadow Add a GlowIn the Format tab in the ribbon, click Reset to Match StyleLayout Tab – Insert--Insert ShapesoInsert Block ArrowoUses yellow diamond to modify arrowoUse green circle to rotateoDeleteInsert Text BoxoType insideoMove aroundoDeleteDelete Chart-Right-click on Chart 1 Sheet name-Select Delete-Confirm deletionPage 17
Create Chart-Turn to Sheet 'Sales by Year-Insert Tab, Chart Group, ColumnoChoose first Column Chart-Move to a new worksheet-Change Font-oRight-click on Category Axis (pants, shoes )oChoose Font, sent size to 14oUndooRight-click in Chart Area (blank space)oChoose Font, sent size to 14Change Title to read "Yearly SalesFormat Tab - Styles-Select Major Gridlines-Change Shape StylesoUse Preset optionsoUse Shape OutlineoUse Shape Effects-Select a column-Change Shape Styles--oUse Preset optionsoUse Shape FilloUse Shape OutlineoUse Shape EffectsFormatoFill, Outline, and Effects for each column, independentlyoFill for Plot AreaoFill for Chart AreaFormat Chart TitleoChange font size to 40oSee Shape Styles, don't change itoSee WordArt Styles Text Fill Text Outline Text EffectsPage 18
Default Chart-In Sheet 'Sales by year' Press F11Manually Changing Data Ranges-Insert a column chart on Sheet 'Sales by Quarter'-Notice color Coding around original data-Use fill handle to change the selectionoIf the colors go away, click inside the chart again.oAdjust the chart to include only the dataFilter Data-Insert a column chart-Use the Filter to remove second and fourth quarter, and remove your shoes-Use the Filter to add them back inRemove Data-Click on a column for 4th Quartero-Press Delete on the keyboardClick on a column for 2th QuarteroPress Delete on the keyboard-Notice the color grouping around our dataset is gone-Switch row/columns to remove shoes-Switch row/columns back-Open the filters button. There is only the first and third quarter, and no shoes-Delete ChartChart Specific Data-Select Items through 3rd Quarter, A1:D6-Insert a column chart-Delete 2th Quarter-Delete Chart-Select Items through 1st Quarter, A1:B6-Use Ctrl key to select 3rd Quarter, D1:D6-Insert a Column chart-Delete ChartPage 19
Pie Chart-Turn to Sheet 'Sales by Year-Insert Tab, Chart Group, Pie, First chart-Remove Title & Legend-Add labels for %, Delete labels-Explode Pie-Rotate Pie (in the options)-Pull individual pieces-Delete Chart3-D Column Chart-In Sheet 'Sales by Quarter'-Insert Tab, Chart Group, Column, Last 3-D option-Delete Legend-Design tab - Switch Row/Columns-Design tab – Select Datao-Rearrange Legend so smaller values are in the frontDelete ChartLine Chart-In Sheet 'Sales by Quarter'-Insert Tab, Chart Group, Line, First option-Design tab - Switch Row/Columns-Remove Smaller Values-Move to new sheet-Format Axis OptionsoMinimum 400oMaximum 600oMajor Unit 25Layout Tab - Analysis-Trend Line-Error Bars-oMore Error Bar OptionsoFixed Value 5Delete ChartPage 20
Feb 15, 2019 · Excel 2016 Charts and Graphs training@health.ufl.edu . Updated: 2/15/2019 Excel 2016: Charts and Graphs 2.0 hours . The first thing to know is the data has to be organized so Excel can understand what you are trying to chart. Excel will chart your data selection or your connected