Transcription
United States Universities Council on Geotechnical Education and ResearchSpecial Project Grant 2015Final Summary Reportgeotech: Development of aGeotechnical EngineeringSoftware Package in RJames Kaklamanos, Ph.D.Assistant ProfessorDepartment of Civil EngineeringMerrimack College315 Turnpike Street, North Andover, MA 01845Tel: 978-837-3401 Fax: 978-837-5029Email: KaklamanosJ@merrimack.eduProject Start Date: 1 October 2014Project End Date: 30 September 2015Submitted to:USUCGER Board of DirectorsFebruary 2016
AbstractThis report describes the result of the first special project grant awarded through theUnited States Universities Council on Geotechnical Education and Research (USUCGER). Inthis project, undertaken by Prof. Jim Kaklamanos at Merrimack College and his student KyleElmy, we developed a geotechnical engineering software package within the statistical languageand environment R (Kaklamanos and Elmy, 2016a). The software package, aptly named geotech,has the capability to perform a range of geotechnical engineering computations, and is freelyavailable for use in the geotechnical engineering field. In geotechnical engineering education,research, and practice, there is a range of technology available for performing engineeringcalculations, and this software package represents one additional option in the engineer’stoolbox.ii
Table of ContentsAbstract . iiTable of Contents . iii1Introduction .12Project Overview .22.1Task 1: Identify and outline the geotechnical engineering calculations to beincluded .322.2Task 2: Program and validate the geotechnical engineering functions in R . 32.3Task 3: Compose the help documentation and distribute the package .3Results .33.1The geotech R package .33.1.1Availability and installation .43.1.2Initialization and documentation .53.1.3Functions .53.2Example sessions .83.3Implementation in the civil engineering curriculum . 114Summary . 125Budget Information . 12References . 13iii
1 IntroductionRanging from geotechnical engineering education to professional practice, geotechnicalengineers and students face similar decisions about the optimal methodology for performingengineering calculations. For example, they may perform hand calculations, create a spreadsheetusing Microsoft Excel, create a Mathcad worksheet, or utilize commercial geotechnicalengineering software available through their educational institution or company. A well-roundedengineer should be comfortable with multiple alternatives for completing a certain task. Thisproject concerns the development of a geotechnical engineering software package within thestatistical language and environment R (R Core Team, 2016). The software package, namedgeotech (Kaklamanos and Elmy, 2016a), has the capability to perform a range of geotechnicalengineering computations, and is available for broad usage within geotechnical engineeringeducation, research, and practice.R is an object-oriented language and environment for statistical computing that is gainingpopularity in the scientific and engineering communities. Derived from the S language andenvironment developed at Bell Laboratories, R is an open-source language that is freely availableat http://www.r-project.org/ (R Core Team, 2016). R covers much of the functionality ofMATLAB, which is more commonly used in engineering courses. However, because R is freelyavailable and can be installed on a wide variety of computer platforms, individuals can installand use R without worrying about the hassles or costs associated with commercial softwarelicenses. An additional benefit of R is the wide availability of add-on user-contributed softwarecodes, referred to as “packages,” which perform calculations in specific areas of study. Users ofR can easily install and load these add-on packages once they have installed R on theircomputers. There are over 7000 user-contributed packages available in R (http://cran.rproject.org/), and the geotech package is the first to broadly cover the types of calculations thatwould be necessary in an introductory geotechnical engineering course (Kaklamanos and Elmy,2016a). This project builds upon prior efforts by the PI, who is the author of the nga R package(Kaklamanos and Thompson, 2010), which implements the Next Generation Attenuation ofGround Motions (NGA-West 1) earthquake ground-motion prediction equations (Power et al.,2008).R has a command-line interface that contrasts with the point-and-click type interface ofother commonly used software programs. Users who have experience with the commercialsoftware MATLAB generally find that the syntax of R is easy to learn due to the similarities.However, in order to use specific R packages such as the geotech package, it is not necessary toinvest a great deal of time to become an expert in the language. All that is necessary is a basicunderstanding of some simple commands and an awareness of the extensive help documentationavailable within R. The quality and extent of the R documentation is unsurpassed by many otherprograms. The geotech package could therefore be reasonably incorporated into undergraduategeotechnical engineering courses without a large amount of additional instruction on R, and the1
package can be used by geotechnical engineering practitioners and researchers without requiringa herculean initial effort to understand the program.2 Project OverviewThe development of the geotech R package was performed at Merrimack College byProf. Jim Kaklamanos (the Principal Investigator) and an undergraduate student researchassistant, Mr. Kyle Elmy. Mr. Elmy graduated with a B.S. in Civil Engineering at Merrimack2015, and has since continued at Merrimack to pursue an M.S. in Civil Engineering. During thesummer between his undergraduate and graduate careers, Mr. Elmy worked full-time on thedevelopment of the software package in R, with his summer salary being supported by thisUSUCGER special project grant (see Section 5: Budget Information). He also continued thiswork during an independent study during the fall 2015 semester. This project offered thisstudent with an opportunity to collaborate with the PI on a useful contribution to the field ofgeotechnical engineering. The results of this project are being presented at the 2016 AmericanSociety of Civil Engineers (ASCE) Geotechnical and Structural Engineering Congress inPhoenix, Arizona, in February 2016. The conference presentation and paper are entitled,“Development of a Geotechnical Engineering Software Package in R and Its Implementation inthe Civil Engineering Curriculum” (Kaklamanos and Elmy, 2016b). The conference papercontains similar information to this project report, but also contains additional details beyond thescope of this report. The most useful resource, however, is the online help documentationassociated with the geotech package.The project was divided into three tasks, which are briefly described below, andexpanded upon in the Results section of this report.1. Identify and outline the geotechnical engineering calculations to be included.2. Program and validate the geotechnical engineering functions in R.3. Compose the help documentation and distribute the package.2.1Task 1: Identify and outline the geotechnical engineering calculationsto be includedThe first task was to identify and outline the geotechnical engineering calculations toinclude in the geotech R package. In the first version of the software package, an emphasis hasbeen placed on calculations that arise within the context of an introductory geotechnicalengineering course. These topics and the associated R functions are discussed in the Resultssection. In future versions of the geotech R package (beyond the scope of the current project),the functionality of the package could be extended to include more advanced calculations in thedesign of foundations and earth-retaining structures, and the analysis of slope stability.2
2.2Task 2: Program and validate the geotechnical engineering functions inROnce the calculations were outlined, Mr. Elmy worked with the PI to write structuredfunctions for the geotechnical engineering calculations in R. Users are able to performcalculations by calling the function name and specifying a list of arguments appropriate to eachfunction, as described in the Results section. After the functions were written, validations wereperformed by comparing the R output against hand calculations and output from other programs(such as Microsoft Excel). To perform these validations, Mr. Elmy and the PI used coursematerial from Civil Engineering 3020 – Geotechnical Engineering at Merrimack College, andcross-checked the results with additional examples from textbooks such as Coduto et al. (2011),Holtz et al. (2011), and Das and Sobhan (2014).2.3Task 3: Compose the help documentation and distribute the packageThe final task was to compose an extensive library of help documentation, following theformat specified in the R package guidelines. The help documentation includes some backgroundon the purpose of each function, details on the input and output of each function, and uniqueexamples. An important component of Task 3 is the dissemination of this software package tothe broader community. Because the result of this project is a software package, the primarymode of distribution is the Internet (specifically via the R project website and/or the PI’sresearch website, as described in Section 3.1). The presentation given by the PI at the AmericanSociety of Civil Engineers (ASCE) Geotechnical and Structural Engineering Congress will alsohelp serve this purpose. The long-term goal is for geotechnical engineering students, professors,researchers, and practitioners across the world to have access to and benefit from the geotechpackage.3 ResultsIn this section of the report, we provide details on the results of this project: the geotechsoftware package in R. The availability of the software, its installation and initialization, and thefunctions and documentation of the software will be discussed. An example calculation sessionwill also be provided, but users are referred to the help documentation associated with the projectfor more comprehensive details and examples.3.1The geotech R packageIn this section, we provide an overview of how the geotech package is employed withinthe statistical language and environment R.3
3.1.1Availability and installationR is available for download at the R project website: http://www.r-project.org/ (R CoreTeam, 2016). In this report, we provide some basic examples on using R (within the context ofthe geotech package), but a large amount of general documentation is available on the R projectwebsite, including details on how to install and become acquainted with R for the most commonoperating systems. The user can run R directly from the command-line interface once installed,or may choose to employ a user interface environment, such as RStudio (RStudio Team, 2016)or R Commander (Fox, 2005).Once R has been installed on your system, the next step is to install the geotech package.This package can be installed by using the package manager within R (accessed via the dropdown menus), or by typing install.packages("geotech")into the R command prompt. Commands intended to be entered at the R command line areindicated by lines that begin with the greater-than symbol. All functions in R have parentheses,and the function arguments, if any, are placed inside the parentheses; here, the argument is apackage name, which is placed in quotes because it is a character string.Alternately, the package may be installed by downloading the appropriate binary file(Windows or MacOS X) from the geotech R package website: x.html, which also can be accessed through the researchwebsite of the PI (http://www.kaklamanos.com). To install the package locally using the binaryfile, the relevant files are geotech version .tgz for Unix variants (including Mac OSX), andgeotech version .zip for Windows operating systems. Download the appropriate file into adirectory on your computer (do not decompress the file), and follow the relevant instructionsbelow. To install the geotech R package on a Microsoft Windows system, select the drop-downmenu Packages from the R GUI, and then select “Install package(s) from local .zip files.” Youwill then be prompted to locate the .zip file on your computer. To install a package on Mac OSX, select the drop-down menu Packages & Data from within the Mac R GUI, click PackageInstaller, and select the Local Source Package option in the Packages Repository panel. Toinstall the package on a Unix-based system at the R command prompt, type install.packages("XYZ/geotech/ version .tar.gz, repos NULL),where XYZ indicates the path to the directory where the .tar.gz file is located.Note that an additional file, geotech version .tar.gz, is the package source file, whichcan be viewed or compiled on any operating system. In order for Windows users to unzip thisfile, we recommend the program 7Zip, which is available at http://www.7-zip.org/. An importantuse of the .tar.gz file is to view the source code for the calculations; once the file is unzipped,navigate to the R subfolder and open the respective source-code files. Alternatively, users mayview the source code for a specific function by typing that function’s name into the console (e.g.install.packages for the function used at the beginning of this paragraph).4
3.1.2Initialization and documentationOnce installed, the geotech package must be loaded into the active R session in order toaccess its functions. The user may load the package into the R session by accessing this optionfrom the drop-down menu or by typing library(geotech).For users to familiarize themselves with R and the geotech package, the command help.start()will open the extensive HTML documentation for R. If you navigate to the “Packages”hyperlink, you will see a list of the packages currently installed on your system. Click on thegeotech link to see a list of the functions that are available within the geotech package. Thestandard R help documentation for a function contains a short description of the function, itsusage and syntax, a definition for each argument, a description of the value returned by thefunction, a series of examples for using the function, and various notes and references intendedto make the function as transparent as possible to the user. When learning how to use a function,users may benefit from copying and pasting the example codes into the R command line toobserve the output. A PDF version of the reference manual is also available at the R projectwebsite and the PI’s research website; this contains the same information as the HTMLdocumentation. Anyone interested in learning more about the geotech R package withoutactually installing R is encouraged to review the PDF reference manual, as it contains muchmore information than possible in this summary report.3.1.3FunctionsThe geotech package is composed of sets of functions that are used to performcalculations and create plots that commonly arise in geotechnical engineering. In this section, weprovide an overview of the functions available within the initial version of the geotech package.Note that the current version of the geotech package has focused upon calculations that arisewithin the context of an introductory geotechnical engineering course. The types of calculationsthat are currently included are: (1) phase diagrams and index parameters, (2) grain-sizedistributions, (3) plasticity, (4) soil classification, (5) compaction, (6) groundwater, (7)subsurface stresses (geostatic and induced), (8) Mohr circle analyses, (9) consolidationsettlement and rate, (10) shear strength, (11) bearing capacity, (12) lateral earth pressures, (13)slope stability, and (14) subsurface explorations. The latter four categories include basicapplications to subsurface explorations, foundations, earth-retaining structures, and slopestability; future versions of the package may be extended to include more advanced calculationsin geotechnical design. Table 1 provides an outline of the functions currently included with thegeotech package.5
Table 1. Outline of functions included with the geotech R packageCategoryNames of functionsDescriptionPhase diagramsand t,relDensityPlot phase diagrams from weights (or masses) and volumes of a soilsample (phase.plot); calculate a comprehensive list of indexparameters from the phase diagram (phase.params); calculate watercontent from lab results (waterContent); calculate relative density(relDensity).Grain rcentComponents,Dsize,size.from.sievePlot a soil’s grain-size distribution (grainSize.plot), and performassociated calculations of percent gravel, sand, and fines(percentComponents), D-sizes (Dsize), and coefficients of uniformityand curvature (grainSize.coefs); determine the grain sizecorresponding to a specific sieve number (size.from.sieve).PlasticityLL, PI, LI,plasticity.plot,A.lineCalculate and plot a soil’s liquid limit (LL) using the flow curve;calculate plasticity index (PI) and liquidity index (LI) from Atterberglimits and in-situ water content; plot a soil’s plasticity parameters onCasagrande’s plasticity chart (plasticity.plot); calculate the PIassociated with the A-line on Casagrande's plasticity chart (A.line).SoilclassificationAASHTO, USCS,GI, USCS.coarse.symbol,USCS.fine.symbolClassify a soil using grain-size and plasticity data using the AmericanAssociation of State Highway and Transportation Officials (AASHTO)classification system and the Unified Soil Classification System(USCS). There are also some sub-functions that perform parts of thecalculations; for example, determining AASHTO group index andUSCS group n.calc,compaction.plot,relCompactionCalculate the dry unit weight from experimental results (gammaD.exp)or theoretically from a specified degree of saturation and specificgravity (gammaD.theo, which is used for plotting the zero air voidscurve); calculate a soil’s compaction curve as well as its maximum dryunit weight and optimum moisture content (compaction.calc); plot asoil’s compaction curve and the zero air voids curve (compaction.plot);calculate relative compaction (relCompaction).GroundwaterkConstant, kFalling,kx, kz, wellFlow,wellDrawdown,kPumpCalculate hydraulic conductivity from constant head and falling headtests (kConstant, kFalling); calculate equivalent horizontal and verticalhydraulic conductivities for layered soils (kx, kz); calculate flow ratesand groundwater levels for wells in confined aquifers, unconfinedaquifers, and mixed aquifers (wellFlow, wellDrawdown); calculatehydraulic conductivities from pumping tests ced.area,induced.area.profileCalculate and plot total vertical stresses, effective vertical stresses, andpore water pressures (sigmaZ, sigmaZ.profile, sigmaZ.plot); calculateinduced stresses due to point loads (induced.point,induced.point.profile) and area loads (induced.area,induced.area.profile). The functions ending in “.profile” calculate thevariation of stresses with depth.Mohr le.plot,sigma13, tauMaxCalculate normal and shear stresses on an inclined plane (stressTrans);calculate and plot the Mohr circle (MohrCircle.calc, MohrCircle.plot);calculate principal stresses and their orientations (sigma13); calculatethe maximum in-plane shear stress and its orientations (tauMax).6
CategoryNames of functionsDescriptionConsolidationsettlement andratecons.plot, deltaPC,deltaSC, Tv.to.U,U.to.Tv, deltaPC.rate,rate.plotPlot a soil’s consolidation curve (cons.plot); calculate amounts ofprimary consolidation settlement (deltaPC) and secondary compressionsettlement (deltaSC); calculate the time factor from percentconsolidation (and vice versa) using the simplified method forconsolidation rate calculations (Tv.to.U, U.to.Tv); calculate and plotsettlement versus time curves (deltaPC.rate, rate.plot).Shear lot,UC.calc, UC.plotCalculate and plot a soil’s Mohr-Coulomb failure envelope with aknown friction angle and cohesion (MohrCoulomb.calc,MohrCoulomb.plot); calculate and plot the results of a direct shear test(directShear.calc, directShear.plot); calculate and plot the results of atriaxial compression test (triaxial.calc, triaxial.plot); calculate and plotthe results of an unconfined compression test (UC.calc, acity, Nc,Nq, NgammaCalculate bearing pressure and ultimate bearing capacity for shallowfoundations (bearingPressure, bearingCapacity), as well as theoreticalbearing capacity factors (Nc, Nq, Ngamma).Lateral earthpressureK, Ko, Ka, Kp,sigmaX,sigmaX.profile,sigmaX.plotCalculate at-rest, active, and passive lateral earth pressure coefficientsusing various methods (K, Ko, Ka, Kp); calculate horizontal stresses inthe subsurface (sigmaX, sigmaX.profile); plot horizontal stressesversus depth (sigmaX.plot).Slope stabilityFSinf, FSplanarCalculate factors of safety against shear failure on slopes using infiniteslope analyses (FSinf) and planar failure analyses (FSplanar).Subsurfaceexplorationssoil.profile, N60,N160Plot one-dimensional soil profiles (soil.profile) and performcorrections to standard penetration test data for field procedures (N60)and effective overburden stress (N1,60).Table 1 is intended to serve as a broad overview of the calculations currently associated with thegeotech package. Comprehensive details of these functions are available in the HTML helpdocumentation associated with the geotech package, and in the PDF reference manual associatedwith the package. The user may access the HTML help documentation from thehelp.start() command mentioned earlier, or by typing help(FunctionName)or ?FunctionName ,where FunctionName is the name of a specific function (such as compaction.calc orsigma13). Queries on specific topics (other than the names of functions) may be performedusing the built-in help documentation in R by typing help.search("Topic"),7
where Topic is the name of the topic for which you are searching (it is necessary to encloseyour search in quotes). There is also a wide array of helpful Internet resources on R that may beaccessed by any search engine.3.2Example sessionsIn this section, we provide an example session of the R package, using data from a sieveanalysis to classify a coarse-grained soil. This basic example is intended to illustrate typicalusage in R, the flexibility of input and output, and some fundamental syntax and programmingconcepts that are helpful to know prior to starting R. Many additional examples are providedwith the HTML help documentation available with the package.For this example, we will analyze data from a sieve analysis to plot the grain-sizedistribution and classify a coarse-grained soil using the Unified Soil Classification System(ASTM 2011). The grain-size distribution, obtained from a laboratory sieve test, is given inTable 2. The function used for creating the grain size distributions is grainSize.plot, whichhas arguments sieve, size, percent, and metric. The documentation for functiongrainSize.plot informs us that either sieve or size must be used for the data on thehorizontal axis; sieve is a list of the sieve numbers according to ASTM D422 (ASTM 2007)and size is the corresponding particle sizes in inches or millimeters. Only one of theseparameters (sieve or size) needs to be entered. The percent argument gives thecorresponding percentage of soil finer by weight, and metric is a logical variable (either TRUEor FALSE) to indicate whether metric or English units are used. The documentation for eachfunction clearly indicates the required units of the arguments if there are any restrictions. Increating the geotech package, we have designed the inputs to the functions to be as flexible aspossible (e.g., by allowing different types of input data [here, either the sieve numbers or theparticle sizes must be specified] and different units).Table 2. Grain-size distribution for Example 1.Sieve No.Grain size (mm)Percent finer (%)3/8-in9.5095.72No. 44.7590.23No. 102.0081.49No. 200.85066.36No. 400.42550.00No. 1400.1068.61No. 2000.0754.828
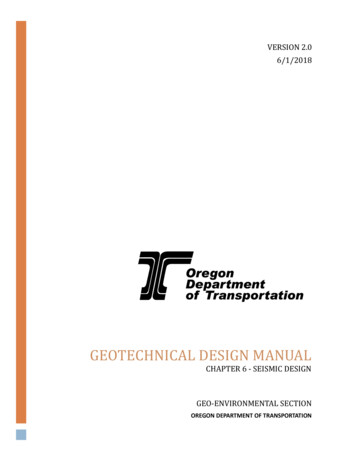
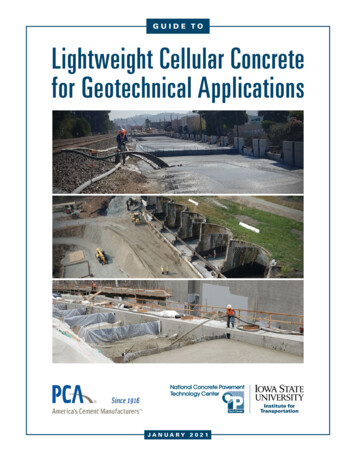
The user may define the input data as follows, using variable names of his or her choice: ## Input Parameters sieve.example - c(3/8, 4, 10, 20, 40, 140, 200) percent.example - c(95.72, 90.23, 81.49, 66.36, 50.00, 8.51, 4.82)The first line of code is a comment (comments in the R language are specified with the numbersign, #), and the second and third lines assign data to the variables sieve.example andpercent.example. Assignment in R is performed using the assign command: - (i.e., anarrow-like symbol). An equal sign ( ) may also be used to assign variables in most situations;however, the equal sign is usually used to assign arguments within function calls.The variables sieve.example and percent.example are vectors, and vectorizedvalues have been assigned using the “c” (concatenate) operator. Once assigned, individualelements of vectors or matrices may be accessed using brackets. For example, typingpercent.example[1] would access the first element of the percent.example vector,and would output 95.72. Note that R is a case-sensitive language, and typing a variable withdifferent capitalization (such as PERCENT.example) would return an error.An example function call for generating the grain-size distribution would be: grainSize.plot(sieve sieve.example, size NA, percent percent.example, metric TRUE).The order of the function call does not matter as long as each mandatory argument is named. Onecan save space by omitting the argument’s name (and inputting the values directly), as in: grainSize.plot(sieve.example, NA, percent.example, TRUE).When the argument names are omitted, the arguments are matched by their order, as listed in thefunction documentation. The argument size does not need to be specified (because sieve hasbeen specified instead). Any arguments that are left unspecified will be assigned their defaultvalue, as described in the function’s documentation. For the grainSize.plot function, thedefault value of size is NA, which indicates that no inputs have been assigned to this variable(provided that sieve has been assigned). Therefore, an acceptable function call would also be grainSize.plot(sieve sieve.example,percent percent.example, metric TRUE).When the function is called, the grain size distribution will appear in a new window, illustratedin Figure 1. This figure can be saved in a number of different formats by selecting “Save as”from the file menu. Alternatively, more advanced users can use the grainSize.plotfunction within a script to write the plot directly to a file, hence bypassing the output to thescreen. To learn more about the grainSize.plot function, users may study the HTML orPDF help documentation, or they may view the source code for the function by typing thefunction name directly into the command prompt with no arguments:9
grainSize.plot.The function may also be executed by pasting its source code into the R command terminal.Users are welcome to modify the source code of this function to further adapt the plot if desired;for example, to plot multiple curves on the same plot, change the titles, and/or to adapt thecolors. The plotting functions in our software package are provided with the intention that theywill serve as a base for users’ specific applications.Besides creating the plot, some additional calculations can be performed using the datafrom the grain-size distribution. For example, the percent components of gravel, sand, and finesmay be computed using the percentComponents function; using the output from thisfunction, we find that this sample is composed of 9.77% gravel, 85.41% sand, and 4.82% fines.The D-sizes of the distribution (corresponding to certain percent-passing values) may becalculated by the function Dsize. Finally, the coefficients of uniformity and curvature (Cu andCc) are calculated by the grainsize.coefs function or from direct calculations using theoutput of the Dsize function: Cu 5.83 and Cc 0.65.Figure 1. Grain-size distribution for Exa
Special Project Grant 2015 Final Summary Report geotech: Development of a . file, the relevant files are geotech_ version .tgz for Unix variants (including Mac OSX), and geotech_ version .zip for Windows operating systems. . and follow the relevant instructions below. To install the geotech R package on a Microsoft Windows system, select .