Transcription
Fiji for BeginnersA slow paced, hands on seminar for the uninitiated. Fiji is a powerfultool with a lot of flexibility. Let’s start with the basics!Michelle OcanaNeurobiology Imaging Facilitynif.hms.harvard.edu
Getting Started. Fiji or Image J? Fiji is ImageJ!It downloads with all the pluginsIt will update regularly (if you approve)Updates (plugins) can be brokenFixing broken updates (plugins) can be difficultYou can always uninstall and re-install (this fixes almost everything)Extract zip folder to your desktop (works best when not in program files)Fiji Downloadhttps://fiji.sc/ImageJ Downloadhttps://imagej.nih.gov/ij/download.html
Bioformats Importer Opens All File Formats Found in plugins Opens all image formats Updated regularly to include new formats Gives flexibility in how you open your file
Using Bioformats Click on Plugins Choose Bioformats Bioformats Importer Choose you file Choose how to open it-description of choices on the right HyperstackMetadata OnlySplit channelsComposite (colors together as an RGB)/defaultStitch files (will open sequential files as one)
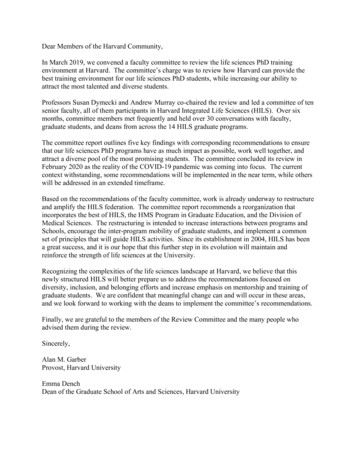
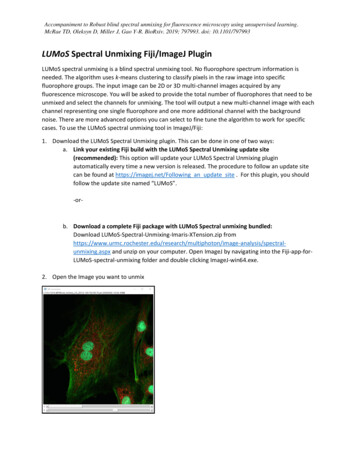
Open file in ImageJ Images about1.tif
What Just Happened? The image opened in monochrome Image stack The each color is found by using theslider at the bottom Fiji opens the image in order ofacquisition or save order from theimaging system *(usually lowestwavelength is color 0 or 1 (C0)
The Menu Bar Allows manipulating of the image size and location Drawing tools Paintbrush and font
Add Color to Your Image1. Make sure you are on C 1 (slider ison far left)2. Image Lookup Table Blue3. Move slider to C 24. Image Lookup Table Green5. Move slider to C 36. Image Lookup Table Red
Split Colors Almost everything attributed to the image view is in the Image menu Choose “Color” Choose “Split Channels”Merge Colors Choose “Color” Choose “Merge Channels” Merge channels C0 Blue, C1 Green,C2 Red
Adjusting Intensity and Contrast. Keep ItSeparate! Image Adjust Brightness/Contrast Move “Maximum” slider tomiddle position Move “Minimum” past thefirst peak Move “Brightness andContrast” Slider
Opening Image StacksImage1.oib Similar to opening a single image Use Bio-formats Slider at bottom changes stack numberImage Stacks Stack to Images/ Images to StackSlider at bottom changes stack numberMontageZ Project (Projection)
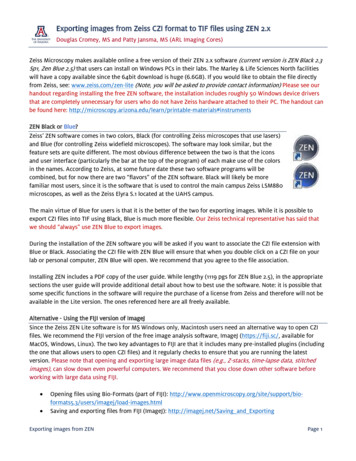
Histograms are Your Secret Weapon Histograms are found when adjusting Brightness/Contrast and bypressing cntrl H Histograms reveal the pixel intensity information for your image It reveals the bit depth (what the maximum pixel intensity) 2 types of resolution1.2.PHYSICAL- Optical resolution: the resolution of the objective (Numerical Aperture andMagnification)DIGITAL - Bit Depth: the degree of intensity range in the image. Each pixel has anintensity value. A high value is bright a low value is dark. The number of intensitypoints between the lowest and highest intensity number is bit depth. 8 bit 256 12 bit 4096 16 bit 65535
What I know from looking at the Histogram This image is 8 bit (intensityvalues range from 0-256) This image has a lot of dark(low signal) pixels This image has few or nobright pixels (pixels reaching256) If I click “Auto” I can see thatthis image has a number ofpixels at intensity value 254
Adding a Scale Bar Scale bars are located underAnalyzeIt’s a little hidden Analyze Tools Scale Bar
Scale Bar Continued If the image is displaying the scalein pixels and not microns thenresolution was not imported withthe imageGo to Image Image Info to take alook at the information collected.Go to Image Properties to see thepixel information that has (or hasnot) been saved with your image.Saving images as the native formatis best
Preparing for AnalysisRemoving Noise –Median Filtering Single pixel noise can ruin analysis Removing noise should be applied prior to segmenting your particlesfor measurement. Median filter nonlinear digital filtering technique Distinguishes out-of-range isolated noise from legitimate imagefeatures such as edges and lines. Specifically, the median filter replaces a pixel by the median, insteadof the average, of all pixels in a neighborhood Process Filters Median
Removing Background Background subtraction is found underProcess in the menu For fluorescent images u you uncheck“Light Background” Use the “Preview” checkboxto see your progress 50 is a good starting point
Segmentation/Threshold Partitioning a digital image intomultiple segments. Simplifies the representation of animage into something that is moremeaningful and easier to analyze Image Adjust Threshold
Measuring: Set Measurement Basic analysis functionsChoose what you want to measure and viewGo to Analyze Set MeasurementArea, Mean Gray Value, Standard Deviation,Min/Max
Analyze Particle Counts and measures objects inbinary or thresholded images Finds edges of objects andmeasures them
Measuring and Analyzing Particles Size (pixel 2): ability to exclude a sizerange Circularity: Excludes particles that areless circular (1 perfect circle) Show: How do you want to visualizewhat was counted Checkboxes: Choose what to measureand see
Measure Particle Results
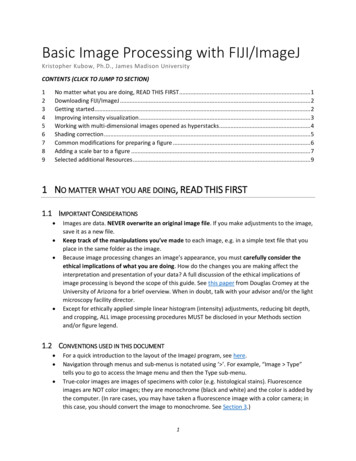
Distribution Visualize the distributionof particles by yourspecifications Hover cursor over any ofthe bars to see the size
Plot Profile Intensity across adefined region Use with line or square
ROI Manager Manages your regions Add and measure same region on other image (colocalization)
Image stack The each color is found by using the slider at the bottom Fiji opens the image in order of acquisition or save order from the . Area, Mean Gray Value, Standard Deviation, Min/Max. Analyze Particle Counts and measures objects in