Transcription
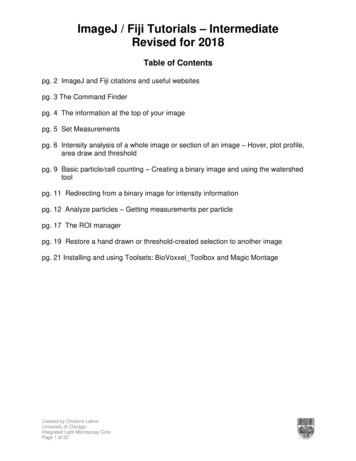
ImageJ / Fiji Tutorials – IntermediateRevised for 2018Table of Contentspg. 2 ImageJ and Fiji citations and useful websitespg. 3 The Command Finderpg. 4 The information at the top of your imagepg. 5 Set Measurementspg. 6 Intensity analysis of a whole image or section of an image – Hover, plot profile,area draw and thresholdpg. 9 Basic particle/cell counting – Creating a binary image and using the watershedtoolpg. 11 Redirecting from a binary image for intensity informationpg. 12 Analyze particles – Getting measurements per particlepg. 17 The ROI managerpg. 19 Restore a hand drawn or threshold-created selection to another imagepg. 21 Installing and using Toolsets: BioVoxxel Toolbox and Magic MontageCreated by Christine LabnoUniversity of ChicagoIntegrated Light Microscopy CorePage 1 of 22
ImageJ and Fiji Citations and SitesSites to download ImageJ and related softwareImageJ download site: https://imagej.nih.gov/ij/download.htmlFiji download site: https://imagej.net/Fiji/DownloadsCell Profiler: http://www.cellprofiler.org/Icy: er: http://www.micro-manager.org/A Note to Fiji UsersIn this guide, I mostly refer to ImageJ and Fiji collectively as ImageJ. Most processesare the same across the two programs and typing ImageJ/Fiji got tiresome and used upspace. If there is something different about or added to a process in Fiji (e.g. updatingon pg. 3 or using a macro on pg. 11) I have highlighted that with a callout to Fiji users.Citation for the Nature Methods paper on ImageJSchneider, CA, Rasband, WS, and Eliceiri KW. (2012) NIH Image to ImageJ: 25 Yearsof Image Analysis. Nature Methods 9(7): 671-5.Places to go for expert helpThe ImageJ Mailing List: https://imagej.nih.gov/ij/list.htmlThe ImageJ Forum: http://forum.imagej.net/Both the Mailing list and the forum are monitored by a large community of ImageJ usersand developers, including the creator of ImageJ Wayne Rasband and the Fijidevelopment team, as well as a large number of plugin developers. Questions to thelist and forum are usually answered within a day or two.One Way to Site ImageJ in Your ManuscriptRasband, W.S., ImageJ, U. S. National Institutes of Health, Bethesda, Maryland, USA,http://imagej.nih.gov/ij/, 1997-2012.Created by Christine LabnoUniversity of ChicagoIntegrated Light Microscopy CorePage 2 of 22
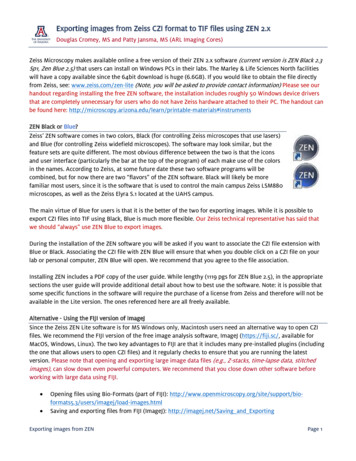
The Command FinderImageJ has so many features it can be hard to keep track of all of them. Thankfullythere is a guide to help you find the command you are looking for.In Fiji version 1.51 and higher,type your search term in to thewhite box at the end of thetaskbar and a new window willpop up with your search resultsIn ImageJ, The Command Finder can be brought up by pressing the letter L on yourkeyboard.For both Fiji and ImageJ, type the name of the command you are searching for in theSearch box and ImageJ will list all of the commands with similar names. In thisexample, I was searching for the command to add a scale bar. The name of thecommand is in the far left column, followed by the menu path if you would like to run thecommand manually. You can also choose to highlight the command and then hit the“Run” button at the bottom of the screen to run the command.Created by Christine LabnoUniversity of ChicagoIntegrated Light Microscopy CorePage 3 of 22
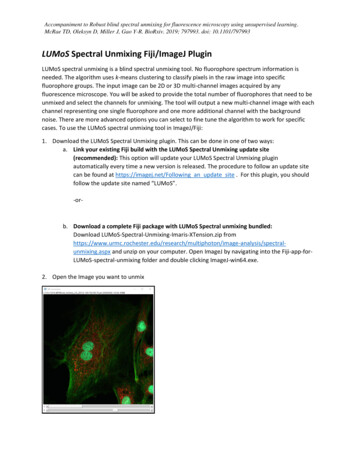
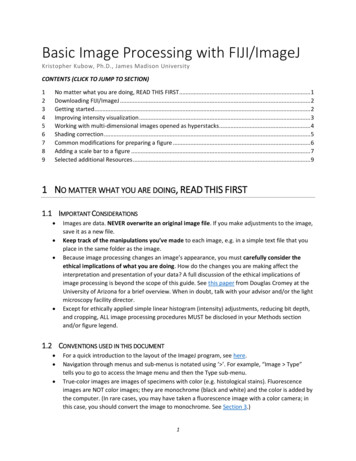
The Information at the Top of your Image123456This information is also foundin our ImageJ Basics tutorial, butit is important (especially thehighlighted section) so it bearsrepeating.1) The top line contains the nameof the image. This is the “flybrain”sample image from the ImageJlibrary.2) On the next line, you will see“24/57”. This means we arecurrently looking at slice 24 of atotal of 57 slices in this stack. Ifwe had a hyperstack (see pg.28), there would be numbers forthe color channel, z-slice and/ortime point, depending on theinformation in our stack. If wehad an image that was a single slice, these numbers would be missing and theinformation would start with image size.3) “684.93um x 684.93um” is the actual image size, or you can think of it as the size ofthe field of view. The units on this value depend on how the image is calibrated (seeour ImageJ Basics tutorial pg. 19). In this case, the units are microns. When you makemeasurements that involve physical size (area, length, integrated density) the units onthat value are THESE units. If the image is NOT calibrated, the units here and in yourdata table will be pixels.4) “(256x256)” is the image size in pixels. This number is always in parentheses andalways has units in pixels, whether the image is calibrated or not. If the image is notcalibrated, these numbers and the numbers before (#3) will match.5) “RGB” is the image type. This image is an RGB color image. It is a composite ofthree 8-bit grayscale images, one for red, one for green and one for blue. Images canalso be 8-, 12-, 16- or 32-bit grayscale. Note: if you have a 12-bit grayscale image,ImageJ will list it as a 16-bit grayscale image. I do not know why this happens.6) “14MB” is the amount of memory your image takes up on your hard drive. You willnotice that .tifs take up more memory than compressed file types like .jpgs and .gifs.tifs are large, but they are the best file type for preserving your data, as they are nonlossy. They do not throw away any information from your image. With compressed filetypes, data is lost during the compression.Created by Christine LabnoUniversity of ChicagoIntegrated Light Microscopy CorePage 4 of 22
Set MeasurementsMost of this tutorial is about gettingquantitative data from your images. This is notan exhaustive tutorial on all the different kinds ofdata that can be obtained from ImageJ, thatwould take a book (or several)!Mainly we will be looking at different ways to getdata using the built in Analyze Measure andAnalyze Analyze Particles commands. Thissatisfies many of the common requests forquantitative information that we get.Before using these commands, go to Analyze Set Measurements and choose the data youwant listed in your data table.The choices in the top portion of the “Set Measurements” window are described on theImageJ Documentation page. Some of the more commonly used measurements are:Area – The area of the selection in pixels or in units squared if the image is calibratedwith Image Properties or Analyze Set Scale.Mean Gray Value –The sum of the gray values of all the pixels in the selection dividedby the number of pixels.Centroid – The center point of the selection determined by averaging the X and Ycoordiates of all the pixels in the selection. Given in X and Y coordiates (does not workin 3D). Center of mass is a brightness weighted version of centroid, with coordinateslisted under XM and YM.Feret’s Diameter – The longest distance between any two points on a selectionboundary. Choosing this option also gets you the smallest distance between any twopoints (MinFeret) as well as the Feret Angle and the X and Y coordinates of the startingpoint of the Feret diameter (FeretX and FeretY).Integrated density – The product of the area and the mean gray value or the sum of allthe pixel intensities in the selection. Often used to analyze dot blots.Created by Christine LabnoUniversity of ChicagoIntegrated Light Microscopy CorePage 5 of 22
Intensity AnalysisHover and Read out Gray Levels Pixel by PixelThere are many ways to read out theintensity information in an image or imagestack. One of the easiest is to hover overan area of the image and view the readoutof the gray level pixel-by-pixel on theImageJ toolbar.This method is useful for determiningsignal to noise in an image, estimating thegray value of your “background” pixels orother quick estimates of intensity.There are other methods better suitedto measuring gray levels across an imageor object.Plot ProfileTo plot the pixel intensities along a line,first draw a line on you image. Thenchoose Analyze Plot Profile (keyboardshortcut Control K).To get a list of all the values in the plot,hit the “List” button at the bottom of the plotwindow. This list can be saved as anExcel compatible data table.Created by Christine LabnoUniversity of ChicagoIntegrated Light Microscopy CorePage 6 of 22
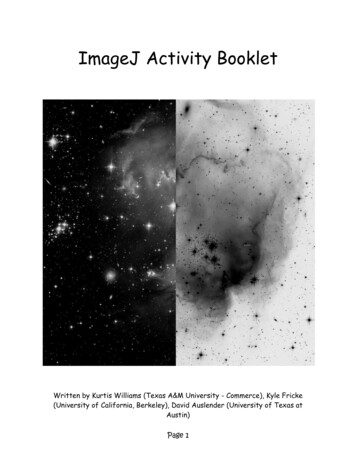
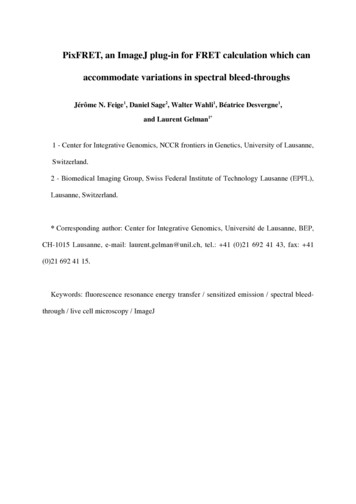
Using the Measure Tool with a Drawn AreaAnalyze Measure will give youstatistics on the WHOLE IMAGE,including all the 0 and low intensitypixels around your object of interest.Unless your object covers theentire area of the image, you areprobably going to want to limit yourmeasurements somehow.Drawing an area around or withinan object with a draw tool is one wayto do this. Then Analyze Measure will only consider what’sinside the boundary.“Mean” mean gray level“Area” is in um 21) Whole image2) Within the yellow boundary lineIf you would like to draw and measure more than one or two areas on a given image,consider storing your regions by adding them to the ROI manager (pg. 17).Created by Christine LabnoUniversity of ChicagoIntegrated Light Microscopy CorePage 7 of 22
Using the Measure Tool with a ThresholdA threshold is another way to limit your measured area. Instead of a physical limit,like a line, this is an intensity limit. The threshold will only consider pixels with grayvalues within limits that you set.To limit your measured area using an intensity threshold:1) Go to Analyze Set Measurements and check “Limit to Threshold”. While you’rehere, consider checking “Display label” to have the name of your image listed in theResults window along with your measurements.2) Use the Image Adjust Threshold tool to highlight the area(s) you wish tomeasure. You can either use the sliders or use the “Set” button to type in values. Set isuseful when you want to quickly threshold a number of images using the same values.3) Choose Analyze Measure. If you keep your “Results” window open betweenmeasurements, you can add as many measurements from as many images as youwant. This table can be saved as an Excel compatible table by choosing file Save Asfrom the menu on the Results window (NOT the main ImageJ window).“Mean” mean gray levelArea is in um 21) Whole image2) Yellow area from pg. 33) Thresholded areaCreated by Christine LabnoUniversity of ChicagoIntegrated Light Microscopy CorePage 8 of 22Information about the otheroptions in this window can befound on the ImageJ websiteunder Documentation, MenuCommands
Creating a Binary ImageWhat if we wanted to count the number of objects in an image, or know the meangray value or area of each of those objects? We can use the Analyze Particles functionto do both of these things.In this example, we are starting with a singlechannel, grayscale image.1) If you just want an object count, or if the statisticsyou want for each particle (see pg. 5 for the list ofpossible stats) does not involve intensity (e.g. area,Feret’s diameter) continue to step 2. If the statisticsyou want DO involve intensity information (e.g. meangray value, integrated density) or you’re not sure, firstmake a copy using Image Duplicate or Cntl Shift D before continuing to the threshold step.2) Use Image Adjust Threshold to highlight the objects to count and / or measure.A thresholded image is shown below.The Threshold Tool3) In order to use theAnalyze Particlesfeature, the image mustbe binary (contain onlyvalues that are 0 or255).To make this imagebinary, either use the“Apply” button on the“Threshold” window with“Dark background”checked, or chooseProcess Binary Make Binary.Created by Christine LabnoUniversity of ChicagoIntegrated Light Microscopy CorePage 9 of 22
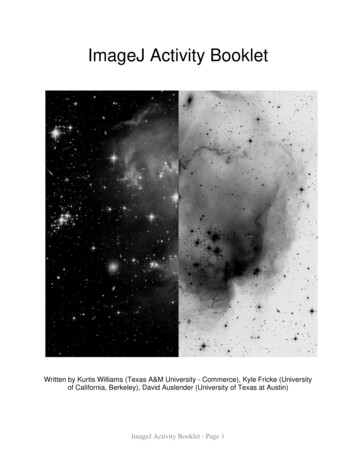
The Watershed Tool4) This is a binary image. The pixelvalues in this image are either 0(white) or 255 (black). AnalyzeParticles will only see this type ofimage.5) Holes in objects like this one canbe filled with the Process Binary Fill Holes tool.6) Before we count, notice that thereare some areas where two or moreobjects are touching. We can use theProcess Binary Watershed toolHere is the image before (left) and after (right) the Watershed tool. Notice that mosttouching objects were cut at places where the diameter of the object changed. Someobjects were cut perfectly, some were cut unnecessarily and some touching objectswere missed. This is typical of the watershed tool. Different thresholds could givedifferent results, so some experimentation with the Threshold and Fill Holes tools maybe necessary to get the best results.Created by Christine LabnoUniversity of ChicagoIntegrated Light Microscopy CorePage 10 of 22
Redirecting to another image for gray values7) At this point, if you choose any of themeasurements that involve gray values, suchas “Mean gray value” or “Integrated density,” goback to the “Set Measurements” window underAnalyze Set Measurements.Use the Redirect to: pulldown at the bottom ofthe “Set Measurements” window to redirect tothe copy of your original image (whatever itsname may be). The image must be open inImageJ to appear in the pulldown. If you don’tredirect, all of your values will be taken from thebinary image, so they will be either 0 or 255, notthe true values!8) Once you have chosen the statistics you want, created a binary image and, ifnecessary, redirected to a copy of the original image for gray values, you are ready tochoose Analyze Analyze Particles. The next few pages will walk you through theAnalyze Particles menu.Created by Christine LabnoUniversity of ChicagoIntegrated Light Microscopy CorePage 11 of 22
Analyze ParticlesAnalyze Analyze Particles has lots of features that allow for fine tuning of objectdetection and documentation of counts. We will walk though each of these features inthe next few slides.The Help, Documentation, Menu Commands section on the ImageJ website alsoprovides information on these features.The first feature in the “Analyze Particles” window is a size threshold. The default (0Infinity) is to include all objects no matter how large or small they are.However, in this image, all of the nuclei should be roughly the same size. Other,smaller objects in the image are likely debris. If nuclei are approximately 100um 2 insize, a range of 80-120um would likely count all of the nuclei while excluding objectsthat are too large or too small to be considered.IMPORTANT – check the units on your size threshold (circled above)! If you havenot calibrated your image under Image Properties, these units may not be correctand your size cutoff will be inaccurate.Checking the “Pixel units” box will cause the size threshold to ignore the units ofscale and exclude objects based on how many pixels they contain. This is a good wayto exclude single pixel noise spots from being counted as objects.Created by Christine LabnoUniversity of ChicagoIntegrated Light Microscopy CorePage 12 of 22
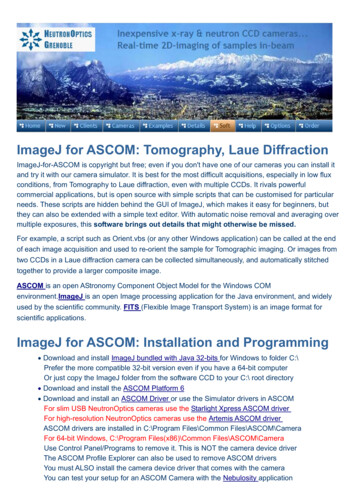
The second feature is a circularity threshold. The default (0.00-1.00) is to include allobjects no matter how round they are. 0.00 is a straight line, 1.00 is a perfect circle.Most natural objects fall somewhere along this continuum, and often using the defaultfull range is the best way to go. Some experimentation with size and circularitythresholds may be necessary.The “Show” feature of the box makes that typeof experimentation easier. . .The “Show” feature gives an image markingall of the counted / analyzed objects. “Outlines”(shown at right) creates a new image, draws theoutline of the particle, and gives each particle aunique number that corresponds to the object’snumber in the data table.Other menu choices are described (withpictures) under Documentation MenuCommands on the ImageJ website.IMPORTANT -- Checking “In situ Show”writes the outlines /masks /particles directlyonto the binary image, rather than creating anew window. DO NOT use this if you plan tore-do your analysis with new parameters!Created by Christine LabnoUniversity of ChicagoIntegrated Light Microscopy CorePage 13 of 22
“Exclude on edges” and “Include holes” are also used to exclude particles fromanalysis.Checking “Exclude on edges” will exclude any particle touching the frame of theimage from being counted / analyzed.Enabling “Include holes” will NOT count objects enclosed within other objects andwill measure objects with inclusions as though they were solid (without inclusions).Created by Christine LabnoUniversity of ChicagoIntegrated Light Microscopy CorePage 14 of 22
The rest of the “Analyze Particles” box deals with data and region of interest (ROI)management.“Display results” will create a data table listing all of the objects in the image with thestatistics you chose under Analyze Set Measurements for each object.This is a partial data table for the image above. Notice that all of the mean graylevels listed are 255. This is because Set Measurements was not set to “redirect” to theoriginal, non-binary copy of the image!If you find yourself in this situation, start back at the beginning. Create a copy of theimage with Image Duplicate, then use the threshold tool to make your copy into abinary image (pg. 9). Set up your redirect to the original (pg. 11), click back on thebinary image and run Analyze Analyze Particles again with “Clear results” checkedso you delete all of the previous results out of the table and restart the particlenumbering from 1. Leaving “Clear results” unchecked will add the results of the currentanalysis to any existing data in the “Results” table. Particle numbering will start from thelast number in the previous dataset (423 in this example).Created by Christine LabnoUniversity of ChicagoIntegrated Light Microscopy CorePage 15 of 22
“Summarize” will give a separate data table listing the name of the image beinganalyzed, the TOTAL object count and the MEAN value for all other statistics.The “Summary” window can alsobe left open through several roundsor images worth of analysis to builda dataset. This table shows theresults of four rounds of analysis onthe image above, with particle sizecutoffs of 2, 10 and 100 um 2.“Add to Manager” will add outlines of all of the particles to the ROI (Region of Interest)Manager.The ROI manager holds the shape and position of each region and can be used totransfer regions created on one image to make measurements in the same area on oneor more other images.Created by Christine LabnoUniversity of ChicagoIntegrated Light Microscopy CorePage 16 of 22
This is the ROI ManagerYou can get to this tooleither by opening Analyze Tools ROI Manager andadding regions by hand, or bychecking the “Add to Manager”box in the Analyze ParticlesWindow and automaticallyadding all ROIs to the Manager.Notice each region isindividually numbered, both inthe manager and on the binaryimage.Unchecking “show all” will allow you to see one region at a time, for easier viewing.Unchecking “labels” will turn off the numbering on the image.If we click on the original image andthen on one of the region names in theROI manager list, we can restore theregion to the original image (blueoutline shown at right).Multiple regions can be selected byholding down the “shift” or “control”keys.Hitting the “Measure” button in theROI Manager window will measure theregion(s) selected, giving you aResults table with all themeasurements you selected under Analyze Set Measurements. “Delete” will removean ROI from the list, “Update” will save any changes (movement, resize) done by handto an ROI. “Add” or keyboard shortcut “t” will add a hand-drawn region to the list.Created by Christine LabnoUniversity of ChicagoIntegrated Light Microscopy CorePage 17 of 22
The “More” button at thebottom of the list will giveeven more tools.The “Multi Measure” optionis particularly useful, it willgive whatevermeasurements youselected under the Analyze Set Measurementsmenu for all regions in theROI manager. Regions donot have to be highlighted(selected) to be measured.“Save” will allow you tosave your list of ROIs forfuture use. The list getssaved in a zipped folder.To reuse, open the “Open”Analyze Tools ROImanager and go to More Open. Choose thezipped folder with your ROIset in it and the regions willappear back in the list.Created by Christine LabnoUniversity of ChicagoIntegrated Light Microscopy CorePage 18 of 22
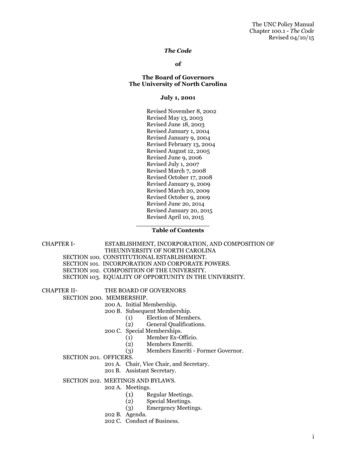
Transferring RegionsRestore SelectionThe Redirect and ROI Manager features are good ways for generating a lot ofregions (e.g. outlines of nuclei) and then using those regions to get information frommultiple images (e.g. multiple color channels, to determine something like how manynuclei are red, how many are green and how many are both).But what if we wanted to know how many small particles were inside a larger object?For example, in the image below, we have one channel representing a pancreatic islet(green, left) and one channel representing nuclei (blue, right). What if we need to knowhow many nuclei were in the islet vs. in the whole image?Edit Selection Restore Selection (keyboard shortcut Ctrl Shift E) can beused to copy any object drawn on one image to other images of the same size. Theregion/line/arrow will be copied with the same xy position and size.Regions can be moved or resized once they are transferred to the new image. In thisexample, the islet in the green image was circled using the oval draw tool. Then theDAPI blue image was selected and the selection was restored with the RestoreSelection command. The “clear outside” tool could be used to eliminate non-islet nucleifrom an object count.Restore selection is also useful for cropping multiple images to the same size andshape for figure creation. You can use Edit Selection Specify if you need to drawan object with a defined size.Created by Christine LabnoUniversity of ChicagoIntegrated Light Microscopy CorePage 19 of 22
Creating and Transferring a Selection with a ThresholdDrawn regions have their place, but often an image has objects with irregularshapes, multiple objects, or we have a dataset with too many images to hand-drawregions. In these cases, a more exact way to transfer the location of regions is to createa mask. Using the green islet image from the previous example, first use Image Adjust Threshold to threshold the object(s) to be outlined. Remember threshold onlyworks on grayscale images, which is why this image was converted from RGB color to8-bit gray.Original ImageThresholdOnce the object is thresholded, use Edit Selection Create Selection to outline the thresholded area.Finally, click the image you want to transfer the regionto and use Edit Selection Restore Selection tocreate the region on the new image(s).Create selectionRestore selection oncorresponding imageLet’s say we now wanted to count the number ofnuclei and know the average pixel intensity of eachnucleus inside the region defined by the islet (nucleiinside the yellow border (right).1) Once you have restored your outline onto thenuclei image, use Edit Clear Outside to removenuclei outside the region of interest.2) Create a copy of the cleared image and threshold / apply the remaining nuclei tocreate a binary mask image (pg. 11).3) Redirect to the non-binary copy under Analyze Set Measurements (pg. 5).4) Click on the cleared, binary copy of the nuclei image. Use Analyze AnalyzeParticles to get statistics for all nuclei in your image (pg. 12).Created by Christine LabnoUniversity of ChicagoIntegrated Light Microscopy CorePage 20 of 22
Installing and Using ToolsetsToolsets are another type of addition for ImageJ. They add on to the functions of themain task bar, and are written like macro code but installed in a way that is similar toinstalling a plug-in. We will see two different toolsets in this tutorial which enhance skillsthat we have from the Basics and Intermediate classes, but there are other toolsets outthere. Remember, all ImageJ resources are free to anyone, so don’t be afraid todownload new tools and explore their functions!BioVoxxel ToolboxThe BioVoxxel Toolbox was developed by Dr. Jan Brocher, a member of theImageJ/Fiji community with extensive experience in collecting and processing images.His Toolbox is available (with descriptions of the functions) on the Fiji site:http://fiji.sc/BioVoxxel Toolbox or without descriptions from his own site athttp://www.biovoxxel.de/macros.html. Either way, to install, right click on the link andchoose the “Save link as” option, saving the link into your ImageJ Macros Toolsetsfolder.If you are using Fiji, you can set up automatic updates for the BioVoxxel Toolboxunder Help Update Fiji. Click the “Manage Update sites” button (after theChecksummer) and check the box next to “BioVoxxel.”Once installed, click the More Tools Icon (the red double arrow) on the taskbarSelecting theBioVoxxel Taskbar will add anew icon to your taskbar. TheBio Voxxel icon is a greencube with a red arrow. Clickthis icon to see the Toolboxdropdown menu.My two favorite tools areWatershed Irregular Features,which allows tuning of the watershed function for better separation of non-round objects,and the Threshold Check, which allows you to try all of the autothresholds at once andcan help with choosing a suitable autothreshold function. Click the Fiji link above formore documentation on these tools and all others in the Toolbox.Created by Christine LabnoUniversity of ChicagoIntegrated Light Microscopy CorePage 21 of 22
Magic MontageMagic Montage was created by Jerome Mutterer. The code for the Magic Montagetool can be found on the ImageJ main page 0Montage.txt.To install, copy/paste the text into a .txt file and save it to your ImageJ Macros Toolsets folder. Once installed, restart ImageJ/Fiji and then click the More Tools Icon(the red double arrow) on the taskbar and choose “Magic Montage”You will see some additional icons added to your toolbar:The first icon will create a montage from an RGB image (splitting out one panel percolor channel, similar to the RGB to Montage plugin).The second button allows you to right click on and manipulate images within themontage (copy, paste, add images, etc).The third button allows you to re-arrange panels within the montage, and dragging theline outside the border of the montage allows you to add panels.The fourth button allows you to add text (right click on the button to see options).For more information, there is a great, short video tutorial by Mathieu Erhardt on theImageJ / Fiji documentation wiki:http://imagejdocu.tudor.lu/doku.php?id video:utilities:creating montages with magic montageCreated by Christine LabnoUniversity of ChicagoIntegrated Light Microscopy CorePage 22 of 22
In this guide, I mostly refer to ImageJ and Fiji collectively as ImageJ. Most processes are the same across the two programs and typing ImageJ/Fiji got tiresome and used up