Transcription
Research Reportingwith Tableau and theAmherst Data PondPaul BrozekResearch ITpbrozek@umass.eduMarch 12, 2020
Research at UMass Amherst UMass Amherst, the Commonwealth’s flagship public research university, isone of the nation's top universities for research as measured by national andinternational rankings, academic citations, and research funding. The campusspends more than 200 million on research each year, demonstrating itscontribution to the nation’s position as a technological and economic leader.We work in conjunction with academic, government, and private partners totranslate new knowledge and scientific discoveries into technical innovationsand scholarly works that create opportunity for students, faculty and the public.
Research Reporting with TableauCore Research Administration Systems & ToolsGoals: Provide the campus with a seamless infrastructure for research information, research datamanagement, and electronic research administration (eRA) based on robust collaboration and sharedgovernance among interested campus entities. Solutions are accessible, usable, sustainable, staffedappropriately, and integrate with current compliance systems as technology and needs change.Core Research Administration SystemsKuali Research: Sponsored ProgramsKuali Research: Compliance Proposal Development Institutional Proposals Conflict of Interest andConflict of Commitment Awards Protocols IRB – Human Subjects IACUC – Animal SubjectsOther Tools & Systems e-Protocol system for IBC (Biosafety) Service Now – Support Tickets Kuali Build – Forms and workflow SQL Editing – Toad, SQL SMS Databases SQL Server mySQL mongoDB Tableau Desktop – Creation and Editing Tableau Server – Report repository
Research Reporting with TableauWhere are the Research DATA located?– Kuali Research: Sponsored Programs (Proposals and Awards) mySQL Database – real time/hosted in the cloud by AWS– Kuali Research: Compliance (COI, COC, Protocols) mongoDB Atlas – refreshed daily/hosted in the cloud by MongoDB– Legacy Systems (JOL and JGAMS) Microsoft SQL Server – no longer updated – hosted internally
Why did Research IT SelectTableau and the Amherst Data Pond Why Tableau?– Industry standard reporting tool with many robust features– Supports connectivity to many data sources including: MySQL MongoDB SQL Server Why Tableau Server (Amherst Data Pond)– Integrated into the UMass environment by Helio and UMass IT– No additional licensing fees for an unlimited number of users– Flexible and Secure – Groups and Sub-projects *** Supported by UMass IT – Tableau Platform, Users, and Groups ***
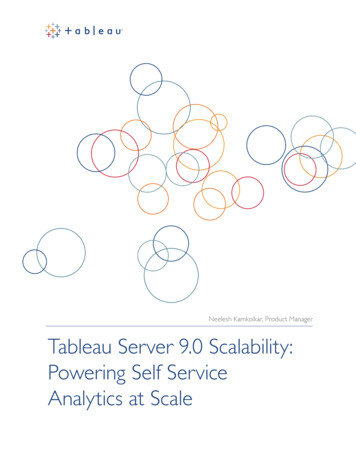
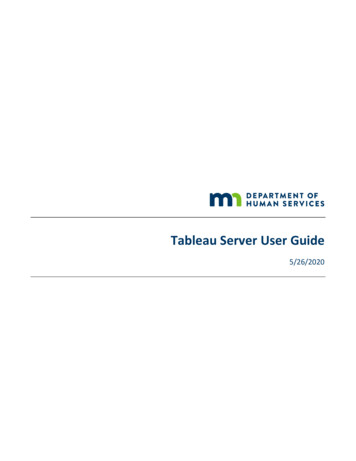
My desktopKuali Research(in the cloud)- MongoDB- MySQL5
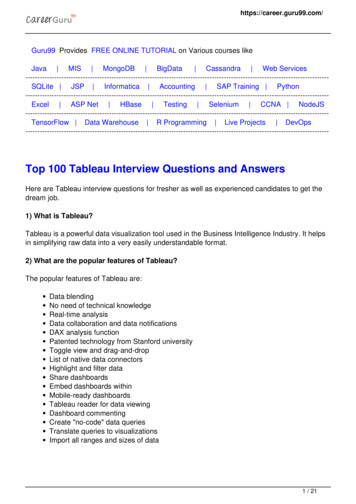
Kuali Research DashboardsDemonstration 1: https://analytics.umass.edu Proposals Dashboards– Proposals – Summary and Detailed– Proposals – PI and Co-I Award Dashboards– Awards – Summary and Detailed– Awards – PI and Co-I Automated Data Extract– Data Source Refreshes Automatically (from MySQL AWS) Daily at 4am Requirement: Tabular presentation of the data Designed for HD (1920 x 1080) resolution
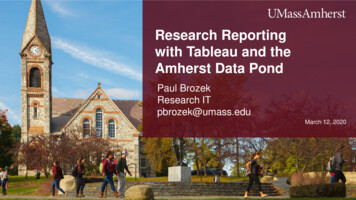
Kuali Research DashboardsDemonstration 2: https://analytics.umass.edu Negotiations Dashboard– Used by the Post Award group to monitor the status of awards in a real-time manner.– The dashboard data can be refreshed easily with the “Refresh” button. LIVE DATA– Connected to MySQL Database hosted by Amazon Web Services– Data Source Refreshes when opening dashboard Requirement: Tabular presentation of the data Designed for HD (1920 x 1080) resolution
Tableau – Performance TipsLive Data Connection vs. Data Extract Only use a Live Connection to the data when absolutely needed When using Data Extracts, automate the refresh process on Tableau Server. When to use a Live Data Connection, which is SLOWER to access– When real time data is available– When there is real need for live reporting– When the added time to access live data is acceptable When to use a Data Extract, which is FASTER to access– When real time data is not available– When there is NOT a real need for live reporting (weekly, monthly, annual reporting)– When the added time to query live data is not acceptable
Reporting with TableauOther Tips Brand your dashboards using recommended UMass Amherst logo If necessary, define screen resolution requirements in your header. Include help or a user guide in your dashboard Describe the dashboard in the headers Include the last data refresh date in the headers Make your dashboards interactive with the use of filters Use consistent formatting (i.e. font sizes, dates, format for dollars) Use colors in a meaningful manner
Reporting with TableauWhat Tableau tool should I use to create content? Use Tableau Desktop Professional as an authoring tool if you need togenerate custom SQL scripts to get at your data.– Use a version of Tableau Desktop that is consistent with the version of TableauServer (i.e. Amherst Data Pond), currently, version 2019.2.x and soon to be2019.4.x.– To speed SQL script development, use a SQL Query Builder tool. There are many(Toad, RazorSQL, SQL Server Management Studio) Use Tableau Server (i.e. Amherst Data Pond) as an authoring tool isyou are connecting to pre-established data sources.
The Amherst Data PondProjects / Sub-Projects and Groups Project – Your top-level folder Sub-Project – Think of this as folder beneath the top level folder. Users – UMass IT adds users to the Tableau Amherst Data Pond Groups - UMass IT creates groups and adds / deletes users fromgroups Project “Owners” can do the following:– Create sub-projects– Add / delete users and groups to sub-projects. Note that the users and groups need to already exist in Tableau.– Assign privileges to users and groups at a project or workbook level.
The Amherst Data PondProjects / Sub-Projects and Groups Demonstration– Look at the sub-projects and groups based security.– https://analytics.umass.edu
Research Reporting with TableauA big THANK YOU to UMass IT Thank you for your past and ongoing help– Barbara Prickett– Dan Chumbley– Krisztina Filep
Research Reporting with Tableauwith Tableau and the Amherst Data PondQUESTIONS?
Mar 25, 2020 · Research Reporting with Tableau Core Research Administration Systems & Tools Core Research Administration Systems. Goals: Provide the campus with a seamless infrastructure for research information, research data management, and electronic research administration