Transcription
Neelesh Kamkolkar, Product ManagerTableau Server 9.0 Scalability:Powering Self ServiceAnalytics at Scale
2Table of ContentsMotivation.4Background.4Executive Summary.5Tableau Server Powers Tableau Public.6Dogfooding at Cloud Scale.7New Architecture Updates.8New Minimum Hardware Requirements.9Performance Improvements.9Parallel Queries.9Query Fusion. 10Cache Server – External Query Cache. 10Horizontal Scale for Data Engine. 12Other Improvements. 12Scalability Testing Goals. 12Testing Approach & Methodology.13Virtual Machines. 14Physical Machines. 14System Saturation and Think Time. 15Little’s Law. 17Think Time. 17Workload Mix Changes. 18New Methodology. 19Test Workbook Examples.20
3Extract Characteristics.21Standardized Isolated Environment. 22Deployment Topology. 22Measurement & Reporting. 23Transaction.24Throughput.24Saturation Throughput.24Response Time.24Concurrent Users.24Results. 25Comparing Scalability of Tableau Server 9.0 with 8.3. 25Linearly Scaling Throughput.26Overall Hardware Observations.26Memory.27Disk Throughput.28Network Usage.288-Core Single Machine Comparison.29Increased Memory Requirements.31High Availability Impact. 32Applying Results.33Backgrounder Considerations.33Best Practices – DIY Scale Testing. 34TabJolt - Tooling for Scalability Testing. 34Best Practices for Optimization In The Real World. 35Summary. 36
4MotivationMany of our customers are making a strategic choice to deliver self-serviceanalytics at scale. It’s natural for our customers (IT and business alike) to wantto understand how Tableau Server scales to support all their users globally.In addition, customers want to plan ahead for capacity and hardware budgetallocations to accommodate increased adoption of Tableau.As part of our Tableau 9.0 release process, we set a goal to understand howTableau Server 9.0 compares in scalability characteristics with Tableau Server8.3. We also wanted to understand whether Tableau Server 9.0 scaled linearlyand how increased loads affected its availability.BackgroundIf you are used to traditional BI or are new to Tableau, it may help to understandsome core differences with how Tableau works.Unlike traditional BI reports that are designed and developed for a limited set ofrequirements, Tableau visualizations are built for interactivity. Users can ask anynumber of questions about their data, without having to go through a traditionalsoftware development life cycle to create new visualizations.To provide self-service analytics at scale—and help keep users in the flow ofanalysis—we have built on top of existing innovative technologies for TableauServer 9.0.With Tableau, the age-old idea of “query first, visualize next” is completelychanged. Patented technologies, including VizQL , seamlessly combine queryand visualization into one process.Users focus on their business problems and on asking questions of their data.Instead of the old way, selecting data and picking from pre-built chart types.They iteratively drag and drop dimensions, blend datasets, and createcalculations on various measures. During this process, Tableau creates clearvisualizations and seamlessly runs needed queries at the same time. This is adifferent paradigm that you should factor in as you try to understand the scalabilityof Tableau Server.If you come from a traditional BI world, you are probably used to load-testingstatic reports that meet a specific service level agreement (SLA). A static reporthas a fixed scope, fixed set of queries and is often optimized by a developer, oneat a time, over many weeks.
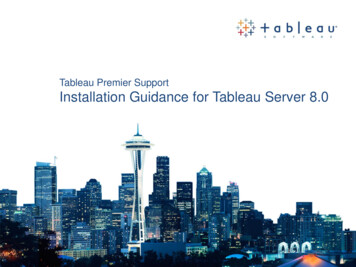
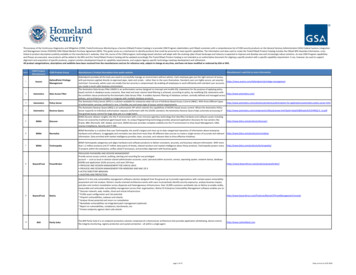
5Tableau visualizations, on the other hand, may regenerate or submit newqueries on behalf of the user’s exploratory actions. Optimizations that enablequick retrieval of data can help the user stay in the flow of analytics instead ofwaiting for the results of a query. In Tableau 9.0, we have invested significantly inperformance in addition to many other areas that enable a user to remain in theflow of analytics.This whitepaper explains how Tableau Server 9.0 performs and scales withincreasing user load across various configurations and how it compares inscalability to Tableau Server 8.3.Executive SummaryTableau 9.0 is the biggest release in the history of our company. Since November2014, very early in the 9.0 release cycle, we started performance and scalabilitytesting of new features as they were still being developed. We iterativelyincorporated design feedback for new features into the performance and loadtesting for Tableau Server 9.0.There are a number of factors that can impact performance and scalability,including workbook design, server configuration, infrastructure tuning,and networking.Based on our goals and testing methodology we demonstrated that:1. Tableau Server 9.0 is nearly linearly scalable across all scenarios tested.2. Tableau Server 9.0 showed a 200 % improvement in throughput and significantreduction in response times compared to 8.33. Tableau Server 9.0 showed increased memory and network usage comparedto 8.3With many new architectural updates in Tableau Server 9.0, we chose clustertopologies based on iterative testing for new server design and common customerscenarios. In the table below (Figure 1), each row represents a Tableau Server9.0 cluster configuration of 1 Node - 16 Cores, 2 Node - 32 Cores, and 3 Node 48 Cores.We observed that in various configurations Tableau Server 9.0 could supportthe following count of users when the system was at saturation. The table ofconcurrent users included below represents the number of end users accessingvisualizations and interacting with them concurrently, at server saturationusing Little’s Law.
6In our test scenarios, we assume that roughly 10% of the total end users inan organization or department are concurrently accessing and interactingwith visualizations.Based on our testing and workloads, we observed that Tableau Server 9.0 cansupport up to 927 total users on a 16-core single machine deployment, and scalesup to 2809 total users on a 48-core, 3-node cluster setup as shown in the table.DeploymentConfigurationTableau Server 9.0Concurrent UsersTableau Server 9.0Total Users92.75138.04280.93927138028091 Node 16 Cores2 Node 32 Cores3 Node 48 CoresFigure 1: Tableau Server 9.0 scalability summaryIn addition, we demonstrated that Tableau Server 9.0 scales nearly linearlyby adding more nodes in the cluster.While in the table above we assumed a 10% user concurrency (that is, 10% ofthe total number of people in an organization are expected to be simultaneouslyviewing or interacting with visualizations), your level of user concurrency mayvary. In some cases we have seen concurrency as low as 1%.In this whitepaper, we will start by providing some real-world examples of TableauServer scalability. We will describe new changes in architecture in TableauServer 9.0 and also our testing approach and methodologies to help you betterunderstand Tableau Server 9.0 scalability. Lastly, we will provide some guidanceon how you can apply the lessons from our experiments in your environments.Tableau Server Powers Tableau PublicTableau Server is being deployed at cloud and enterprise scales across manyorganizations. This includes several deployments at Tableau Software.Tableau Public is our free, premium cloud service that lets anyone publishinteractive data to the web. Tableau Public supports a massive number ofworkbooks, authors, and real-time views. We just recently increased the dataextract size from 1 million rows to 10 million rows and increased total storageto 10GB for every Tableau Public user.
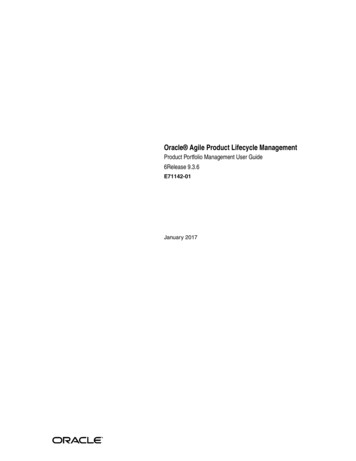
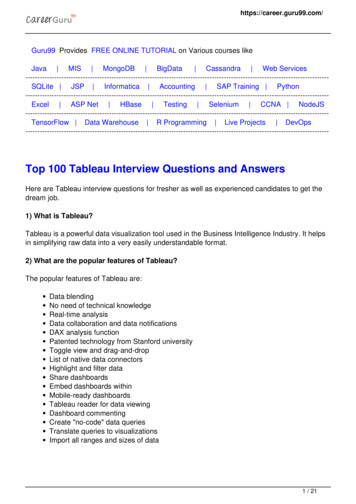
7With over 100,000 authors, over 450 million views, and 500,000 visualizations,Tableau Public plays a key role in allowing us to “use our own products.”Dogfooding at Cloud-ScaleUsing our own products to do our work on a daily basis is a core Tableaucultural value.Tableau Public gives us a cloud-scale test environment to test new versions ofTableau Server. As part of the product release process, we deploy Tableau Serverpre-release software to Tableau Public. This enables us not only to deploy ourproducts at large scale in a production, mission-critical environment, but also tounderstand, find, and fix issues related to scalability.We deployed Tableau Server 9.0 to Tableau Public in the 9.0 Beta cycle.This gave us ample opportunity to not only learn about how the new architectureis scaling in a real production situation but also helped up to find and fix issuesbefore we released the product to corporate customers.Figure 2: Point in time view of Tableau Public usageTableau Public has served more than 450 million impressions in its lifetime withover 27 million in just the last month. It also supports more than 100,000 authorswho are creating and publishing over 500,000 visualizations to Tableau Public.
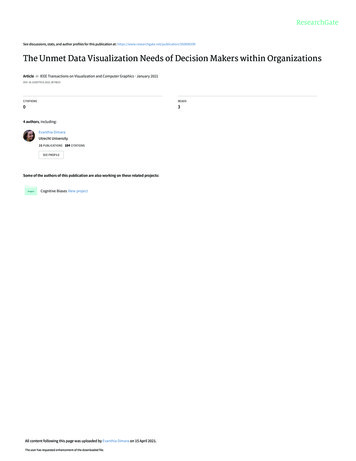
8The Tableau Public configuration is similar to a corporate deployment ofTableau Server with a few exceptions. All Tableau Public users are limited toa fixed extract size of up to 10 million rows of data. Since it’s an open, freeplatform, users on Tableau Public don’t expect the same level of security whenaccessing public data. Additionally, Tableau Public uses a custom front-endcalled Author Profiles for managing workbooks instead of the Application Server(Vizportal) process.However, Tableau Public runs tens of thousands of queries every single dayand while the data sizes are relatively small, they have a high degree of variability.Tableau Public, powered by Tableau Server 9.0, has been a strong testing groundfor the architecture updates we made in Tableau Server 9.0.New Architecture UpdatesIn Tableau Server 9.0, many of the new capabilities are rooted in a strongarchitectural foundation that extends and expands the pre-existing enterprisearchitecture of Tableau Server. We have added several new server processesto Tableau Server to support these new capabilities.To understand how to manage scalability with Tableau Server 9.0, it’s important toget familiar with these components and understand their role. For simplification inFigure 3, we have rolled up multiple server processes into a logical architecture ofhigher-level service layer groups.Gateway (Reverse rvicesRepository (Postgres)File Store*Cluster Controller*Coordination Service*BackgrounderFigure 3: Logical architecture for a single server nodeAPIServices
9Multiple server processes work together to provide services at various tiers.The gateway is the component that directs traffic to all server nodes. You can putan external load balancer in front of the server cluster (not shown in Figure 3)and have a gateway on every node for improved high availability.The user tier consists of content management, visualization, data providerand API services.The storage tier has the content Repository and a new File Store process.Structured relational data like metadata, permissions info and Tableau workbooksare in the Repository. The File Store process, is for user’s data (Tableau dataextracts) and enables data extract file redundancy acrossthe cluster.The Management tier provides a set of services that allows a server administratorto effectively manage the cluster and ensure high availability.For details on individual server process please review the administration guide.New Minimum Hardware RequirementsWith the new services on server supporting new capabilities, the minimumrequirement for the 64-bit server installer have gone up to 4 cores and 8GB RAM.While the minimum is 4 cores for installation, we do not recommend loador scale testing a single node server using a 4-core machine. A single 4-coreserver is typically for small trials and prototyping. Large enterprise deploymentsshould consider using 16-core servers for each node.Performance ImprovementsPerformance improvements help in providing better response times to end usersand promoting company-wide usage. Performance improvements have beenmade across the entire analytics flow. However, there are many variables thatimpact performance and your results may vary depending on your situation.Below, we will cover a few of the important improvements that will help guide yourdeployment for both performance and scale.Parallel QueriesParallel queries are designed to enable Tableau to use the back-end databasesmore effectively, speeding up the users interactions with a visualization.In Tableau Server 9.0 we now look at a visualization’s queries sent to the backend databases and when appropriate, de-duplicate them and issue multiplequeries simultaneously.
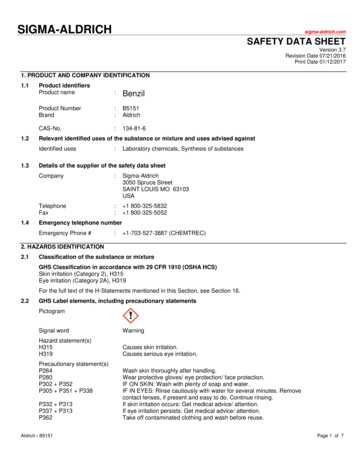
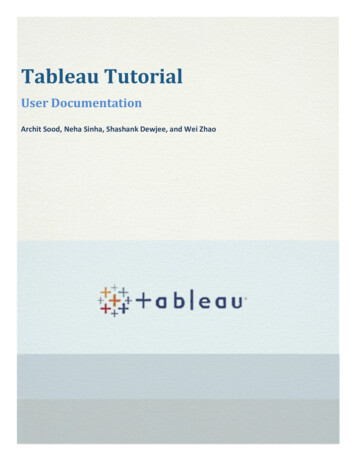
10This means that Tableau Server can have multiple connections open to yourback-end database and leverage more database resources where possible.This allows compatible databases to work on queries in parallel instead ofsequentially, resulting in significantly faster query results. Whether this capabilitybenefits you specifically depends on the how your back-end databases handleparallel work presented to them.Query FusionAs the name suggests, we take multiple separate queries from a dashboard andfuse them together where possible, reducing the number of queries sent to theback-end database. This is particularly beneficial for live connections.However, if your dashboard is not generating any queries that are combinable,this optimization will not help you.Multiple QueriesIdentify identicalqueries excludingcolumns returnedFused QueryWhen outputcolumns differ byaggregation/calcsFuse to singlequery with allcolumnsnecessaryFigure 4: Query Fusion in Tableau Server 9.0Cache Server – External Query CacheIf you have just loaded a workbook and run all the queries for the first time,in many cases, when you close and re-open the workbook the data may not havechanged in the backend.
11If this is characteristic of your data freshness and usage scenarios, then loadingthese workbooks a second time will be significantly faster for yo
Tableau Server 9.0 compares in scalability characteristics with Tableau Server 8.3. We also wanted to understand whether Tableau Server 9.0 scaled linearly and how increased loads affected its availability. Background If you are used to traditional BI or are new to Tableau, it may help to understand some core differences with how Tableau works.