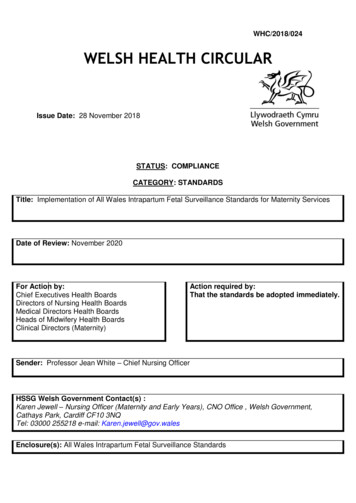
Transcription
20 May 2020Summary statistics for Wales, by region: 2020Statistical data is used widely to support regional planning across Wales. Thisseries of releases brings together in one place key data on the economy,SFR 43/2020About this releaseThis release is one of fivepopulation and infrastructure in Wales to meet user needs for data on fourWelsh regions (North Wales, Mid Wales, South West Wales, and South EastWales).statistical outputssummarising statistics onnine key topics for WalesThe aim of this release is toand four Welsh regionsprovide context to the(North Wales, Mid Wales,individual regional releasesSouth West Wales andand to highlight differencesSouth East Wales).that exist between the fourTogether these releasesregions for the nine topics inhave been prepared toquestion.inform regional planning,supporting the NationalAlthough this release is splitInfrastructureinto chapters, it is importantCommission for Wales,to remember that there isthe Nationalinteraction between theDevelopment Frameworkvarious topics and whenand the Economic Actionusing the information forPlan.planning the data should beput into context.In this releaseDifferences between parts of Wales can often be down to the demographic orPopulationsocio-economic characteristics of a region. For example, levels of economicHealth10Employment12of economic output per head.Transport18Demographic trends vary across Wales in terms of age distribution andEnvironment22natural change, leading to differences in future population and housing trendsProsperity27Digital Infrastructure31Housing35of the UK means our economic performance is closely linked to UK and globalCulture & Heritage37trends, and in many border areas commuting levels will impact on someQuality Information39activity are influenced more by qualification levels than where a person lives.An older, less economically active, population in an area will influence levelsacross and within the regions.Geographical context is also important, for example in considering data oninfrastructure, either physical or digital. The interconnectedness with the rest2measures of economic output.Statistician: Geraint Turner 0300 025 5050 stats.info.desk@gov.walesEnquiries from the press: 0300 025 8099Public enquiries : 0300 025 5050.This report is also available in WelshTwitter: @StatisticsWales
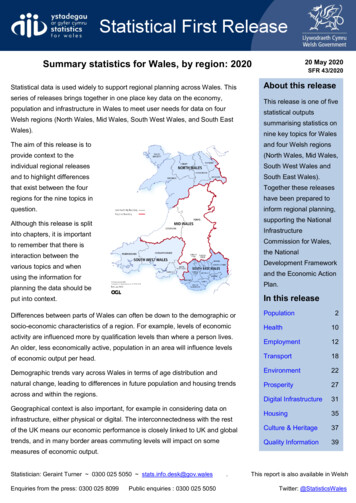
PopulationFigure 1: Population, by local authority, 2018Source: Mid-year population estimates, Office for National StatisticsIn 2018, Wales was home to over 3,138,000 residents. Almost half of these were concentrated inSouth East Wales, which represents only 14 per cent of Wales’ land area.The most populated authority in Wales is, by some way, Cardiff, with an estimated 364,000residents in 2018, representing nearly 24 per cent of the population of its region, South EastWales. This region also included the authority with the smallest population in Wales, Merthyr Tydfil,with a population of around 60,000.Note: These reports were produced ahead of the publication of provisional 2019 mid-yearestimates on 6 May 2020.2
Figure 2: Population density (persons per square kilometre), by local authority, 2018Source: Mid-year population estimates, Office for National Statistics; Standard areameasurements, Office for National StatisticsIn 2018, Wales had an average population density of 151.4 persons per square kilometre; this is a3.6 per cent increase since 2008. South East Wales had by far the highest population density ofthe four regions, at 545.5 persons per square kilometre. This can largely be attributed to Cardiff,which was the most densely populated authority in Wales at 2,585.2 persons per square kilometre.The region also saw the most growth in population density over the last decade, up 5.1 per cent on2008.Mid Wales was the least densely populated of the four regions, with only 29.5 persons to eachsquare kilometre. The region contained the least densely populated local authority in Wales, whichwas Powys, at 25.6 persons per square kilometre. Mid Wales was the only region with a fall inpopulation density in the 2008-2018 period, at 1.2 per cent.Note: These reports were produced ahead of the publication of provisional 2019 mid-yearestimates on 6 May 2020.3
Figure 3: Settlements in Wales by rural-urban classification, 2011Source: 2011 Census, National StatisticsWelsh Government analysis of 2011 Census data (unpublished) shows that while there are fairlyeven numbers of people living in each category of settlement in Wales (as defined by population),the distribution of these different categories of settlements across Wales is not even.As well as the settlement’s population, the National Statistics rural-urban classification considerswhether settlements are situated in a “less sparse” or “sparsest” context. The distribution of Welshsettlements falling under these two categories is shown on the map.At a regional level, the highest number and proportion of the population living in less sparsesettlements with 25,000 or more residents was in South East Wales. Mid Wales had the highestnumber and proportion of residents living in settlements classified "sparsest". Backgroundinformation on this work can be found in the Best fit of Lower Super Output Layers to built up areasand in the Rural Wales: definitions and how to choose them releases.Note: These reports were produced ahead of the publication of provisional 2019 mid-yearestimates on 6 May 2020.4
Figure 4: Population distribution in Wales by age and gender, 2018Aged 90 and overAged 85Aged 80Aged 75Aged 70Aged 65Aged 60Aged 55Aged 50Aged 45Aged 40MaleAged 35FemaleAged 30Aged 25Aged 20Aged 15Aged 10Aged 5Aged urce: Mid-year population estimates, Office for National StatisticsWales as a whole has an ageing population. Between 1998 and 2018, the proportion of thepopulation aged 65 and over has increased from 17.4 per cent to 20.8 per cent, while theproportion of the population aged 15 and under has fallen from 20.6 per cent to 17.9 per cent. Ofthe four regions, South East Wales has the most even population distribution across its agegroups. Across Wales, for each year of age between 0 and 30, there are more males than females.However, males are outnumbered by females at almost every year of age after the age of 30.Note: These reports were produced ahead of the publication of provisional 2019 mid-yearestimates on 6 May 2020.5
Figure 5: Percentage population change by UK country, hernIrelandEngland0WalesScotlandSource: Mid-year population estimates, Office for National StatisticsWales’ population grew by 8.2 per cent in the period 1998-2018. This was lower than in Englandand in Northern Ireland, but higher than in Scotland. When considering the 2008-2018 period,however, the percentage change in population in Wales was the lowest in the UK, at 3.7 per cent.Within Wales, the South East Wales region saw the largest population growth between 1998 and2018, at 9.6 per cent. The lowest was Mid Wales, at 3.8 per cent. Over the 2008-2018 period,Cardiff’s population grew more than any other local authority in Wales (9.5 per cent). Ceredigion’spopulation, however, contracted by 2.6 per cent over the same period. This was the greatestpopulation contraction in Wales.Note: These reports were produced ahead of the publication of provisional 2019 mid-yearestimates on 6 May 2020.6
Figure 6: Components of population change in Wales over time25,000Natural change duringperiodChange (count)20,000Net migration and otherchanges during period15,00010,0005,00001991 to 19921992 to 19931993 to 19941994 to 19951995 to 19961996 to 19971997 to 19981998 to 19991999 to 20002000 to 20012001 to 20022002 to 20032003 to 20042004 to 20052005 to 20062006 to 20072007 to 20082008 to 20092009 to 20102010 to 20112011 to 20122012 to 20132013 to 20142014 to 20152015 to 20162016 to 20172017 to 2018-5,000Source: Mid-year population estimates, Office for National StatisticsData showing components of population change across Wales shows that more population changeis attributable to net migration and other changes than to natural change (births and deaths). Since1991, net migration and other changes have been strictly positive, while natural change hasfluctuated between positive and negative effects. Looking at local authorities, Carmarthenshire sawthe largest net change in population due to migration and other changes during the 2017-18period, while Newport saw the largest overall net change in population over the same period.Population change due to net migration and other changes was positive in all authorities during thisperiod. Cardiff was the local authority with the highest level of natural change in 2017-18 while 16of the 22 authorities experienced negative natural change, meaning deaths were higher thanbirths. The highest level of negative natural change was in Carmarthenshire.Note: These reports were produced ahead of the publication of provisional 2019 mid-yearestimates on 6 May 2020.7
Figure 7: Stated Welsh-speaking ability of persons aged three and over by region,20111,600,000Not able to speak Welsh1,400,000Able to speak 200,0000South EastWalesNorth WalesSouth WestWalesMid WalesSource: 2011 Census, Office for National StatisticsAccording to census data, there were 562,016 Welsh-speakers aged three and over in Wales in2011. 27 per cent of Welsh speakers were based in South East Wales, 36 per cent in North Wales,10 per cent in Mid Wales and 26 per cent in South West Wales. However, the distribution of Welshspeakers across the regions was less even when considered as a proportion of the population(Figure 10).The census is the key source of information about the number of people who can speak Welsh.The National Survey for Wales (NSW) and the Annual Population Survey (APS) also collectinformation about Welsh speaking ability and frequency of use (the NSW only collects informationfor those aged 16 or over while the APS collects information for those aged three and over like thecensus). Estimates of Welsh language ability from household surveys are historically higher thanthose produced by the census and it is not known exactly why this is the case. It’s likely thatdifferences in how these surveys and the census are carried out affect the estimates. Moreinformation can be found in a blog post by the Chief Statistician discussing Welsh language data.Data from the Annual Population Survey shows that in the year ending September 2019, anestimated 29.0 per cent of people aged three and over across Wales reported being able to speakWelsh. This represented an increase of approximately 3.4 percentage points on the data for theyear ending September 2009. The local authority with the highest proportion of Welsh speakerswas Gwynedd, where around 75.6 per cent of residents aged three and over reported being able tospeak Welsh in 2019.8
Figure 8: Student enrolments to Higher Education Institutions in Wales by region,2018-20197,8458,625South East Wales17,500South West WalesNorth Wales66,195Mid WalesThe Open University31,885Source: Higher education student record, Higher Education Statistics AgencyIn 2018-19, there were 132,210 enrolments on Higher Education (HE) courses in Wales. Half of allenrolments were in South East Wales. Cardiff University saw the highest number of HEenrolments, representing 25.1 per cent of total enrolments. Mid Wales was the region with thelowest number of enrolments for HE courses in its institution as this considered only AberystwythUniversity (7,845 enrolments).In addition to these figures, there are 165 enrolments in NPTC group, but given that this provider isspread across multiple college campuses, it is not possible to split these between South West andMid Wales. The NPTC group is a further education college which was formed following the mergerof Neath Port Talbot College and Coleg Powys on 1 August 2013.9
HealthFigure 9: Healthy life expectancy in Wales as a proportion of life expectancy, bygender, 3020100Healthy Life ExpectancyLife ExpectancySource: Health state life expectancies, UK Statistical bulletins, Office for National StatisticsLife expectancy is a measure of how long, on average, people can expect to live using estimates ofthe population and the number of deaths. Healthy life expectancy estimates the number of yearsspent in very good or good general health.ONS data shows that across Wales, females born in 2016-18 were expected on average to livearound 4 years longer than males. For females, life expectancy was 82.3 years, for males it was78.3 years. The gender gap narrows when considering healthy life expectancy in Wales, withfemales and males spending on average 62.0 and 61.4 years respectively in good health (that is75.4 per cent and 78.4 per cent of their respective life expectancies).Life expectancy figures for Wales were lower than the UK averages over this period (82.9 years forfemales and 79.3 years for males).For local authorities in Wales, life expectancy at birth for males was highest in Monmouthshire andlowest in Blaenau Gwent – a difference of 4.5 years. For females, it was highest in Monmouthshireand Ceredigion and lowest in Merthyr Tydfil and Blaenau Gwent, a difference of 3.6 years. Healthylife expectancy at birth for males was highest in Monmouthshire and lowest in Blaenau Gwent – adifference of 10.9 years. For females, it was highest in Powys and lowest in Caerphilly – adifference of 12.5 years.10
Figure 10: Adults with fewer than 2 healthy lifestyle behaviours, by local authority,2017-18 and 2018-19* combined (age rcentage12Wales14141516420*The 2017-18 and 2018-19 periods have been combined for data quality purposesSource: National Survey for WalesThe 5 healthy lifestyle behaviours are: not smoking, average weekly alcohol consumption 14 unitsor lower, eating at least 5 portions fruit & veg the previous day, having a healthy body mass index,and being physically active at least 150 minutes the previous week.Across Wales in 2017-18 and 2018-19 combined, 10 per cent of adults reported fewer than 2 of the5 healthy lifestyle behaviours. There was no significant difference between the 4 regions. At localauthority level, the figures ranged from 6 per cent in Monmouthshire to 15 per cent in MerthyrTydfil.11
EmploymentSource: Annual Population Survey, Office for National Statistics. Data relates to year ending 30September 2019Figure 11: Employment rate in Wales, 01520162017201820190Notes:Data for 1999 to 2003 is year ending 28 February. Data for 2004 is year ending 31 December2004. Data from 2005 onwards is year ending 30 September.Source: Annual Population SurveyThe employment level is the total number of people (aged 16 ) that are in employment and theemployment rate is the percentage of the population (aged 16-64) that is in employment. In Wales,in the year ending 30 September 2019, the employment rate was 73.5 per cent, with anemployment level of around 1.47 million people. This rate increased by 6.4 percentage points since2009 and has grown faster than the UK rate since 2001, although it is still lower than the UK rate of75.6 per cent. At a regional level, Mid Wales, South West Wales and South East Wales had ratesbelow both the UK and the Welsh employment rates, while North Wales exceeded both.12
The unemployment level is the total number of people who are unemployed and the unemploymentrate is the percentage of the economically active population who are unemployed (using theInternational Labour Organisation’s (ILO) definition of unemployment). In Wales, for the yearending 30 September 2019, the unemployment rate was 4.1 per cent, which is an unemploymentlevel of 63,100 people. This rate was down 4.0 percentage points on the unemployment rate tenyears previously, but is higher than the UK unemployment rate of 3.9 per cent. The highestunemployment rate was in South West Wales, and the lowest in Mid Wales.The economic inactivity rate is the percentage of the population who are not working and notseeking nor available to work. Economically inactive people include people looking after the familyand / or home, retirees and people with a sickness or disability. Across Wales, the economicinactivity rate among 16-64 year-olds (excluding students) was 19.7 per cent, which corresponds toan economic inactivity level of 342,700 people. This rate was down 3.9 percentage points on tenyears previously. The economic inactivity rate for Wales and all four regions is higher than the UKrate, which was 17.4 per cent for the year ending 30 September 2019.More information on regional economic statistics can be found in the Welsh Government’s regionaleconomic and labour market profiles.Figure 12: Workforce employment by region, 201896,800South East Wales311,400725,500North WalesSouth West WalesMid Wales318,400Source: Annual Population Survey, Office for National Statistics; Business Register EmploymentSurvey (BRES), Office for National StatisticsAcross Wales, half of workplace employment (or total jobs) are based in South East Wales, thoughit also has the greatest range of workplace employment levels, including the local authorities withboth the highest and the lowest numbers of jobs in Wales.Across Wales, over 50 per cent of jobs fell under 2 broad sectors: Public administration, defence,education and health; and Wholesale, retail, transport, hotels and food. Real estate activitiesrepresented the smallest sector across Wales.13
Figure 13: Change in workplace employment in Wales by sector (count), 2008-2018148,000225,000Other service activities18,100Real estate activities9,900Information and communication3,800Agriculture, forestry and fishing2,000Finance and insurance 6,500-20,000 -10,000010,000 20,000 30,000 40,000 50,000 60,000CountKey1 Professional, scientific and technical activities; administrative and support service activities2 Public administration, defence, education and health3 Wholesale, retail, transport, hotels and foodSource: Annual Population Survey, Office for National Statistics; Business Register EmploymentSurvey (BRES), Office for National StatisticsThe fastest-growing sectors between 2008 and 2018 were Professional, scientific and technicalservices, administrative and support duties; and Public administration, defence, education andhealth. Professional, scientific and technical services, administrative and support duties held thetop position for workplace employment growth as a count between 2008 and 2018. The smallest ofthe sectors across Wales, real estate activities, saw the largest increase in employment between2008 and 2018, in percentage terms.Size analysis of Welsh businesses data shows that in 2019, across Wales, the vast majority ofenterprises had fewer than 10 employees. Around 64 per cent of large enterprises fell under 2sectors: Wholesale, retail, transport, hotels, food and communication; and Financial and businessservices. The sector with the highest proportion of enterprises in the micro size-band wasAgriculture, Forestry and Fishing.14
Figure 14: Change in local authority population due to people commuting in and outfor work, 2018Source: Annual Population Survey, Office for National StatisticsFor Wales as a whole, there was a net worker population change of -47,700 workers, indicatingthat more people commute out of Wales than in.The net worker population change was negative in 12 of the 22 local authorities, meaning that inthese authorities, more people commute out of the authority to go to work than commute in fromother authorities. This includes commuting across the Welsh border into areas such as Bristol,Shropshire, Herefordshire, and Cheshire West and Chester, among others. The 2 most highlypopulated authorities in Wales were also those with the highest net levels of worker populationchange.All four Welsh regions include at least 1 local authority with more workers commuting in than out,though this data does not show exactly where these workers have commuted from. Please notethat figures, including data for the regions have been calculated from published rounded figures.15
Figure 15: Average distance travelled to work (km) by workers aged 16-74 in 2011,by local authority of 61520.5Distance (km)20Wales50Source: 2011 Census, Office for National StatisticsCensus data shows that on average, working residents aged 16-74 in Isle of Anglesey travelledfurther than workers of any other local authority in Wales to get to work. Cardiff workers, onaverage, had the shortest commutes in Wales in terms of distance.16
Figure 16: Highest qualification level of adults aged 18-64 in Wales, 20112012201320142015201620172018Qualified to NQF level 2 or aboveQualified to NQF level 3 or aboveQualified to NQF level 4 or aboveNo qualifications*All data for year ending 31 DecemberSource: Annual Population Survey, Office for National StatisticsBetween 2008 and 2018, the proportion of adults aged 18-64 across Wales with no qualificationshas decreased from 15.2 per cent to 8.4 per cent. A decrease was seen in each of the localauthorities in Wales, except in Flintshire, which saw an increase of one percentage point.Meanwhile, the proportion of those qualified to NQF level 2 or above has increased from 68.9 percent to 78.9 per cent. The greatest change was in Caerphilly, which saw an increase of 16.5percentage points. In 2018, 37.8 per cent of people in Wales had achieved some form of highereducation-level qualification (NQF level 4 or above). Most of these were qualified to NQF levels 46, and this was the grouping with the highest proportion of the population in it for the 2018 period.17
TransportFigure 17: Transport infrastructure in WalesSource: Ordnance SurveyThere are three motorways in Wales; these are the A48(M), M4 and the M48.Total freight traffic at ports in Wales fell by 4.8 per cent in 2018 to 49.2 million tonnes (Mt), itslowest level since comparable records began in 1976. The three largest ports in Wales meetspecialised shipping needs: Milford Haven handles mainly crude oil, oil products and liquefied natural gas Port Talbot imports iron ore and coal mostly for the adjacent steelworks Holyhead is the main port for freight and sea passenger transport with the Irish Republic.18
Figure 18: Frequency of walking for active travel purposes among adults aged 16 in Wales (a), (b)Every daySeveral times a weekOnce or twice a 2016-172017-182018-19(a) The National Survey was not carried out in 2015-16(b) The survey question changed in 2017-18 and the walking time was increased from 5 minutes to10 minutes. This means that it is not possible to draw any comparisons with previous years.Source: National Survey for WalesData from the National Survey for Wales shows that across Wales in 2018-19, 57 per cent ofadults walked more than once a week for active travel purposes, and 6 per cent of all adults aged16 and over cycled at least once a week for active travel purposes. 70 per cent of people in urbanareas walked for more than 10 minutes as a means of transport at least once a month, comparedwith 56 per cent of people in rural areas. People in urban areas were also more likely to walk morefrequently, with 28 per cent walking every day compared with 17 per cent in rural areas. This couldbe due to residents of urban areas having more destinations within walking distance than thoseliving in rural areas.Meanwhile, active travel data taken from the 2018-19 National Survey for Wales shows that 45 percent of children travelled to primary school either by walking or by bike, compared to 33 per cent ofchildren travelling to secondary school. However, although primary school pupils were more likelythan secondary school pupils to walk or cycle to school, they were also more likely to travel toschool by car. This was due to a much higher proportion of secondary school children using aschool bus relative to primary school children.19
Figure 19: 20 busiest rail stations in Wales by station entries/exits, 2017-18Station entries/exits (millions)1412108642Merthyr TydfilPort Talbot ParkwayRhylBarryRadyrAberdarePenarthBangor (Gwynedd)TrefforestBarry IslandCaerphillyNeathPontypriddCathaysCardiff BayBridgendSwanseaNewport (Gwent)Cardiff Queen StreetCardiff Central0Source: WG analysis of estimates of station usage from the Office of Rail and RoadWelsh rail station use is concentrated around commuter lines to Cardiff; 15 of the 20 busiest railstations in Wales by station entries/exits in 2017-18 were in South East Wales. More than halfwere on the Valleys Network line, accounting for 18 per cent of total station entries/exits in Walesduring this period (this excludes entries/exits for Cardiff Central and Cardiff Queen Street Stations).Cardiff Central alone accounted for 25 per cent of all station entries/exits in Wales in 2017-18.20
Figure 20: Net change in rail journeys by region, 2007-08 to 2017-1863,0456,777558,0034,454,478South East WalesSouth West WalesMid WalesNorth WalesSource: National Rail Trends, Regional User Profiles, Office of Rail and RoadAcross Wales, there were 52.5 million rail station entries/exits in 2017-18, accounting for 1.8 percent of the UK total. Wales’ rail station usage grew by 1.7 per cent in 2017-18 relative to theprevious year, this continued a positive trend in rail station entries/exits since the beginning of thedata series in 2004-05).Looking at the longer term, data from the Office of Rail and Road shows that the number of trainjourneys made in Wales increased by 30.0 per cent between 2007-08 and 2017-18. The majority ofthis increase was in journeys starting and/or finishing in South East Wales.21
EnvironmentFigure 21: Heritage Coast and Special Protection Areas in WalesSource: Natural Resources WalesHeritage Coasts were set up to protect coastlines from insensitive developments. They occupyabout a third of the Welsh coastline, 500 km (300 miles).There are 21 Special Protection Areas (SPAs) entirely or partially located in Wales. These exist toconserve the habitats of rare or vulnerable bird species (of which there are 48 in the UK), as wellas some migratory species which visit Welsh shores regularly.22
Figure 22: Designated Natural Environment in WalesSource: Natural Resources WalesWales is home to 3 National Parks: Snowdonia; Brecon Beacons; and Pembrokeshire Coast. 5areas have also been designated Areas of Outstanding Natural Beauty (AONBs): Gower; part ofthe Wye Valley; the Clwydian Range and Dee Valley; Anglesey; and Llyn Peninsula. There arealso 1,063 Sites of Special Scientific Interest (SSSIs) in Wales.23
Figure 23: Nitrogen dioxide (NO2) concentration in Wales over time16Concentration 4201520162017Source: Air Concentration, Department for Environment, Food and Rural Affairs; Small areapopulation estimates (SAPE), Office for National Statistics; Geographical information, WelshGovernmentAir pollution levels are gradually decreasing in Wales, with the average observed nitrogen dioxideconcentration in Wales decreasing from 14 µg/m3 in 2007 to 9 µg/m3 in 2017. This varied acrossWales. Overall, more populous local authorities had higher observed concentrations of nitrogendioxide than less populous authorities. Cardiff had the highest concentration (17 µg/m3), with thelowest observed concentration of 4 µg/m3 in Ceredigion and Powys. Newport observed thegreatest change in nitrogen dioxide concentrations between 2007 and 2017, decreasing by 8µg/m3 over this period.Renewable energy generation capacity has been increasing across Wales in recent years, with acapacity of 3,864 megawatts (MW) of low-carbon energy in 2018 through over 68,700 projects. 25per cent of this capacity was in South West Wales, 21 per cent in South East Wales, 18 per cent inNorth Wales, and 16 per cent in Mid Wales. The remaining 19 per cent was offshore. 86 per centof low-carbon energy projects in Wales were for solar energy (photovoltaic or thermal).24
Figure 24: Municipal waste treatment in Wales7060Percentage50Municipal waste that isreused/recycled/composted40Municipal waste that is sentto 2017-182018-19Source: WasteDataFlow, Natural Resources WalesBetween 2012-13 and 2016-17, household reuse, recycling and composting rates increased inWales, while the percentage of municipal waste sent to landfill decreased. These proportions haveremained fairly stable during the last three years.In 2018-19, the amount of local authority municipal waste that was reused, recycled or compostedwas 63 per cent in Wales. This was 11 percentage points higher than in 2012-13.Meanwhile, the amount of local authority municipal waste sent to landfill was 10 per cent in Wales.This was more than in 2016-17, but the trend shows a decrease relative to the 41 per cent raterecorded in 2012-13, the earliest year for which directly comparable data is available.25
Figure 25: Annual residual household waste produced per person (kg), by localauthority, 2018-19Source: WasteDataFlow, Natural Resources WalesIn 2018-19, the average person in Wales generated 180kg of residual household waste (wastegenerated that is not included in separate recycling or composting collection rounds), compared to217kg in 2012-13. This represents a decrease of 17.1 per cent.26
ProsperityFigure 26: GVA per head in Wales and the UK ( ),
activity are influenced more by qualification levels than where a person lives. An older, less economically active, population in an area will influence levels of economic output per head. Demographic trends vary across Wales in terms of age distribution and natural change, leading to differences