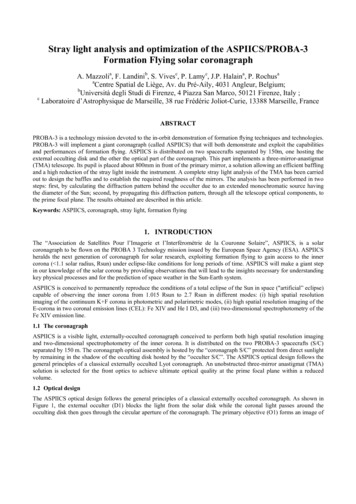
Transcription
Ghost and Stray Light Analysisusing TracePro February 2012 Webinar
Moderator:Andy KnightTechnical Sales ManagerLambda Research CorporationPresenter:Michael GauvinVice President of SalesLambda Research Corporation
Format A 25-30 minute presentation followed by a 1015 minute question and answer session Please submit your questions anytime usingQuestion box in the GoToWebinar control panel
Ghost and Stray Light Analysisusing TracePro February 2012 Webinar
In this webinar you will: Learn how to use TracePro to analyze ghost paths Learn how to understand and use importance sampling forscatter analysis Learn how to understand and use tools to analyze straylight issues
Current TracePro Release TracePro 7.1.2 Can be downloaded by anyone with acurrent Maintenance and Support Agreement www.lambdares.com
Raytracing for Optical Simulation: TheApproach Ignore all optical constructs– Make no assumptions Create a “realistic” virtual 3D model? Apply surface and materialproperties to the model Launch light into the model Let the model determinewhere the light goes(calculate surface order)7
Optical Simulation (cont.)5 things can happen to light when it hits a surface RefractReflectAbsorbForward ScatterBackward ScatterAnd it happens at each surface (not to mention volume effects)TracePro keeps track of where all this flux is going and reports it!8
Material Property DefinitionsΦiIncident Medium, niIncidentLight RayMediaBoundaryRefractedLight RayRefractionMedia, nrΦrSnell’s Law: The formula used to define when light rays are incident to a boundary between twomediums, i.e. plastic or glass and air. The light rays are refracted at this boundary and this shows thisinteraction. For an angle of incidence θi in a material with an index of refraction ni, the angle ofrefraction θr in a material nr can be defined as nisinθi nrsinθr TracePro automatically used Snell’s lawwhen this is a material present on any object that a ray intersects.
Surface Properties InfoFresnel Loss: Occurs when light rays cross from one refractive boundary toanother. There is a loss associated with this transition and it is defined as: ni nf n i n f 2Where ni and nf are as shown in the Snell’s law Powerpoint slide. For plastic toair and glass to air, the Fresnel loss at visible wavelengths is about 4 percent.The Fresnel loss is much greater in the infrared wavelengths!In TracePro, Fresnel loss is automatically calculated at a surface when theobject has a material property but no surface property (surface property isshown as none in the system tree)
Surface PropertiesTotal Internal Reflection (TIR): TIR occurs when light passes from a mediumof high refractive index into a material of lower refractive indices. If the angleof incidence is greater than the critical angle then the light will be reflected.RefractedLight RayAirAirIncidentLight RaysRays start in Medium, niΦc critical angleMediaBoundaryCritical RayΦcTotalInternallyReflected RayThe critical angle is defined where the sin θf (90 ) 1. This then reduces Snell’slaw to: Sin θc nf/ni where nf 1 (air). The critical angle is usually 42 degreesfor plastics and glass in the visible wavelengths.
Generalized Monte-Carlo RayTracing Non-deterministic computational algorithm– The ray trace has multiple choice points Each choice is determined by pseudo-random sampling ofprobability A good sampling requires many rays Rays can be split at choice points (determined by user)– Splitting (or not) does not affect accuracy of results butdoes affect ray-trace time, i.e. convergence to accurateresultLow probability paths my be under-sampled with traditional MonteCarlo methods– Importance Sampling methods increase sampling in low-probabilitypaths12
Ghost Analysis
Definition of GhostsGhost images are out-of-focus images ofbright sources. Light must reflect an even numberof times from lens surfaces. If the source is smalleach ghost looks like the aperture stop. If theghost is focused on the image plane, the ghostlooks like the source
A Complex Ray Trace Example with threshold resetDecreasing the Flux Threshold in Raytrace Options increases the number of ghosts due tofresnel losses. For this re-evaluation of the system, the flux threshold was set to .0001.
A Complex Ray Trace with ray paths shownTracePro 7.1 has the ability to display a path sort table. In this table we can select paths that we want display in thesystem view using the Analysis Display Selected Paths options as shown. For this example we have selected the firstand second ray paths which are shown by the high intensity red rays for the first path and blue rays for the second.
Cooke Triplet ExampleAnalyzing a cooke triple with the flux threshold set to .001 we can create quite a fewghost paths. The Ray Sorting capability is quite helpful when trying to see these ghosts.
Cooke Triplet ExampleUsing the Analysis Display Selected Paths option allows the user to see this 2nd largestcontributing path. This is important to determine if the paths is right on top of the signal ordiffused out over the entire detector. The irradiance map works in conjunction with the raypath sorting and shows only the contribution from this second path.
Cooke Triplet ExampleIf we coat the lenses with a 3 layer AR coating, you can see that all the ghosts no longer havepaths to the detector. There is only one ray path and the signal is perfectly focused on thedetector.
The Monte Carlo Method, Ray Splitting andImportance Sampling
Monte Carlo Ray-tracing andSampling A crude Monte Carlo calculation is the simplest form of a probability experiment– Perform an experiment N times, count the number of times n that the event occurs– An estimate of the probability is: pe n / N– We can never get an exact value of pe, but we can make the uncertainty in pe arbitrarilysmall by increasing N.p (1 p ) The absolute uncertainty in pe is: σab N(1 p ) (where p denotes the true The relative uncertainty in pe is: σrel pNprobability)– Hence, the accuracy of the result is inversely proportional to the square root of thenumber of trials (enough trials will always lead to the correct answer)On a higher level, Monte Carlo is a technique of numerical integration for complicatedmultiple integrals that cannot be done by more conventional numerical methods– An integral such as . g(x1, x2 ,., xL )dx1dx2.dxL can be estimated by sampling thevariables xi, computing g for this set of samples, and repeating this process N times,summing the terms to obtain the estimate (histogram method, trapezoidal rule,Simpson’s rule, 9etc.)
Variance reduction Variance reduction techniques are used to reducethe variance or uncertainty in the result of a MonteCarlo calculation after a given number of trials.Conversely, the number of trials needed to obtaina given uncertainty can be reduced. Splitting is a variance reduction technique used inMonte Carlo simulation. Ray splitting is used inTracePro. Importance sampling is a second commonly usedmethod for variance reduction.
Ray Splitting Ray splitting is a technique in which a ray that strikes asurface can be split into several component rays, namelyabsorbed, specularly reflected, reflectively scattered,specularly transmitted, and transmissively scattered. The flux of the incident ray will also be split, with a fraction ofthe incident flux assigned to each component ray accordingto the properties of the surface. The process of splitting is repeated at each surface intercept,so that a tree-like structure of rays results. This process tremendously improves sampling in mostcases, with a tolerable slowing of the raytrace.
Ray Splittingincoming ray
Importance Sampling Importance Sampling is used to improve the sampling ofrandom events without dramatically increasing the number ofrays started. Uses the scattering distribution function as a probability densityto apportion a fraction of the scattered ray flux into a desireddirection. May be used for emitted, scattered and diffracted rays only, onsurface sources, scattering surfaces, diffracting surfaces andbulk scattering objects. Apply to object(s) for Bulk Scatter. Apply to surface(s) for all others.
Importance Sampling
Importance Sampled FluxΦ imp.samp. Φ inc. BSDF cosθ dΩ ΩΦ random Φ inc. TS Φ imp.samp.TS BSDF cosθ dΩhemisphere
Importance Sampling Examplerandom raysspecular raysimportancesampledrays
Importance Sampling SourcesSource Example
Importance Sampling ScatterSurface Example Flux thresholdtypically set very low
A World without ImportanceSampling Suppose lens BTDF isA 2e-5, B 1e-6, g 2. Lens scatters at angle of 30º toget to detector, sop 2 f s cos θ Ωθ 30º β-β0 0.5 Ω (0.002 radian)2p2 2.77 x 10⁻¹⁰cos θ 0.87fs 8 x 10⁻⁵ Ω 4 x 10⁻⁶
A World without ImportanceSampling Total probability is ptotal p1p2 3.46 x 10⁻¹¹ You must start 3 x 10¹⁰ rays to get 50% chance ofone ray hitting the detector! Solution: define importance sampling target forlens surface. Probability p2 increases to 1.0, totalprobability is 1/8. You can also define a target for sampling from thebaffle to the lens, but this is not always necessary.
Stray Light and BSDFUsed Lw/m2-srBSDFf1/sr
Forms of Stray LightStraight ShotsWhere light from a bright source can bypass the intended path and finds a straight specularpath to the focal plane.Ghost ImagesGhost images are out-of-focus images of bright sources. Light must reflect an even numberof times from lens surfaces. If the source is small each ghost looks like the aperture stop. Ifthe ghost is focused on the image plane, the ghost looks like the sourceSingly-Scattered lightOccurs when a stray light source illuminates the optics or some hardware that the focalplane sees. Some portion of the light will scatter into the field of view and become straylight. Once in the field of view, there is no way to eliminate it.Multi-Scattered LightEven when stray light sources do not illuminate the optics directly, they can still scatter fromstructure or baffles and then illuminate the optics. While this is always smaller than directscatter it may be large enough to be of concern.Edge DiffractionWhen the ratio of aperture diameter to wavelength is relatively small (10 4 or smaller), edgediffraction from the aperture stop from out-of-field sources can be a significant source ofstray light.Self-Emission of Infrared SystemsThermal imaging systems can have stray light caused by emission from the instrument itself.The peak of the blackbody emission curve for room temperature is at about 10µm. Thermalimagers typically subtract the background to enhance contrast, but this is best performedwhen the background is uniform.Combinations Of The Above
Four Methods to Reduce Stray LightMove ItMoving the stray light by tilting a lens, moving the detector, or angling the offending stray lightsurface is the best way of getting stray light out of a system. You may need to add a beamdump to completely get rid of the problem.Block itEven when stray light sources do not illuminate the optics directly, they can still scatter fromstructure or baffles and then illuminate the optics. Using baffles is a great way to stop out of fieldsources from sending light directly to the detection device.Paint ItUsually occurs when a shiny object is illuminated by a stray light source. Coating the offendingshiny object with black paint usually reduces this stray light quite substantially but notcompletely to 0. For instance, black anodized aluminum can be 35% reflective but there arebetter black paints available several are in the 3 percent range but there can be problems without gassing and degradation over time with these coatings. Some portion of the light will alwaysscatter into the field of view and become stray light even with the best of coatings. Set atolerable specificationCoat ItEspecially important to get rid of ghost images - Ghost images are out-of-focus images ofbright sources. Light must reflect an even number of times from lens surfaces. If the source issmall each ghost looks like the aperture stop. If the ghost is focused on the image plane, theghost looks like the source. To get rid of ghost images we coat the lenses with anti-reflectivecoatings to reduce ghosts35
Importance Sampling for Stray Light Importance Sampling targets should be defined for each optical surface. The targetshould coincide with the real or virtual image as seen from that surface.The Auto Importance Sampling Setup feature will define targets for all optical surfaces.Importance sampling targets can always be added manually. Each surface can have anunlimited number of importance sampling targets.You may or may not need importance sampling on non-optical surfaces (lens barrels,baffle vanes, etc.).If you do define importance sampling targets for non-optical surfaces, surfaces that can“see” an image should have a target at that image. Surfaces that cannot see an imageshould have an importance sampling target at the next optical surface in the opticaltrain.You should define importance sampling targets for diffracting surfaces, just like anoptical surface.If only a few randomly scattered (non-importance-sampled) rays hit the image with highflux, causing hot spots, this usually means more importance sampling is needed.It is possible to overdo importance sampling, slowing the raytrace. A goal is to getabout one ray on the image surface for each starting ray. Getting within an order ofmagnitude of this goal (either way) is OK. Modeling of bulk scattering will make thisgoal hard to achieve.
BSDF vs. Scattered Intensity BSDF is a generic term for measured scattering of light. There arethree specific varieties of BSDF– BRDF(Bidirectional Reflectance Distribution Function)– BTDF(Bidirectional Transmittance Distribution Function)– BDDF(Bidirectional Diffraction Distribution Function)Scattered Intensity or “Cosine Corrected BSDF”– In the old days, people measured the scattering properties of asurface by measuring the scattered intensity (w/sr) normalizedto the incident power (w). This differs from the BSDF by a factorof cosθ.
Typical BSDFs Polished surfaces– BSDF from microroughness is proportional to PowerSpectral Density (PSD) of roughness– Values of g from 1.5 to 3.5, but 2 to 3 is more common– B is small, 1e-6 to 1e-10, depending on surface statistics– Contamination BSDF: similar in form to microroughnessBSDF Diffuse surfaces– If g 0, BSDF is perfect Lambertian. Many bafflecoatings come close to this.– If not Lambertian, typically B is large, 0.1 to 1, and g islarge, 2, 3, 4, 5, 69
“ABg from RMS” spreadsheetInput parameters:sigma (rms roughness)autocorrelation length wavelength dn R or Tmin wave0.25 um50 Angstroms100 um0.5 um2dn difference in index of refraction0.95R or T is (total) reflectance or transmittanceNote: for a mirror, dn 2Calculated ABC model coefficients:As 1.570796327Strictly valid only for C 2Bs 628.3185307 umStrictly valid only for C 2C 2rms roughness/wave0.01 Not valid if greater than 0.02S power spectrumD 2400.28779ABg coefficients for TraceProA 1.81832E-06B 5.0393E-10g 3Raw Integrated BSDF 0.015552516BSDF(0) 3770.363244Bennett & Porteus TIS 0.01488397Correction factor0.95701366Corrected
Eliminate zero-order paths Examples of straight shot or zeroorder paths
What can be “seen” by the detector? Trace rays backward from the image plane to help determinewhat surfaces can be “seen” by the detector– Make the detector surface into a surface source, or define a gridsource immediately before the detector, pointing backward.– Display the Flux Report to determine which surfaces the detectorcan see.– Use Ray Sorting to see the paths of rays reaching those surfaces. In a similar way, trace rays forward to determine what surfacescan be illuminated by the source. Non-optical surfaces that can both be “seen” by the detector andilluminated by the source are “critical surfaces.” Either theilluminating or seeing path should be blocked by a baffle orotherwise mitigated. Consider different paths for cases of “before” and “after” theaperture stop.
Use Analysis Tools Analysis Mode– Ray sorting: For ray display to see the paths of stray rays. For irradiance maps to see irradiance distributions for specular vs.scattered rays. For irradiance maps to see the paths where stray rays for hot spots.– Incident ray table– Ray history table– Path Sorting in TracePRO 7.1 Determine contributions of different stray light paths. Determine under-sampled paths and improve importance sampling.Simulation mode– Ray Path Sorting Determine contributions of different stray light paths. Determine under-sampled paths and improve importance sampling.
Ray sorting for display
Ray sorting for ray type
Ray sorting for hot spotsUseshift/dragto makerectangleThenchooseDisplaySelectedRays
Incident Ray Table
Ray History Table
Ray Path Sorting File Graphical path sorting available in Analysis mode Numeric-based path sorting available in analysis andsimulation mode
Thank You
Questions and Answers
For Additional InformationPlease Contact:Lambda Research CorporationLittleton, MA978-486-0766www.lambdares.com
Four Methods to Reduce Stray Light Move It Moving the stray light by tilting a lens, moving the detector, or angling the offending stray light surface is the best way of getting stray light out of a system. You may need to add a beam dump to completely get rid of the problem. Block it Even