Transcription
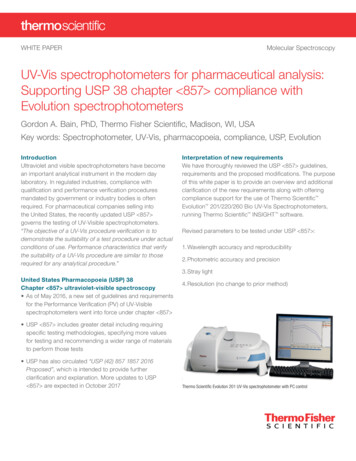
Towards a Stray Light Analysis of the ELTR. HolzlöhnerEuropean Southern Observatory (ESO), Karl-Schwarzschild-Str. 2, 85748 Garching, GermanyABSTRACTStray light in telescopes limits the achievable signal-to-noise ratio which is particularly relevant for high-contrastobservations. This work analyzes stray light from the Moon and from stars in the field of view that scatters oncontaminated telescope mirrors in the ELT.Keywords: ELT, stray light, Mie scattering, dust1. OVERVIEWStray light is by definition any unwanted light in an optical system. Stray light in the E-ELT relevant to science can beclassified into different categories, as attempted in Fig. 1. The categories with light blue background shading are coveredin this work.Fig.1: Classification of stray light relevant to E-ELT science. Only classes with shaded background are covered in this work.TSE Thermal Self-Emission, LGS Laser Guide Star, MS (Telescope) Main Structure2. INTRODUCTIONAssuming that the E-ELT instruments all use accurate field and pupil (cold) stops including the spider vanes, the dome iskept free of light sources during observation, and setting aside thermal infrared radiation for the moment, stray light must
scatter off one of the telescope mirrors. The light either comes directly from a star in the field of view, or else from theMoon. There may be some residual light scattered through the M1 inter-segment gaps and scattering near the primefocus must be studied, but broadly speaking, we can restrict ourselves in this analysis to single scattering events off amirror (M1–M6N).The ELT requirement R-L1S-421 specifies that full science operation must be available down to a Moon distance of 25 off target. The associated off-specular (large angle) scattering is driven mostly by small structures such as dust particlesof a few wavelengths diameter and below and surface roughness features of similar size [1]. The off-specular scatteringcoefficients are very small, but, on the other hand, the Full Moon is an extremely bright object with mV –12.5 [2,6].Conversely, near-specular scattering, such as within the science field (2.5 arcmin radius), is dominated by largestructures such as dust particles above 100 μm and visible scratches in mirrors, but also mirror edges in the science lightpath such as at the M1 bevels or the side faces of the segments. Since the scattered light irradiance is a steep function ofscatter angle relative to the specular reflection direction, stars far outside the FoV and multiple starlight scattering can beneglected. Understanding this type of scattering is critical for high contrast imaging/spectroscopy, typically done withcoronagraphs.1.1Scattering in an Optical SystemLight can scatter off any of the six mirrors M1–M6N and some of the rays will always end up in the focal plane. We willsimulate the irradiance of scattered light onto a “virtual pixel” target of size 1” 1” (3.31 mm)2 centered on the opticalaxis. The power received on the pixel is given by [10](1)whereIsource is the source irradiance on the ground at normal incidence (unit W/m2),θi is the angle between the source ray and the mirror normal,θs is the angle between the scattered ray and the mirror normal,ϕ is the azimuth between the source and scattered rays projected onto the mirror,BSDF denotes the Bidirectional Scatter Distribution Function,Arefl is the reflective area of the mirror,F is the fraction of Arefl irradiated by the scatter source, andΩM,pix is the solid angle under which the target is seen from just above the mirror.The BSDF (unit sr–1) yields the power fraction of an outgoing ray for a given surface roughness/contamination, geometry(θi, θs, ϕ) and optical wavelength λ; see also Subsection 1.4. Equation (1) contains the entire reflective mirror area Arefl,hence all rays that can reach the virtual pixel contribute to Ppix. If, instead, one considers a pupil stop in front of thescience focal plane, then the scattered rays off a certain mirror have to originate from the footprint on the scatteringmirror, pertaining to the field point of the virtual pixel. The footprint is a demagnified copy of the annular pupil whosearea Afoot equals Arefl in the pupil (M1), but becomes smaller as one approaches the focal plane (M2–M6N).Table 1 shows an overview of scatter quantities, where α is the angle between the mirror normal and the optical axis.
Table 1: Quantifying scattered irradiance originating from M1–M6NIt is obvious from Column 6 that the product Arefl ΩM,pix cos θs grows with the mirror number, while Gpix Afoot ΩM,pixcos θs (Column 8) stays roughly constant. This circumstance is a consequence of Lagrange invariance as Gpix can beinterpreted as the étendue of the virtual pixel, which is a conserved quantity across all mirrors. The conclusions from thissubsection are thusa)In the absence of a pupil stop, the scattering impact grows steeply with the mirror number (Column 6; e.g. 43times larger for M6N than for M1 !)b) When using a pupil stop and under identical contamination and illumination conditions, the scattering impactfrom all mirrors is the samec)1.2The angles θi between the source and the mirror normal depend on the mirror orientation. M1, M3, M5 andM6N can be illuminated directly by the Moon.MoonlightThe Lunar radiation spectrum of the Moon can be rather accurately modeled as the sum of the reflected solar spectrum(reflection best fit at 5050 K blackbody radiation) and thermalFig. 2: Full Moon irradiance above the atmosphere vs. wavelength. Left: Log-linear plot, Right: Table of photon flux vs.band (λ: band center wavelength, Δλ: FWHM wavelength range)
Figure 2 also includes a table of the associated photon flux on the ground with the Moon at zenith (airmass X 1) acrosssome astronomical bands. The last column shows the corresponding star magnitudes relative to m 0 in each respectiveband. It is interesting to note that while the irradiance e.g. in K-band (2.2 μm) is only about one tenth of that in the Vband (0.55 μm), the photon flux in K is even larger than in V. This situation is a consequence of bands widening in theinfrared (390 nm vs. 88 nm in the example) and the photon energy scaling like 1/λ.The dependence of Lunar irradiance on Earth versus Lunar phase angle is shown in Fig. 3 in the Appendix.1.3Dust on MirrorsTypical mirrors of ground-based telescopes are rather dirty compared to those in most other optical systems.Contaminants mainly consist of small mineral particles like silica, but also include thin grease/oil films [11].Experience on the VLTs shows that the average throughput M1–M3 is about 65% in the visible. Assuming a reflectivityof a freshly oxidized aluminium coating of 90.5% at 589 nm, reflectivity losses of e.g. 7% on M1, 1% on M2 and 3.5%on M3 would explain this figure. By comparison, the combined area of all M1 inter-segment gaps and bevels totals onlyabout 1% of the pupil area (9.1 m2 / 970 m2 0.93%), showing that the net telescope reflectivity loss, compared to thestate of all monolithic and freshly coated mirrors, is mainly driven by dust. The effects of residual mirror polishingroughness and M1 segmentation are secondary.The Optics Group in Paranal has run a multi-year study of mirror witness samples, both inside the VLT domes in cagesand outside in a well ventilated hut near the DIMM Tower [3]. The result is that the specular reflectivity loss in thevisible in percent per 100 days can be approximated by the fit function(2)where α is the angle between the mirror normal and the telescope optical axis (i.e., α 0 for upward facing mirrors,α 45 for M3 in the VLT etc.) and max{,} yields the maximum of two arguments. The three mirrors in the VLT thusaccumulate dust at approximate rates of M1: 1%, M2: 0.1% and M3: 0.73% per year, ignoring that M3 is retracted whenobserving at Cassegrain focus, protected from dust. The reflectivity loss rate of 1% per year in the visible due to dust wasalso confirmed by a multi-year mirror study on silver coated mirrors at Gemini South [11].Requirement R-L1S-418 of the E-ELT Level-1 Requirements is based on the cleanliness class CL630 defined in thestandard [4]. This standard describes a lognormal dust particle size distribution that was found in 1962 to be appropriatefor recently cleaned optics in US military cleanrooms. The minimum assumed particle diameter is 1 μm and towards thelong tail there is a single particle of 630 μm diameter or more per square foot on average.The fractional geometrical dust coverage of CL630 is 1.0%. However, the associated loss of specular reflection in the farfield is actually 2%, not 1%, caused by the combination of backward reflection, absorption and diffraction [1, Section4.4.3]. In the visible, these 2% scatter diffusely. On the other hand, in the (far) infrared, where many particles becomesmaller than the wavelength, absorption becomes relevant and the total absorbed power is comparable to the scatteredpower. This last point becomes relevant for TSE calculations.Geometric area coverage is difficult to measure directly (requires classifying/counting particles under the microscope),but needed for the numerical simulation of Mie scattering. Specular reflectivity in the visible, on the other hand, can bemeasured in situ with rather affordable commercial reflectometers.The EELT recoating baseline schedule at the time of writing foresees that each M1 segment is recoated every 18 monthsand M3 shall be washed or recoated every two years.We can draw the following preliminary conclusions from this section:a)The standard IEST1246D [4] is not well suited for ground-based telescope mirrors, which are not in acleanroom and most of the time far from the “recently cleaned” state.b) On a single upward facing mirror, 1% specular reflectivity loss 0.5% area coverage is reached in the Atacamaafter about 100 days (hence CL630 after 200 days).
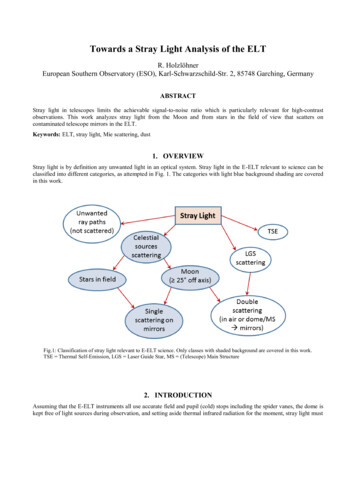
c)Exposing the E-ELT mirrors M1–M6N with the orientation angles {0 , 180 , 0 , 172 , 53 , 90 } for 100 days todust, one suffers 3% total specular reflectivity loss (equivalent to “1.5 times CL630”)d) With the baseline of recoating M1 segments every 18 months, the time averaged segment dust exposure is 548/2 274 days 9 months 2.74% reflectivity loss. Assuming that the other mirrors are cleaned/recoated every24 months ( 365 days avg. exposure), we experience a time average of 10% telescope specular reflectivityloss, and thus emissivity increase, due to dust (equivalent to “5 times CL630”)1.4BSDFsIn this analysis, we consider Mie scattering according to the standard IEST1246D [4] with the default slope of 0.926. Inthe future, more relevant particle distribution functions or, optimally, measured scattering functions should be used. Asstated before, mirror-polishing roughness also generates scatter, but can be neglected in a first analysis because dustdominates, except directly after recoating.In order to magnify the near-specular scatter behavior (a few arcminutes off the specular ray), but also to generalize toout-of-plane scattering (hence ϕ 0), BSDFs are usually plotted against the quantity B –B0 sinθs – sinθi which islimited to the range (0,2). Since the absolute value B –B0 cannot distinguish between forward (B B0) and backward(B B0) scatter directions, the curves in the corresponding plots consist of two branches. Both scatter brancheseventually peak upward, corresponding to the peaks seen at the left and right edges of the plots against linear scatterangle (Scatter Angle θs 90 ). At large angle scattering (i.e., far from specular), forward Mie scattering dominatesover backward scattering. If the scattering particle sits on a mirror, some forward scattered rays reflect off the mirror, butbackward scattered light does not.Two Mie scatter BSDFs computed in the FRED simulation software are shown in Fig. 4 of the Appendix. The curvespeak at the specular reflection direction and subtend a vertical range of about five decades and more at oblique incidenceangles (note the log scale on the vertical axes).The integration of the BSDF over the hemisphere yields the Total Integrated Scatter (TIS) [10]. The approximaterelationship TIS 2 PAC/cos(θi) holds in the visible in percent, where PAC (Percent Area Coverage) is the geometricalarea coverage in percent, hence e.g. PAC 1.0 for CL630.Besides scattering, dust also absorbs light, modeled by the imaginary part of the refractive index of the particles. Thetotal absorption can be quantified as TIA (Total Integrated Absorption). According to Mie scatter theory, the sum of TISand TIA equals twice PAC, independent of wavelength. It should be mentioned that this theoretical result seems todisagree with measurements that usually report increasing specular reflectivity loss with decreasing wavelengths [12].The topic is under investigation.The BSDF curves generally become flatter towards increasing wavelength with diminished peaks for near-specularscattering, and grow at large-angle (off-specular) scattering, as evident in the four plots shown in Fig. 4, valid for 551 nm(center of V-band, upper two plots) vs. 2.2 μm (center of K-band, lower two plots). All BSDFs are for CL630 (1%geometrical area coverage 2% specular reflectivity loss). The curves scale linearly with the PAC.One can draw the following conclusions from this subsection:a)Mie scattering on dusty mirrors is strongly angle dependent, with near-specular scatter larger than off-specularby 3 – 4.5 orders of magnitude within V–K,b) Near-specular Mie scattering scales roughly like λ–2, while off-specular is only weakly wavelength dependentwithin V–K,c)The near-specular BSDF values should be considered lower limits since this scatter regime is dominated by asmall number of large irregularities in the telescope beam (large dust particles, mirror scratches/chips, segmentbevels, spider vane edges etc.).
Table 2: Mie scatter BSDF values vs. band for near- and off-specular scatteringoff-specularoff-specular(θi 30 , θs 0 ) (θi 60 , θs 0 )[10–3 sr–1][10–3 951.45J15.53.381.58K5.03.051.393. RESULTSWe quantify the scattering by calculating the photon flux onto the virtual pixel in the focal plane.1.5Moonlight ScatteringAccording to the preceding subsections, we can rewrite Eq. (1) for the number of photons per time from Moonlightscattering onto the virtual pixel (1” 1”) can be written as a sum over the mirrors k(3)where the Lunar photon flux ΦMoon is given in the table in Fig. 2 and Gpix in Subsection 1.1. The Moon is assumed to beat least 25 off target and can directly hit M1, M3, M5 and, if deployed, M6N. The first three mirrors also accumulatedust the fastest, so we employ Eq. (2) and obtain PAC1 PAC3 2 for M1 and M3 and PAC5 2 (0.9 cos(53 ) 0.1) 1.3 for M5.M6N is somewhat special since its surface normal lies always in the x/y plane, hence it can only receive directMoonlight for certain azimuthal orientations to the Moon. However, in these cases it scatters a lot of light towards theinstruments due to its proximity to the focal plane with a large solid angle of 48,405 arcsec 2. Example: Let the Moon beat 60 zenith angle and at around 45 azimuth relative to the dome slit, shining towards Nasmyth A. Then θi 30 and B–B0 0.866, corresponding to 60 off-specular angle (this angle is between two rays without common plane, however).Assuming PACM6N 0.2 (vertical mirror) and using Table 2, we find npix 3.7–7.3 105 photons/s from M6N only fromV–K bands in the absence of a pupil stop. This photon flux is about twice the scatter flux from all mirrors combined, butwith a pupil stop, raising the concern that stray light may leak through despite the stops.Table 3 shows npix for two cases of Full Moon scattering on E-ELT mirrors for the bands V–K: The first case (columns4–6) is rather pessimistic and assumes that the Moon is only 25 off target, and M1, M3, M5 and M6N receive direct andunobscured Moonlight. The second case (columns 7–9) is more optimistic, assuming the Moon is 60 off target, M3 isobscured 50% by the ARU Tower structure (F 3 0.5), and M6N does not receive direct Moonlight (F6 0).Diffusely scattered light is uniformly distributed across the field and looks like an elevated sky background whose inband magnitudes are printed in columns 4 and 5. In order to generalize the tabulated values to other Moon phases, onecan consult Fig. 3 (e.g., Half Moon phase angle 90 2 V-band magnitudes penalty).
Table 3: Stray light onto virtual pixel (1” 1”) from Moonlight scattering on contaminated E-ELT mirrorsColumns 6 and 9 show the total scattered Moonlight onto the virtual pixel at 25 and 60 off target, divided by the skybackground under the respective conditions versus the band.1.6Near-Specular Scattering from Stars in FoVThe E-ELT science FoV has a diameter of 2.5’ 0.73 mrad. The BSDFs shown in Fig. 4 level off at B –B0 1.16 mrad 4’. Consequently, when the telescope observes an object of interest near the field center, any star within the technicalfield scatters with the same attenuation (leakage) factor onto the image of this object. The scatter attenuation factor canbe considered a contrast limit, as shown in Table 4 for the bands V–K. In the last column, “delta magnitude” denotes thefactor by which the light from a star in center field is attenuated anywhere else in the science field.The requirements of the planned exoplanet instrument EPICS specify contrasts of better than 10 –8 at 30 mas and 10–9beyond 100 mas angular separation within 600–1650 nm [5]. In order to achieve these requirements, one has to reducethe pixel scale, e.g. to 10 mas, which reduces the scattered light power per pixel by 10–4. If the object PSF is fullycontained within a single pixel (the E-ELT diffraction limit at 1 μm is 6.8 mas), a raw contrast of a few parts in 10–10becomes possible in principle, ignoring the AO halo and all other error sources. In reality, scattering from contaminatedmirrors may become a leading limiting factor for high-contrast ELT observations.Table 4: Stray light onto virtual pixel (1” 1”) from in-field starlight scattering on dusty E-ELT mirrors
CONCLUSIONSThis paper contains a preliminary analysis of stray light in the E-ELT, focusing on single scattering of moonlight andstarlight on contaminated mirrors in V–K bands.The E-ELT differs from other ESO telescopes in a number of ways that makes it more prone to scattered stray light offits mirrors: It contains 5–6 serial mirrors to the instruments instead of 2–3, of which 3 to 4 can be directly illuminated bythe Moon. The “dome F-number” (ratio of dome slit edge height above M1 to dome slit width) is only 1.24, versus e.g.1.60 in the VLT, hence the ELT mirrors see a larger solid angle of the sky. The ELT does not have a moonshield, as forinstance VISTA does. Finally, cleaning the M1 segments, e.g. by CO 2 snow, is difficult.The following key results were found:1.Accurate pupil stops in the E-ELT instruments are crucial, in particular to block stray light from scattering onthe mirrors closest to the focal plane2.In the presence of accurate stops and baffles, dust on mirrors is a leading cause of stray light in V–K bands andcontributes identical amounts of power onto the focal plane, irrespective of which mirror (M1–M6N) it sits on3.Dust fallout on upward facing mirrors in the Atacama reduces the specular reflectivity by about 1% per 100days per mirror (“50% of CL630 contamination”)4.Given the current baseline washing/recoating schedule, one can expect a total time-averaged reflectivity loss inthe ELT of about 10% due to dust5.Off-specular scattering (e.g. from Moonlight) is almost independent of wavelength, but near-specular scattering(starlight within field) is 3–4.5 orders of magnitude more efficient and scales like λ–26.Scattered Moonlight under adverse conditions (Full Moon 60 off target shining fully onto M1, M3, M5 andM6N) can raise the apparent sky background above 1 μm (Y–K) by up to 44%APPENDIXFig.3: Apparent Lunar V-band magnitude versus phase angle (Source: [6])
Fig.4: BSDF plots from FRED for 551 nm (V-band, top 2) and 2.2 μm (K-band, bottom 2) vs. linear angle and B-B0
REFERENCES[1] C. F. Bohren and D. R. Huffman, Absorption and Scattering of Light by Small Particles, Wiley (1983).[2] C.E. Cramer, K.R. Lykke, J.T. Woodward, A.W. Smith, "Precise Measurement of Lunar Spectral Irradiance atVisible Wavelengths", J. of Res. NIST 118, p.396–402. PMID 26401440 DOI: 10.6028/jres.118.020 (2013).[3] S. Guisard, “Study of the effect of dust deposition on Paranal mirrors – Report 2014”, Internal ESO draft report(2014).[4] d-contamination-controlprogram/[5] M. Kasper, J.-L. Beuzit, et al., “EPICS: direct imaging of exoplanets with the E-ELT”, Proc. SPIE 7735 (2010).[6] M. Luciuk, “How Bright is the Moon?”, online Tutorial 26, Sperry -1.htm.[7] J. A. Shaw, "Modeling infrared lunar radiance", Opt. Eng. 38, p.1763–1764 (1999).[8] SkyCalc, Online ESO exposure and sky background calculator http://www.eso.org/observing/etc/skycalc/[9] P.R. Spyak and W.L. Wolfe, "Scatter from particulate-contaminated mirrors. Part 1: theory and experiment forpolystyrene spheres and A 0.6328 μm", Opt. Eng. 31, 1746–1756 (1992).[10] J.C. Stover, Optical Scattering Measurements and Analysis, SPIE Press, 3rd Ed, ISBN: 9781628418408 (2012).[11] T. Vucina; M. Boccas; C. Araya; C. Ahhee, "Gemini's protected silver coatings: first two years in operation",Proc. SPIE 6273, 62730W (2006); doi: 10.1117/12.670866.[12] T. Schneider, T. Vucina, C. Araya, et al., “The Gemini Observatory protected silver coating: ten years inoperation”, Proc. SPIE 9906 (2016)
Towards a Stray Light Analysis of the ELT R. Holzlöhner European Southern Observatory (ESO), Karl-Schwarzschild-Str. 2, 85748 Garching, Germany ABSTRACT Stray light in teles