Transcription
UCRL-JC-129754PREPRINTGhost Analysis Visualization Techniques forComplex Systems: Examples from the NIFFinal Optics AssemblyJ. L. HendrixJ. SchweyenJ. RoweG. BeerThis paper was prepared for submittal to theThird Annual International Conference onSolid State Lasers for Application (SSLA)to Inertial Confinement Fusion (ICF)Monterey, CaliforniaJune 7-12, 1998June 26,199sThis is a preprint of a paper intended for publication in a journal or proceedings.Since changes may be made before publication, this preprint is made available withthe understanding that it will not be cited or reproduced without the permission of theauthor.
DISCLAIMERThis document was prepared as an account of work sponsored by an agency ofthe United States Government. Neither the United States Government nor theUniversity of California nor any of their employees, makes any warranty, expressor implied, or assumes any legal liability or responsibility for the accuracy,completeness, or usefulness of any information, apparatus, product, or processdisclosed, or represents that its use would not infringe privately owned rights.Reference herein to any specific commercial product, process, or service by tradename, trademark, manufacturer, or otherwise, does not necessarily constitute orimply its endorsement, recommendation, or favoring by the United StatesGovernment or the University of California. The views and opinions of authorsexpressed herein do not necessarily state or reflect those of the United StatesGovernment or the University of California, and shall not be used for advertisingor product endorsement purposes.
Ghost Analysis VisualizationTechniques for Complex Systems:Examples from the NIF Final Optics AssemblyJames L. Hendrix - AlliedSignal Inc. Federal Manufacturing & Technologies ,John Schweyen - Breault Research Organization,Jeffrey Rowe - Lawrence Livermore National Laboratory*,Glenn Beer - Lawrence Livermore National Laboratory*Lawrence Livermore National LaboratoryPOB 808 - L527, Livermore, California 9455 1ABSTRACTThe stray light or “ghost” analysis of the National Ignition Facility’s (NIP) Final Optics Assembly (FOA)has proved to be one of the most complex ghost analyses ever attempted. The NIF FOA consists of abundle of four beam lines that: 1) provides the vacuum seal to the target chamber, 2) converts lo to 30light, 3) focuses the light on the target, 4) separates a fraction of the 30 beam for energy diagnostics, 5)separates the three wavelengths to diffract unwanted 10 & 2 light away from the target, 6) providesspatial beam smoothing, and 7) provides a debris barrier between the target chamber and the switchyardmirrors.The three wavelengths of light and seven optical elements with three diffractive optic surfaces generate threemillion ghosts through 4‘h order. Approximately 24,000 of these ghosts have peak fluence exceeding 1J/cm’. The shear number of ghost paths requires a visualization method that allows overlapping ghosts onoptics and mechanical components to be summed and then mapped to the optical and mechanical componentsurfaces in 3D space.This paper addresses the following aspects of the NIF Final Optics Ghost analysis: 1) materials issues forstray light mitigation, 2) limitations of current software tools (especially in modeling diffractive optics), 3)computer resource limitations affecting automated coherent raytracing, 4) folding the stray light analysisinto the opto-mechanical design process, 5) analysis and visualization tools from simple hand calculationsto specialized stray light analysis computer codes, and 6) attempts at visualizing these ghosts using a CADmodel and another using a high end data visualization software approach.Keywords: ghost analysis, stray light, National Ignition Facility (NIF), final optics,11 .lSourcesof ghostedGHOSTstrayANALYSISBACKGROUNDlightStray light is unwanted radiation that generally takes the form of scattered light, thermal radiation, orspecular reflections (ghost reflections) from nominally transmissive surfaces. Stray light that reaches thefocal plane of an imaging system degrades system performance by decreasing signal-to-noise or producingfalse images. In a high power laser such as NIF, stray light behavior can be critical to system operation. Asghost beams propagate along the beamline they generate additional ghost reflections, and they will also passthrough focus. Near focus, the relatively small amount of energy in the ghost beam becomes concentrated,resulting in potentially damaging fluence levels. Catastrophic failure of optics and metal structures fromghosted stray light has occurred on other laser systems, and can cause runaway damage that would lead topoor system performance and/or poor reliability and availability.The following definitions should be helpful:
N’h order ghost: a ghost generated by “N” reflections, e.g. a first order ghost is generated by only onereflection, a fourth order ghost was generated by four successive reflections at optical interfaces.lGhost family: the ghosts generated by a given sub-set of surfaces. For example, a third order ghostinvolves the same two surfaces and the additional surface for each individual ghost path is different,thus they are all related but slightly different.lGhosted stray light includes Fresnel reflections from refractive surfaces as well as unwanted grating orders,In the case of NIF, with 18,000 joules incident on each FOA beam line, even a 0.1% reflection can bedevastating. The focusing optics in the optical train produce 41h order ghosts on the order of 2J/cm’,assuming 1% reflection losses. (& order debris shield ghosts). Diffuse surfaces will randomize thewavefront of a ghost beam and typically render it harmless to the surrounding materials and components.However, this is a generalization and each system and path should be examined in detail.1.2DamageeffectstableThe following table gives typical levels of concern when doing ghost analysis on a laser system.EnergyRisk I Issue I Concern 50 mJ/cm*Liberates adsorbed particles (contaminants) from most surfaces that then can then redeposit on optical surfaces, resulting in potential damage sites that can propagate andcause runaway signal degradation with successive shots.Structural metals are ablated/vaporized. The vaporized material deposits on the opticalsurfaces generating damage sites that will propagate and cause runaway signaldegradation with successive shots.Optical coatings fail, degrading the magnitude and quality of the transmitted opticalsignalAt this fluence optical glass materials will begin to vaporize, metals and polymers willexplosively ablateCauses air breakdown (strips electrons off of gas molecules creating a plasma) undermany conditions. Energy is absorbed or scattered by the plasma causing loss of signaland degradation of signal quality.Optical materials will ablate. Most metals and polymers will explosively ablate (forvery clean dry air, 1 nS pulse @ 1 micron} 0.1 J/cm2 20 J/cm’ 1000 J/cm*The liberation of trapped contaminants will be an issue on the NIF FOA because there are large areas onmechanical surfaces exposed to fluences in excess of 50 mJlcm*. The issue of ablating structural materialsis a serious one in that it will lead to collateral damage on the optics. While the precise value of this varieswith the specific material this is the level at which material specifics must be carefully considered. The airbreakdown value can be significantly less than the 1000 J/cm’ that is listed because it is highly dependenton the pressure, humidity, and level of contaminants in the air/gas under test. In tests with optical fibersthe author has experienced air breakdown as low as 80 J/cm*.2FINALOPTICSASSEMBLYOPTICALDESIGNThe NIF Final Optics Assembly (FOA) is broken up into four beam lines. The optics for each beam lineand it is associated mounting hardware and enclosure is referred to as an Integrated Optics Module (IOM).Figure 1 shows the final optics for a beam line.
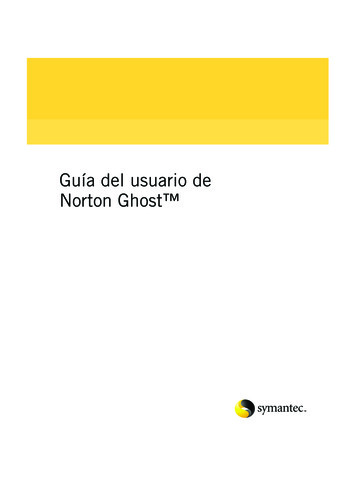
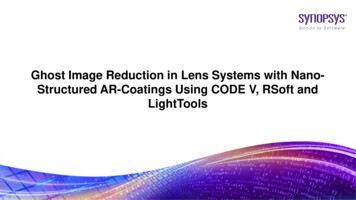
KD*P FrequencyConversionDiffractiveOpticsDebris shieldFull aperture sampled beamto 3w CalorimeterTarget ChamberVacuum WindowFigure 1: The optical train for a single beam line of the NIF Final Optics Assembly shows thecomponents and optical functions for each.The final optics assembly performs several functions on the NIF. The Target Chamber Vacuum Window(TCVW) provides both vacuum isolation of the target chamber and ghost control via its tilt angle (notshown in this view (see Figure 31). The frequency conversion crystals use a type I/Type II sum frequencygeneration scheme using KDP/KD*P.The final focus lens provides for the energy to be focused at thetarget chamber center. The FFL focal length is 7703mm and the lens is inserted in the reverse orientationto what is normally done in optics with the flat side pointed toward the incoming beam. This is done toprovide for a 3w diagnostic reflection that verifies proper orientation of the frequency conversion crystalsrelative to the incoming beam. Following the frequency conversion crystals there is significant residual 1oand 20 light (not shone explicitly until after the diffractive optics). The diffractive optics perform threefunction in the NIF, each function being provided by separate diffractive structure. These gratings and theirgeneric functions are shown in Figure 2. The Beam Sampling Grating (BSG) is a holographically produceddiffractive structure that provides a calibrated sample of the 3w beam to be diverted to a calorimeter forenergy measurement. The Color Separation Grating (CSG) diverts the unconverted I w & 2w light from thetarget. Note only t first diffracted order is shown in Figure 1 for both the BSG and the CSG. The otherorders represent ghost energy that must be mitigated.DOPs contains three types of diffractiveSamplingProvides a sample of the3w beam at full powerColor SeparationKinoformMoves unconverted 1w and2w, light awav from theProvides 3w spatialbeamFigure 2: The diffractive optic structures are shown for the beam samplingseparation grating and kinoform phase plate.phasegrating,colorFigure 3 shows the FOA and its IOMs with optical components identified as well as acronyms defined.
1JIOEFigure 3: The opto-mechanical design of the NIF Final Optics Assembly shows thecomponents and optical functions for each.The added complexity of the mechanical structure for any system is a challenge, especially when combinedwith the lower damage threshold of most structural materials.3GHOSTCHALLENGEIN THENIF FOAThe number of ghosts generated by a series of refractive elements is asymptotically approximated by(M-SURF)N-SPLIT where M-SURF is the number of transmissive interfaces, and N-SPLIT is the number ofghost orders considered. Each IOM contains seven refractive optical elements, comprising 14 surfaces. Twoof the three diffractive surfaces generate unwanted grating orders, each of which is equivalent to an additionalsplitting surface. To complicate matters, off-axis ghosts from tilted elements are generally broken intopieces as they encounter lens edges. As mentioned above, ghosts up through fourth order present damagerisks to the FOA opto-mechanical structure. The 301 beam in the FOA will therefore generate on the orderof 500,000 ghosts whose fluence and location must be quantified.Unconverted lw and 201 light carries approximately 40% of the total energy. Additionally, 15% of the 30energy may be reflected back towards the IOM via Stimulated Raman Scattering (SRS) and StimulatedBrillouin Scattering (SBS). Because of chromatic dispersion at the diffractive structures, these variousbeams generate ghosts that focus at different locations. The bottom line is that the FOA ghost analysisentails the computation of several million ghosts.Ghosts are filtered at several stages based on degree of collimation, fluence, and focus location. The opticsand mechanical structures intercept approximately 50,000 ghosts that exceed the analytical fluence thresholdat the surface or at geometric focus. These are tabulated in an Excel spreadsheet. Only a very small fractionof these focus close enough to a surface to contribute significantly to surface fluence.
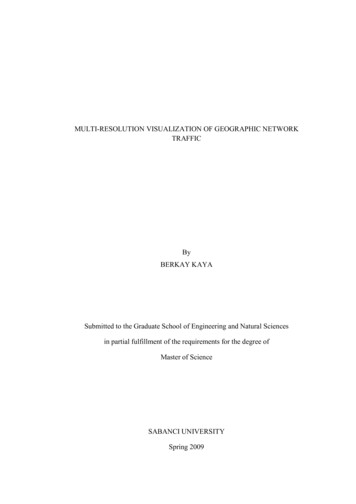
The large numbers of ghost paths and large energy transitin g the system in the NIF FOA combined withthe relatively large size of the assembly yield some demanding requirements for ghost analysis. TheIntegrated Optics Module (IOM), which represents one beamline, is approximately 0.5 M3. Although thepoint spread function for badly abet-ratedghosts have rms diameters on the order of lmm; peak fluence isusually confined to regions on the order of 10 microns in diameter. Since the ghost at focus can be smallerthan 10 microns it would require 1013 computational cells to address even a 10 micron resolution in aregularly distributed array. This would require approximately 250 terabytes of storage. One solution is torepresent the volumetric fluence distribution in point cloud form and to display the information using pointglyping, as described below.4GHOSTANALYSIS& VISUALIZATIONTECHNIQUESSeveral methods were used in the ghost analysis project for NIF, some of which will be described in thefollowing sections. Those that are not specifically listed include CODE V, GLAD, and IDL.4.1Firstorderoptics and the EnglishmethodThe best starting point for any such analysis is first order optics. By examining the optical system andidentifying the bounding ghosts much can be done to identify and mitigate problem ghost paths. We uses asimple spreadsheet approach to ray tracing that allowed us to determine the focus positions of the definingghost paths over the extremes of travel of the final optics cell (FOC). The FOC contains the frequencyconversion crystals and the final focus lens in the NIF final optics. The English method is a means ofgraphically displaying this type of data. It is named for its creator R. Ed English. The method is shown inFigure 4 and illustrates how the ghost path focus position is displayed for FOC travel position. Note thatthe Bars represent the range of travel of the ghost with FOC position. The dot in the bar represents theghost focus position at the nominal focus position for the FOC. The “ ” represents the position as theFOC is moved in the forward direction and conversely the ‘&-‘ shows the position as the FOC moves in thereverse position.FLSZ-TCVWS 1FLSi-TCVWSI-SHGSIw,”-70 70Figure 4: The English method of ghost path visualization allows for ghost focus locations tobe shown as a function of optical system zoom positions. ASAPThe FOC position is shown in light gray for the two extreme focus positions.This analysis wasperformed when one Diffractive Optic Plate (DOP) was in the FOC; this has been moved to a DOP cassettein the current design. The path naming convention is the element acronym such as TCVW is the target
vacuum window, followed by the side number one being toward the input side relative to the laser. ThusFLS2-SHGSI-DSS2 is the second surface of the focus lens (the curved surface) followed by a bounce off ofthe second harmonic generator and then the debris shield second side (toward the target). See Figure 3 foracronyms definitions.4.2ASAPASAP (Advanced Systems Analysis Program) is a general optical analysis software tool that can be used toevaluate stray light performance. The program kernal is a non-sequential ray tracer that automatically tracksand quantifies all possible ghost paths up to some user-specified level. Optical and mechanical componentsare integrated into a single model. The program reports ghost fluence at designated surfaces and optionallyrecords statistics on ghost foci between surfaces.For the FOA analysis, ghosts are initially evaluated using an algorithm based on geometric optics that wasspecifically developed to overestimate peak fluence. A ghost beam is flagged as potentially threatening if itsfluence at a surface or at focus exceeds user-specified thresholds. Peak fluences of energetic ghosts am thenmore accurately computed using the program’s wave optics capability. Since peak fluence and locationthereof depends on beam aberrations, which are typically on the order of hundreds of waves, it is necessaryto search through a small volume in the vicinity of geometric best focus. The FOA grating surfaces andtilted optics preclude the use of symmetry in this calculation.ASAP’s graphics capability is not well suited to the display of sparsely distributed data over large volumes,The display of accumulated ghost fluence throughout the FOA optical train is therefore handled off-line.Off-line processing also allows first-order toleraniing to be considered as described below.4.3ASAP& PRO-EOne attempt to visualize the ASAP results was toimport the ghost focus locations (in x, y, z),direction cosines indicating the direction the ghostwas traveling at focus, and the distance from thelast optical surface into a mechanical designprogram. PRO-E was used for the mechanicalmodels and thus the ASAP data was imported intoPRO-E as a table generated pattern. The results ofthat visualization are shown in Figure 5.This visualizationtechnique has tremendouspotential however the lack of access to the colortable in PRO-E (in order to show fluence data) andthe need for significant operator input to performsectioning operations at surfaces of interest atecurrently severe limitations to its use.Of course the ability to use the actual mechanicalgeometry and have it update as changes are madeduring the design is a definite advantage. Thiscoupled with the ability to rotate, section and zoomprovidesfora powerfulanalysistool.Unfortunately time and manpower constraints ¬ allow for the limitations to be addressed andFigure : Irn rti the ASAP calculated ghost dataresults mto RO- provides a good visualization ofthe host interactions with the mechanical features ofan HOM. However the lack of fluence data at themechanical surface s limited the usefulness of thisapproach.
overcome.4.4PostprocessingIt became apparent early in the project that a method to post process the data that would allow for theintegration of the various colors was necessary. It was also envisioned that a tool that would provideoutput similar to a finite element analysis model would be ideal for visualizing the FOA ghosts.The ASAP data was post processed using a FORTRAN 90 program that performs the following:Where:Peak Su ace Fluence @ foocus- Pcente j 5 dtolaranced toleranceEstimatedpeak jluenceSurfacej7uence Ajoorprinr AreaF focus Locationof geometric focus,Fcenter Centroidofat geometric%lA footprint ISmm,footprintatsurface.4p.focus 200 - 0iI, ‘;p, Energyn thof ghost footprintghostghost,0 RMS blurdiameter@ geometricfocus.@ su ace.And df is change in focus position.Thus the ghost locations and fluences are calculated using ASAP. The fluence from overlapping ghost andwavelengths are integrated. The ghosts that have their focus position within a given distance from a surfaceare snapped to that surface (15 mm is a typical snapping distance). And finally, the maximum for each cellfrom the different focus positions is taken for each computational element.
The result of the post processor is then ready for import into a visualization tool such as IBM’S DataExplorer or IDL.4.5VisualizationwithIBMDataExplorer(IBMDX)A\ risualization software package like IBM DX allows data from the post processed ASAP data to beimp sorted and overlaid with a geometry file. The data points from ASAP are also glyphed. Glyphingall0 ws the data resolution to be filled in by making the point a cube with, in our case, a one centimeter facedim .ension. The resultant visualization is shown in Figure 6.Figure 6: The visualizationtoolallows geometryand ghost fluence data to be shownsimultaneously and clearly indicating where the areas of concern are located.Other features of a visualization tool arethe ability to clip ghosts outside of userselected limits. Figure 7 shows a clippedview with only ghosts above 4J/cm*shown.Figure 8 shows only ghosts between 0.5and 4 J/cm’. In addition it shows the pathinformation which must be retrieved usingspreadsheets based on the fluence andlocation. The paths shown are for thedominant ghost paths for each ghostpatch. A ghost patch is a superposition ofoverlapping ghosts footprints (as well aswavelengths and focus positions).Geometrically calculated ghost fluencestend to overestimate the actual fluence andthus coherent evaluations for hot ghostFi ure 7: The NIF IOM is rendered with on1 ghosts above4J%m2 shown. This can be defined for any x uence range ofinterest.
paths are calculated using ASAP or GLAD. Figure 9 Shows several ghost patches in the most recentanalysis runs with the dominant paths indicated, the geometrically calculated fluence and the coherentlycalculated fluences. The geometrically determined fluence is almost always lower than the coherentlydetermined fluence. It is important not to assume that it is always true however, we hav,e found a few pathswhere the geometrically determined fluencewas lower. The difference ranges typicallyfrom a factor of 3 to a factor of an hundred.The geometry can be selectively excluded tozoom in on a particular area, but this isdone priorto importingintothevisualizationprogramand mustbeaccompanied by a range limited (spatial) setof ghost data. Figure 10 shows an exampleof the ghost data and the optical elementsonly and is very useful for identifying stayout zones. Note that the data shown ifFigure 10 includes fluences on optics andthe focus positions of the ghost paths withfluences greater than 1 J/cm*. Thesolid areas over the wire frame ofthe optics are all less than 3 J/cm*and tend to obscure other ghostinformation this can be clipped toshow only those ghost above and orbelow user specified fluences. It isinteresting to note the range offluences in this plot. The 1”’ orderghost of the curved surface of thelens has a coherently determinedfluence of 5 MJ/cm*.All of theplots shown are in the same rotationangle, however the data can berotated, panned, and zoomed tointerrogate various portions of thesystem.Fi ure 8: Ghosts within the range of 0.5 to 4 Jlcm’.are shown.Aksp note the path information for the major ghost patcheswhich indicate the dominant contributor for each patch.Figure 9: Ghosts from the most recent analysis runs greater than 2.5J/cm2.are shown. Note the ath informatlon for the major ghostpatches, which indicate the ti ominant contributor for each patch aswell as the geometrically and coherently determined fluences for thedominant pathFigure 11 shows the optical elementsagain, this time with the ghosts less than3 J/cm2 and greater than 100 J/cm2clipped out. Note that the color scale forfluence is more useful than in Figure 10.Figure 10: The NIF FOA o tics are shown (in wire frame) withthe ghosts both at the sul-Face of each optic and the fluencesat focus show% This represents in excess of 24,000 ghostsabove lJ/cm tracked for the optics
Figure 11: The NIF final optics elements are shown combined with the ghost footprintsoptics and ghost focus positions between 3 and 100 J/cm2.4.6Trackingon theback to ghost pathsdata provided by a stray light analysis are: 1) how much stray light reached the criticalsurfaces, and 2) how did the stray light propagate to the critical surfaces. It is the second item that allowsone to decide which design changes are needed to improve performance. In the context of ghost analyses,this information is provided by specifying the sequence of ghost reflections encountered by the beam on itsway to the critical surface. This sequence is referred to as a ghost path.The most importantASAP reports path information for all ghost beams at all critical surfaces. At each element of the displayedvolume, the post-processor determines which path contributed the most stray light. The spatial coordinatesof high fluence areas observed in IBM DX are associated with a path index, which in turn corresponds to aghost path sequence in the Excel ghost catalog. The ghost path data is dialed back into ASAP to obtain agraphical raytrace, a coherent estimate of peak fluence, or sensitivity data.4.7MitigationTechniquesGhost mitigation techniques for optical elements and the surrounding mechanical structures diiersignificantly. To mitigate the ghosts that fall on optical surfaces it is usually sufficient to change theoptical element spacings or tilt angles of the elements. This tends to put those ghosts onto the mechanicalstructure. Since engineers have yet to figure out how to float the optics in space while maintaining theprecision alignments required for lasers systems there are always mechanical structures required to hold andposition the optics. These mechanical structures tend to be made from materials that have far lower laserdamage thresholds (LDT) than those of the optical elements. As a result, either the material for themechanical hardware must be changed or it must be protected with a material that can withstand the ghostfluence.
The most widely used technique for ghost mitigation is to cover the structures with absorbing glass. Thishas two distinct drawbacks. First, the absorbing glasses (e.g. NG4) are expensive. Second these glasses arepolished. The polishing is an issue for two reasons. The 30 laser damage threshold (LDT) of polishedglass surfaces tends to be a strong function of the polishing techniques employed. And in the NIF FOA theghosts arrive at the majority of optical surfaces at very high angles of incidence. The high angle ofincidence results in ghost energy being reflected (dependant on incoming polarization). The NIF FOAanalysis complexity was such that, given current operating constraints, the system could not analyze theextra surfaces created when mechanical structures were covered with glass. Further and more importantly ingeneral is that these reflected ghost paths can be redirected to other areas of the system and cause laserdamage to occur.In order to mitigate these ghosts an architectural glass was found with favorable absorption characteristics.Since it is a float glass a “polished” surface is obtained without mechanical polishing yielding a consistentLDT. In addition, a chemical etch was found that allows the material to be a diffuse reflector, and thusbreak up the ghost spatial profile, and still have acceptably high LDT. The LDT for the chemically etchedglass was about a factor of 2 higher than for the mechanically roughened surface.Other materials such as pure Alumina ceramics and polymers (e.g. Teflon) are being investigated whereglass is not desirable from an assembly and reliability perspective.One other technique that was used is to allow high fluence ghosts to pass through a hole or slot in anabsorbing glass plane and thus allow the ghost to pass through the material and through focus. The energyis then absorbed once the beam is sufficiently past focus so that the fluence is below the LDT of theabsorber.Other methods include limitations on operations. Examples of this on NIF would include limiting therange of travel of the FOC in one direction or the other and limitations on the pointing of the beam awayfrom target chamber center. Both of these methods were used, however they did not violate the NIFrequirements.5CONCLUSIONSAND LESSONS LEARNEDMany analysis tools for ghost identification and visualization have been used in the NIF Final OpticsAssembly.While limitations and complications exist that hinder the analysis efforts, this projectrepresents one of the most elaborate ghost analyses ever performed. By choosing parameters appropriatelyand post processing the ghost data high confidence is obtained in identifying and quantifying all major ghostpaths.There are many visualization tools to choose from and they are essential in highly complex systems such asthe NIF FOA. Mitigation tools are somewhat limited but are sufficient for most tasks. The biggesthindrance to mitigation is the uncertainty in laser damage thresholds of structural materials.One caution to users of diffractive elements is that the higher order, forward and backward, diffracted gratingorders must be included in the analysis. We found several hot ghost paths involving such grating orders andhave found orders that overlap at different wavelengths.One additional caution is that the use conditions of the system must be analyzed. An example from theNIF is that the system is required to point off target chamber center by several centimeters. The angularchanges to the beam and optics to accommodate that function greatly impacted the mitigation approaches inthe FOA.Motherhood on stray light: Important to evaluate threatening ghosts during the design phase. (It is generallymore cost efficient to identify damaging ghosts analytically rather than after the hardware is built.)
Anti-reflection coating performance drives ghosted stray light performance - must maintain good coatingperformance.Analytical tools:In the context of stray light analysis for pulsed lasers, the ideal software would have the followingcapabilities:1) display of volumetric stray light data2)user-friendly technique for modeling arbitrary holographic patterns over large surfaces3)fast evaluation of coherent fields (or faster computers)An integrated analysis tool would be most welcome in this type of work, however the pieces exist toadequately perform the required analysis at present. No doubt, the computer industry will enable this typeof analysis to be done more quickly and more efficiently in the future as well.6ACKNOWLEDGMENTSAll work performed in support of this research was funded by the U. S. Department of Energy andperformed by the University of California under Contract No. W-7405-Eng-48.f AlliedSignal Federal Manufacturing & Technologies is operated for the U. S. Department of Energy byAlliedSignal Inc. under Contract No. DE-AC04-76-DPOO613.* Lawrence Livermore National Laboratory is operated for the U. S. Department of Energy by the
The stray light or “ghost” analysis of the National Ignition Facility’ s (NIP) Final Optics Assembly (FOA) has proved to be one of the most complex ghost analyses ever attempted. The NIF FOA consists of a bundle of four beam lines that: 1) provides the va