Transcription
9th Interna onal Conference on Mass Customiza on andPersonaliza on – Community of Europe (MCP - CE 2020)community of europeRe-innova ng Business in the Digital EraSeptember 23-25, 2020, Novi Sad, SerbiaMULTI-LEVEL INFORMATION VALUESTREAM MAPPINGJeff Mangers, Lou Thoussaint, Meysam Minoufekr, Peter PlapperUniversity of Luxembourg, Faculty of Science, Technology and Medicine, Luxembourg City,LuxembourgAbstract: Digitalization and automation of theproduction according to Industry 4.0 opens newopportunities for companies to develop more efficientvalue chains. In the context of mass customization, it ispromising to examine more closely the complete internalvalue chain of companies, from the first customer contactto the delivery of the finished product, prior to providedigital configurations for customized products. A criticalaspect for internal inefficiencies and complication of anaspired automation are the interfaces of departments dueto inconsistent and non-uniform information transfer.This article presents a versatile approach to visualize theinternal information flow at inter-departmental level aswell as at intra-departmental level. The described multilevel information value stream mapping method perfectlysuits as prerequisite for a digitalization or automation ofinternal information flows. As framework for the timecapturing and visualization, ISO 22468 is used, and anindustrial use case exemplifies the research findings.Key Words: Value Stream Mapping, CompleteInternal Information Flow, Multi-Level, Digitalization,Automation, Visualization, Mass Customization1. INTRODUCTIONThe fundamental concepts in the field of leanmanagement are mainly connected to the introduction ofthe Toyota Production System (TPS) [1], later known asLean Production Systems (LPS), with a primary goal toreduce operating costs through eliminating all non-valueadding entities (waste/ muda) from the value chain of acompany. In LPS, the customer-centric aspects such asbest quality, short lead-time, and lower costs are keyfocus areas, which can be achieved through a set of toolsand methods (e.g. JIT, jidoka, ) that aim to minimizethe operating costs by reducing waste in productionprocesses [2]. Value stream mapping is one of the morecommon lean methods [3], which is used to develop thecurrent state visualization of product and informationflows within organizations and represents one step of theoverall value stream management (VSM) procedure [4].VSM is an effective, easy to use tool to collect,evaluate, and continuously improve product andinformation flows within companies in a common andstandardized manner [5]. The fundamental VSM concept147has been developed by Rother & Shook [6], and over theyears, a large variety of different VSM approaches weregenerated, leading to misunderstandings and conflictswithin supply networks [7]. A holistic methodology forthe assessment and subsequent optimization was neededto communicate in a standardized way throughoutcomplex supply chains [8]. ISO 22468 provides thenecessary guidelines for the application of VSM withregard to the collection, evaluation and continuousimprovement of value stream relevant data, applicable inmaterial-, energy- or data-related processes [4].Industry 4.0 (I4.0) is considered to be the 4thindustrial revolution, with as one common, technicaldefinition [9]: “Industry 4.0 is defined as digitization ofthe manufacturing sector, with embedded sensors invirtually all product components and manufacturingequipment, ubiquitous cyber-physical systems (CPS), andanalysis of all relevant data.” The increasing use ofInformation and Communication Technology (ICT) inthe manufacturing sector, mainly in reference with I4.0,brings new opportunities like the digitalization andautomation of processes or information flows. These newI4.0 requirements can be challenging for companies,mainly if over time different IT storing systems havebeen used. The result are wasteful actions which hinder aproper and digitized production [10].The multi-level information VSM introduced in thisarticle opens new possibilities to analyze and assess theinternal information flow in an end-to-end perspectiveprior to a pursued digitalization or automation. For thecase company this was important for an anticipatedreplacement of a manual configuration with an onlineconfiguration, mainly in regard of mass customization(MC). MC is defined as an organization’s ability toprovide customized products and services which fulfileach customer’s idiosyncratic needs without significantcompromises in cost, delivery and quality [11]. Theclassic VSM is used as a framework and extended tovisualize the different departments throughout theinternal value chain, the used software, the respectiveprocess- and idle time as well as the information flowand information order throughout the completeprocessing sequences. The visualization can beperformed at different levels, meaning at an inter(between more than one department) and at an intradepartmental level (within one department).
The following sections of this article are structured asfollow: First, a literature review concerning extendedVSM methods to capture the internal information flowmore in detail is done. Secondly, the methodology of themulti-level information flow VSM is elaborated beforeits application is shown by a use case study. Lastly, aconclusion to sum up the work is provided.2. LITERATURE REVIEWCountless articles exist on the application ofconventional VSM (material and information flow),which is widely used in the industry to assess valueadded and non-value added activities in operations [1],[3], [5], [7], [8], [10], [12]–[15]. An extensive review ofdifferent VSM applications can be found in [16]. Theaim of this section is to extend the literature review of[16] by examining the efforts conducted to extendconventional VSM to capture the internal informationflow and to briefly explain the procedure of ISO 22468.Thomas Meudt et al. [10] proposed an upgradedvalue stream mapping method for companies with anexisting Lean Production (LP)-System that needorientation on how to react to the new challenges raisedthrough I4.0. This new approach allows companies tosystematically understand opportunities offered bydigitalization and I4.0 to develop their lean productionapproach to the next level. In a conventional VSM, amaterial flow is always connected to an information flow(e.g. to schedule production, to evaluate performanceinformation) and used to depict the information flowbetween the production processes and the IT-systems.Here, the focus lies on improving the lead time of aproduct and not on depicting Information LogisticalWaste (ILW will be used in the following). InformationLogistics (IL) are understood as the planning,management, realization and control of the totality ofinformation flow as well as the storage and processing ofthis information. Especially, information flows ofdecision making are considered for IL. ILW is dividedinto three groups: data generation and transfer, dataprocessing and storage, and data utilization. In thisapproach, the objective is to analyze and visualize acurrent state of value streams in terms of material andespecially for information flows by depicting ILWs. Themethod is divided into six sequential steps. The first stepis the conduction of a classical value stream map to get ageneral understanding of the value stream. The secondstep is to list all the storage media, used for recoding ofdata points and KPIs. The third step is to connect datapoints, KPIs and all further locally collected data ofproduction and logistic processes with its storage mediathrough vertical lines and junctions. The fourth stepserves to determine the usage of data, so to check thepurpose of collecting data points/ KPIs. In the fifth step,the types of ILW for all processes and logistics elementsare collected. The last and sixth step is to rate potentialsand spheres of activity.Timo Busert et al. [13] developed a six-stagedprocedure to ensure sufficient information quality (IQ)for an efficient production planning and control (PPC),mainly in regard of the increasing informationavailability provided by I4.0. Many companies increasedtheir internal flexibility and accelerated their operationalprocesses by applying LP principles, like reduction ofwaste, a continuous improvement of processes, and achange in production control towards demand-orientedproduction. One problem here is, that LP was invented inthe 1950s and did not need to consider possibilities ofmodern ICT. For this reason, man LP principles havebeen exhausted in terms of their efficiency for the controlof operational processes. For the controlling ofoperational processes nowadays, LP and I4.0 canreinforce each other. The six-staged procedure aims topresent a conceptual framework based on the valuestream mapping method to systematically analyzeoperational processes, to develop concepts, and toharmonize the necessary information flows to controloperational processes. The first step consists of aclassical value stream analysis, to get a generalunderstanding of the value stream to identifyimprovement potentials, similar to the first step of [10].The second step is the concept development, where aconcept must be developed how to attain the identifiedproduction control Kaizen. The third step is themodelling of information flows, where the dataacquisition, transmission and the information processingis modelled. The fourth step is the harmonization of IQ,by determining information quality dimensions forexisting information flows and deriving requirements ofthe IQ dimensions. The fifth step is detailed planning andimplementation, by selecting information acquisition andtransmission tools, defining storage media and interfacesof IT-systems and a concept roll out. The last and sixthstep is the evaluation of the effectiveness of the conceptby evaluating the achievements of the defined targets andidentifying further improvement potentials.Nauman Bin Ali et al. [14] propose to combine valuestream analysis with FLOW, which is a methodologythat systematically captures and visualizes channels forinformation flow and allows the identification of suboptimal communication paths. The simple notation,ability to identify and visualize both documented andundocumented channels of information, make FLOW apractical and relevant complement for use in conjunctionwith VSM. The idea of this combined FLOW-assistedVSM is to first conduct a typical artifact flow analysisand secondly an information flow analysis done by theFLOW approach to overcome the limitations of existingVSM methods and notations. Through a case study itssuccess was proven in systematically uncovering issues,characterizing their solutions and indicating theirpractical usefulness for waste removal with a focus oninformation flow related issues. The FLOW-assistedVSM aims to improve the large-scale software productdevelopment process, mainly with the ability to capturecomplex information flows and identify improvementsopportunities during the development. The combinationof FLOW and VSM is an interesting approach tocompensate the weaknesses of both methods and thus beable to conduct a profound information flow analysis.Dagmar Piotr Tomanek et al. [17] developed aninnovative evaluation scale to classify information flowfollowing the added value. The collected data wasvisualized by using the Value Added Heat Map, which isa visualization tool that indicates the level value creation148
concerning production relevant factors. The informationflow is classified by the authors in six value added levelsfrom zero to five. The effort that is needed for theinformation exchange serves as scale for thecategorization. The higher the effort, the lower the valueadded level and vice versa. The first categorization (level0) is ‘No Added Value’ and means that the exchange ofinformation is insufficient, incorrect or unnecessary withmaximal effort. The second categorization (level 1 –level 4) is ‘Limited Added Value’ and means a written(level 1), verbal or visual (level 2), not real-timeelectronical (level 3) or real time electronical exchangeof information (level 4). The third and last categorization(level 5) is ‘Maximum Added Value’ and means a digitalexchange of real-time information with minimal effort.This method shows a possibility to visualize losses oftime through deficient or defective information.Further VSM applications which focus on theinformation flow can be found in [18]–[22].The different applications of VSM have beensummarized and standardized in the ISO 22468 [4],which is the first international standard for value streammanagement and has been published in march 2020. ISO22468 provides guidelines for the application of VSMwith regard to the collection, evaluation and continuousimprovement of value stream relevant data. A standardfor VSM was necessary due to the large variety ofdifferent VSM approaches since the 1990s. Mainly,communication and collaboration issues appeared duringthe application of VSM in practice due to different valuestream visualizations and associated calculationprocedures. These challenges mainly occur at theinterfaces of departments, corporate groups or entiresupply chains. The standardized VSM method ensures aunified collection, visualization and calculation of valuestreams within companies, corporations and along supplychains. The basic VSM procedure is divided into threemain phases: Value Stream Analysis Value Stream Design Value Stream Planning.Every main phase is divided into three fundamentalsteps and collectively they cover the PDCA-cycle.Beside a common procedure, the following commoncharacteristics are defined within ISO 22468: symbolsand terminology, parameters, calculation procedures anddata boxes.To sum up, this literature review has shown thatmany different approaches have been developed toanalyze the information flow more closely by means ofthe VSM method. It has been identified that mostresearch studies neglect the visualization and analysis ofthe complete internal information flow on different levelsand that no attempt was made in developing aprerequisite for an envisaged digitization or automationThe multi-level VSM approach described below willfocus on solving this problem statement.3. METHODOLOGYIn this section, the methodology of the multi-levelinformation VSM is described more in detail. First, the149intended field of application is stated secondly, the basicprocedure with its different steps is clarified.Conventional VSM is a useful technique applied toidentify opportunities for kaizen efforts (continuousimprovement) to eliminate waste in a system. The benefitlies in being able to visually present the state ofperformance of a production line or any other studiedsystem. To preserve its value as a useful and easy-to-usetool, these features must be maintained during theextension towards the multi-level information VSM.The objective of this method is to examine the entireinternal information flow from product enquiry throughthe customer to product dispatch to the customer assimple and clear as possible. A major difference betweenthe conventional and this multi-level information VSM isthat instead of the supplier symbol (left upper part), thecustomer symbol is illustrated twice (left and right upperpart). This is necessary, since this method only focuseson the information flow between the company and thecustomer, and not on the information flow between thecompany and its suppliers of raw material.The visualization can be done at different levels andcan be used as prerequisite for a later digitalization andautomation of internal information flows. Its main aim isto detect and localize inefficiencies and ILW [10]throughout the complete internal value chain.3.1. Field of applicationThe multi-level information VSM method isuniversally applicable but provides the most significantadded value for companies with a high density ofcomplex information exchange. This means that theinternal information flow goes through differentdepartments, who are using different software and arealways adding new additional information to the system.This is often the case for companies, which work with alot of individual orders (order-related individualproduction) and do not process standardized procedures(series production). In the complex environment ofindividual production, different individual tasks need tobe performed by different departments and thus ILWoften arises unconsciously since every department ismainly focused on its own tasks. If, a company wentthrough a rapid growth and steady expansion of itscompany size and product portfolio, its IT-systemprobably went through the same expansion. Thisnormally results in a high number of different operatingsystems (difficult to pass on information internally whichleads to information entanglement) instead of onecommon IT-system with interacting sub-systems. Theresult is a complication of the internal communicationdue to different software within each department.For companies with a high density of complexinformation exchange which are using many differentoperating systems, it is difficult to adapt to the needs ofI4.0 and keep up with the required digitalization andautomation. The multi-level information VSM should beapplied in the previous described field of application tosupport these companies with a method to easilyvisualize and understand their complex internalinformation flow and be used as prerequisite for a laterdigitalization and automation of internal informationflow processing. The different levels allow an in-depth
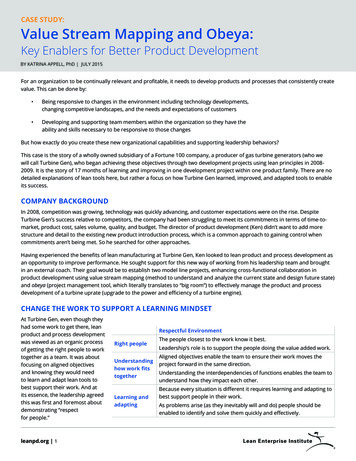
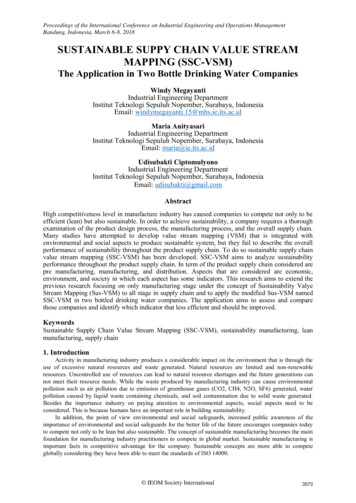
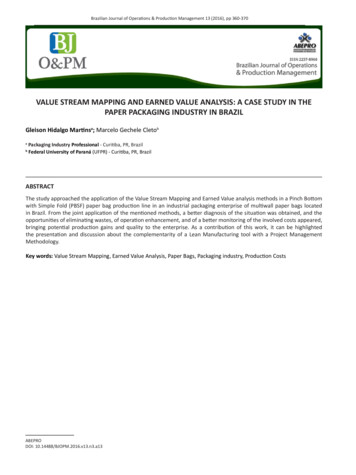
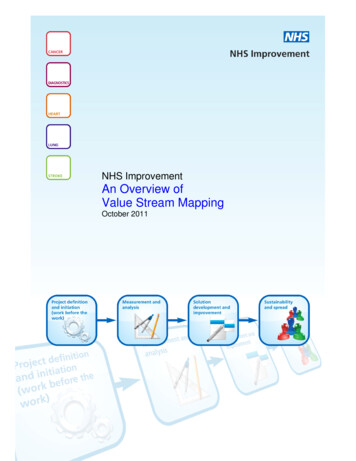
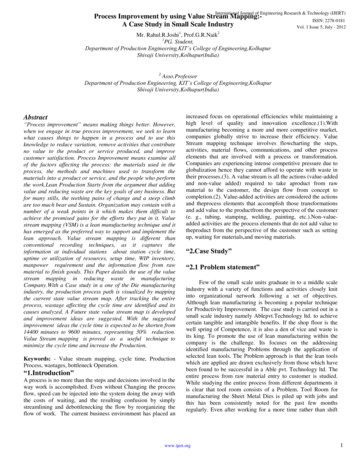
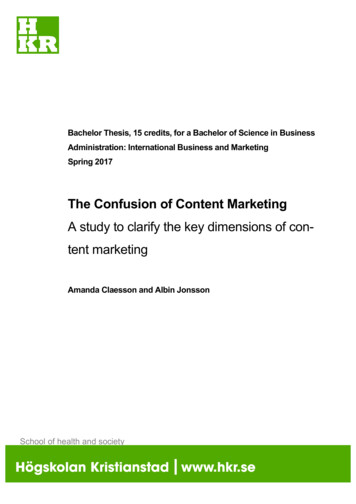
analysis of critical areas. Additionally, it can be used todetect ILW throughout the internal information flow.3.2. ProcedureIn the following, the basic procedure of the multilevel information flow is described. The procedure isdivided into the following five steps (figure 1) and isinspired by the PDCA-cycle [23].Fig. 1. Basic procedure of multi-level information VSMTo start with, it is important to get a generalunderstanding of the company’s structure with itsdifferent departments and work tasks. After this, astructured and standardized questionnaire should beestablished (Plan), which serves as help to acquire theinformation during the interviews. The next step is tovisualize the internal information flow throughout thedifferent departments with the respective software with avalue stream map (Do). The fourth step is discussing thevalue stream map with the internal project leader andlater verifying it for accuracy with all the questionedpeople (Check). The last step is a more in-depth analysisof the next level, so an intra-departmental analysis (Act).In the following, the different steps of the procedureare described more in detail.help. In the following, this person will be referred as'internal project leader'. Later, a chronologicalpresentation of all the departments that are part of theworkflow for the selected product family needs to belisted together with the internal project leader which isthe framework for the level 1 map.The internal level breakdown as well as thedifference between inter- and intra-departmental analysisis described hereinafter. The first level (level 1) is thebasis for all the following levels and is an interdepartmental (between more than one department)analysis of a company. At this level the differentdepartments (e.g. sales, scheduling, productionengineering, manufacturing, etc.), which are part of thework process for a specific product family are mappedand analyzed in a chronological order. The second level(level 2), is a breakdown of level 1 and thus is a more indepth analysis of a specific department. This departmentspecific analysis is referred to as intra-departmental(within one department) analysis of the different workprocesses (e.g. entering sales quote, retrieving customerinformation, etc.) within one specific department. Thethird level (level 3) is a breakdown of level 2 and thus isa more in-depth analysis of a specific work processwithin one department. Meaning, how does a workerperform a specific work task and how does the workergather the necessary information. This breakdown resultsin a pyramid-shaped figure (see figure 2), with on top thecompany under investigation at the second plane thedifferent departments (level 1), at the third plane theindividual processes of a specific department (level 2)and at the bottom plane the individual sub-processes of aspecific process (level 3). These levels are similar to thelevel breakdown into macro-, meso-, micro- and nanolevel [16] within the conventional VSM.3.2.1 General OverviewBefore starting with the actual work, it is important todefine the goal of the project and to choose a specificproduct family. The goal can either be to simply detectILWs or to visualize the complete information flowbefore starting with a digitalization or automation of theinternal information flow. In the second case, the multilevel VSM analysis is a prerequisite for a laterdigitalization or automation. After this, it is important toget a general overview of the company underinvestigation and understand the structure andfunctioning of the company. The internal jargon shouldalso be understood to avoid misunderstandings. In bothpoints an internal contact person who has a profoundknowledge of the company and its processes is a greatFig. 2. Level breakdown of multi-level information VSMIt is not necessary to further breakdown everydepartment into a level 2 or level 3 analysis. The extentto which the filtered level should be broken downdepends on the respective company and its respectivegoals. This way, the methodology can be adapted to the150
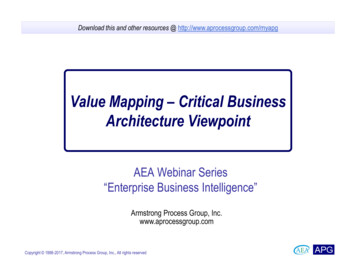
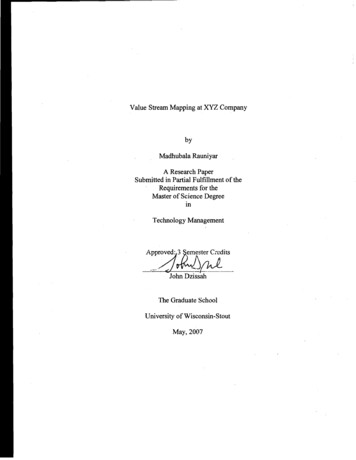
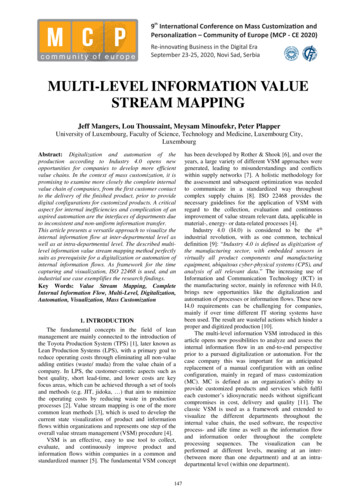
needs and go into as much detail as desired. Normally, itis only necessary to further analyze critical departmentswith a long process time, to detect weaknesses andbottlenecks of internal information flows.3.2.2 Questionnaire & InterviewA level-specific questionnaire is compiled, whichmakes it possible to document the information flow andthe corresponding IT-systems. It’s important that thequestionnaire is based on a few constructive questions inorder to not create an overabundance of unnecessaryinformation that is difficult to sort. The input and outputinformation flow as well as the processing time andsoftware information form a solid basis for the level 1questionnaire. An example of a level 1 questionnaire isshown in table 1. The level 2 questionnaire would relateto the main steps of the departments and the informationflows generated. However, it is advisable to approachlevel 2 only after completing the diagram for level 1.Table 1. Questionnaire Example – Level 1Level 1Department# Operators# SoftwareResponsible Person (SME)Product IdentificationPrimary Input (From/ What)Secondary Input (From/ What)Output (To/ What)Processing TimeWith the help of the internal project leader, oneperson per department should be selected who canprovide the necessary knowledge to answer thequestionnaire. This person should work in thisdepartment for a long time and be aware of therespective work steps. In this case, the person is referredto as Subject Matter Expert (SME). During the interviewthe SMEs of the different departments should providenecessary information to fill out the questionnaire and ifneeded they need to gather further information. Thequestionnaire only serves as a guide for the consultant tohelp focusing on the most important aspects. During theinterviews with the different SMEs, it is important tocoordinate/ match the information from the differentrespondent. Therefore, in the example questionnaireinput and output is mentioned. This means that theinformation from department A concerning their outputshould be matching with the information fromdepartment B concerning their input. After the interviewswith all the SMEs are finished, the received informationshould be analyzed together with the internal projectleader and if inconsistencies are detected, a second roundof interviews may be necessary.3.2.3 VisualizationWith the information gained from the interviews it ispossible to create the level 1 information value streammap, which is based on the ISO 22468 guidelines [4].The level 1 information value stream map is divided intofour main parts: Departments Software Information flow & - order TimelineFig. 3. Typical multi-level infomration VSM – Level 1151
Figure 3 illustrates the four parts in a typical multilevel information VSM and serves as visualizationexample. To start with, the different departments arelisted in a chronological order and gives a certainstructure. Additionally, on the upper left and upper rightside, the customer symbol is placed. In the conventionalVSM, a supplier symbol is placed on the upper left side.This is not necessary, since the multi-level informationflow analyses the information flow from a customerperspective (inquiry and acceptance). Beneath therespective departments, a data box with the informationfrom the questionnaire is added to summarize thegathered information. The second step is to list thedifferent software with its respective interfaces (markedin grey) above the departments. They replace theproduction planning and control symbol from theconventional VSM. The third step is to visualize thedifferent information flows with its respective order. Theinformation flow is either going from a department to asoftware (output department; input software) or theother way around, from a software to a specificdepartment (output software; input department). Thisis depending on the fact that either a department isuploading or downloading a certain information to orfrom a software. Each information flow (one specificinformation) is depicted as an arrow indicating thedirection of the information. Every information which istransferred between two departments without anyintermediate software, is depicted as direct arrowsunderneath the departments. The last step is to add thetimeline, with the respective process-, idle- and total leadtime. The process time is the amount of time which adepartment needs to fulfill its work task. Additionally,the processing time can be added in the data box toindicate how long the individual work tasks took, so theactively processed time. The idle time is the time whichpasses between department A finishes its work task anddepartment B starts processing with the following worktask and the lead time is the sum of the all process- andidle times. Table 2 summarizes the used symbols.3.2.4 ValidationAfter finishing the value stream map, it is importantto discuss it with the internal project leader to see if allthe needed information were taken or if some are stillmissing. To make sure that no misunderstandings or falseassumptions have been done, it is important to verify thevalue stream map for accuracy with all the SMEs. Ifnecessary, adjustments must be conducted before thevisualization of level 1 is finished. It is important tomake sure that the requirements set for the level 1information flow visualization have been met and that noinconsistencies are present.3.2.5 Further analysisThe last step of the first cycle is to analyze the valuestream map more in detail to detect waste (ILW), toidentify improvements possibilities and to see if a furtherbreakdown is necessary. This should first be doneseparately from the internal project leader (to notinfluence each other) and later during a workshoptogether with the internal project leader. If problems aredetected or if the available information is not clearenough to decide, a further breakdown should beconsidered in order to analyze a certain department morein detail.For a further breakdown, the same basic procedure,which is adapted to the needs of a level 2 or 3 analysisshould be applied.4. APPLICATION CASE STUDYTable 2. Summary of used symbols ustomer/supplier processprocessoperatorproductflowinformationflow1# informationflowrespective order of the information flowe.g. list, label, documentmanualonly applies for direct information exchange betweeninformation flowdepartments or between a company and its customere.g. telephone/fax, mail, EDIelectroniconly applies for direct information exchange betweeninformation flowdepartments or between a company and its er of operators responible for the tasks of a departmentposition in value stream diagram: within process symbolresourceprocesssoftwaredifferentiation: end customer (symbol customer process)vs. XYe r customer/plant (symbol external sources)if supplier also customer, use customer symboldefine resources for every process typein this case software the number of different software usedposition in value stream diagram: within process symbol(pre-)selection of process parameters, cf. data per processdata boxtypeposition in value stream diagram: within process symbolproduct flow controlled by upstream processesPUSH productin this case it is an indication that an actual product isflowforwardedcolored arrow indicates an information exchange (up- orinformation up- ordownload) between a department and a software. Everydownloaddepartment has its own color.processinformationflowAdditional informationindicates for level 1 the respective department and for level 2and 3 a certain processSoftware xsoftwareglobe symboldifferent software used by the departmentsindicates that a certain software is used by departments fromdifferent locationsTo validate the proposed model, a pilot case studywas conducted with a local supplier of manufacturingsolutions (hereinafter named case company), which isglobally active and has locations all over the world. Withemployees working in different countries and even ondifferent continents, a lean information flow and a wellstructured communication is important. Most of the casecompany’s products are tailored to the needs of thecustomer (build-to-order produ
processes [2]. Value stream mapping is one of the more common lean methods [3], which is used to develop the current state visualization of product and information flows within organizations and represents one step of the overall value stream management (VSM) procedu