Transcription
Fresh Produce Marketing Trendsand Issues for CaliforniaBlueberry GrowersbyDr. Roberta CookUniversity of California DavisDept. of Agricultural and ResourceEconomicsMay 2003UC Kearney Ag Center
Overview of Presentation US blueberry situation– Production– Trade– Consumption– Shipping seasons Marketing issues– Consolidation– Changing procurement patterns
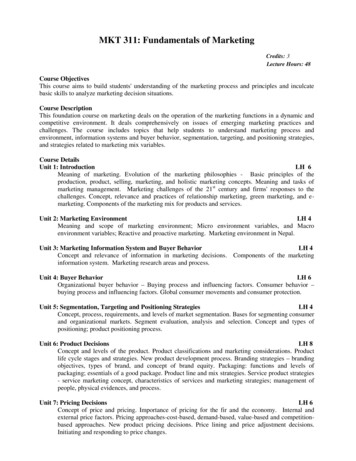
N. American Production of Blueberries, Freshand Processed, 1998-2002In 1000 8,809Lowbush*01998Source: US Highbush Blueberry CouncilHighbush1999200020012002*Production problems in Quebec caused one year decline in lowbush
Blueberry Industry Snapshot Production was about 250 million pounds in1991, including almost 150 million pounds forhighbush In 2002 57% of production was highbush, vs.64% in 1998 But 1998 was a low production year forlowbush (almost 50 million pounds normal) Almost all lowbush is sold frozen/processed,but some diversion to fresh based on marketconditions may occur Just under half of N. American production issold on the fresh market
Blueberry Industry Snapshot 2003 and beyond N. American total production isprojected to be around 450 million pounds (may beoverly optimistic) California produced 800,000 lbs. in 2001 and 2 millionin 2002, all fresh Ca. has a .9% share of the 2002 N. Americanhighbush production volume; about a 2% share offresh highbush production REMEMBER, THIS PUTS CA. IN A WEAK MARKETPOSITION RELATIVE TO MOST OTHER CROPS WEGROW HERE
U.S. Highbush Blueberry Production (1000 lbs.),Change ’98 to ‘02, and Selected State SharesStateMichigan/IndianaNew JerseyB. ColumbiaOregonN. 3,200Source: US Highbush Blueberry CouncilState Shares %029830181512766710028191812846410098-02% Change2811015987247921
U.S. Fresh Blueberry Production Rankings, by SelectedStates – FRESH VS. TOTAL PRODUCTION RANKINGSDIFFERStateRankingNew JerseyMichigan/IndianaB. ColumbiaN. ource: US Highbush Blueberry Council123456789 (production of 3.4 million pounds in 2001 and 2.1 in 2002)
Blueberry Shipping Seasons California’s May-June season overlaps with:––––––Fla., April to mid-JuneN. Carolina, May 10-July 1Georgia, May 25-July 10, but S. Georgia earlierArkansas, May 20-July 10New Jersey, June 10-Aug. 15Mich./Indiana and Wash./Oregon come in June 25;Mich ends Sept. 10 and goes thru Oct. with CA– ---------------------------------------– BC, July 15-Aug. 25– Chile, Nov. thru AprilCan Ca. also target a fall window?say yes, in the desert and the south coast)(some
Blueberry Pricing During California’s May-June season:– 16-18 for 4.4 oz. flats (3.5 lb. net cartonweight) right now – mid-May 2003– Next week when more S. Eastern volume comes onmay be down to 12– May prices generally range between 10-20/flat– Early June prices tend to be in the high teens for9-10 lb. pint flats (box size increases as volumesincrease)– As New Jersey comes in prices often get down to 12 by the third week of June– BUT, THESE PRICING LEVELS WILL DECLINE ASPRODUCTION GROWS!
Estimated 2003 Ca. BlueberryArea 818 commercial acres Additional area destined forFarmer’s Markets by small growers(Ca. has over 300 Farmer’sMarkets) Total area likely to be around 1000acres
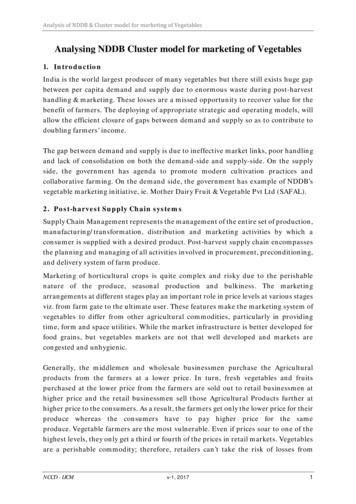
Fresh Blueberries: U.S.Highbush EstimatedFresh Production and High and Lowbush FreshImports & ExportsProductionThousand 20002002Sources:DOC,USHBCNote: 90% of US exports go to Canada, 9% to Japan
Fresh Strawberries: U.S. Fresh Production andFresh Imports & ExportsThousand 0,000640,000320,0000199820002001Source:USDA,ERS
Monthly US Imports of Fresh Blueberriesby Country of Origin in 2002250001000 PoundsURUGUAY20000NEW INA1 2 3 4 5 6 7 8 9 10 11 12Source: US DOC
Selected Blueberry Trends inSeasons Competing with Ca.– Central-North Florida: April 10 – May 15 window– Estimated additional 100 acres of high density to beplanted in next year or soApril 15 – May 15 window– South Georgia:– 2002 Estimated additional 400 acres of southern highbush was planted, 300 acres in high density–High density – 3-4000 plants/acre–Regular density – 1000 plants/acre– 2003 Some reluctance to continue planting due to theprice/return outlook for the long run– Projected 180,000 4.4 oz. flats in 2003, reaching 400,000in 2006Source: Industry Expert
US Per Capita Utilization of FreshStrawberries and 989900012002EEstimatedSources:USDA; Dr.Roberta Cook
US Per Capita Utilization of Fresh Pears, TableGrapes, Apples and rawberries4Pears2Source:0USDA76 78 80 82 84 86 88 90 92 94 96 98 00/ERS
ries, allFreshCanningFreezing19PoundsUS Per Capita Utilization of Cherries,by Product Form, 1977-2001Source: ERS, USDA
Ave. Item Number in the Ave. USFresh Produce Department400350300250200150100500Pma study:574 SKU’s in 2001350173Number of items19872001Source: SupermarketBusiness, Oct. 1999 andProgressive Grocer Oct. 2002
US PER CAPITA FRUIT CONSUMPTION,POUNDS 1977-2001Pounds per trus01977 1979 1981 1983 1985 1987 1989 1991 1993 1995 1997 1999 2001Total for 2001 reaches 279Source: USDA/ERS, Oct. 2002 including some berries and olives.
US Chains: Impact of RetailConsolidation on The BuyingProcess Multiple buying offices now merging intofewer or one– Purchase from shipper without seeing theproduct– More emphasis on standards, less on price– Synergy contract buying– More emphasis on forward planning– Buy more directly from shippersSources: PMA Fresh Track 2001; Cook and misc.
US Chains: Impact of RetailConsolidation on The Buying Process-Ahold – ending Division buying,centralizing to 2 or 3 preferredsuppliers chain wide-Safeway – centralizingmerchandising to Pleasanton, Ca.buying to Phoenix-Kroger – consolidating divisionsand centralizing buying to Cincinnati
Produce Business Model 1960 tomid-90s: “Distribution-BasedStrategy”Commodity ApproachUniform offers.Focus on foodads to boostshort-termsales, respondto inventoryissues.Relationshipselling.Fight for bestposition.Exploit seasonality.Retailer orWholesaler 12345 . 100Fax Machine MarketingSource: Adapted from The Perishables Group
New Produce Business Model, 1998 Suppliers12 KeyPartnerKeyPartnerKeyPartnerRetailers know thevalue of ads, space,location, etc.Expect suppliersto know consumers: Right product Right stores Right time Right price New Strategy--Cover BothTRADITIONAL “A” RETAILERSBid for orders.Buy ads, fight for space.Tactical approach.Source: Adapted from The Perishables GroupNEW MODEL “B” RETAILERSConsumer Information.Category Expertise.Category Development.
Sales mechanisms for eachmarketing channel –1994 & 1999 - %Grapes, oranges, grapefruit and CA/FL tomatoesAll1999Retail1994Retail1999MassMassMerch Merch19941999Sale TypeAll1994Daily Sales72585743207Advance Sale192430421923Sht-t. Contract71112114841Lng-t. Contract27141329Source: Economic Research Service, Produce Marketing Study Interviews 1999-2000
Types of Fees & Services RequestedSlottingEDIVolume RebatesDisplaysNon-volume RebatesPrivate LabelsPromotional AdsReturnable ContainersE-commerce feesSpecial PacksCapital ImprovementFood Safety Certification
Fees are increasing for all fresh produce butcommodities are still differentCommodities No slotting fees Other fees well under 2 percent of sales Volume incentives, promotional allowances andrebatesFresh-Cut All fees approximately 1 to 8 percent of sales Slotting fees, promotional allowances, volumeincentives, and rebates – firms offer options Can cost up to 2 million to acquire the business of anational chain; 500,000/division: stimulating PrivateLabels
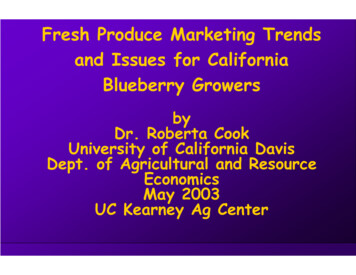
WHAT a DOLLAR SPENT for FOODPAID FOR Lin 2001intheUSAPBTPrab19 Farm value 19 rause- A Deacnsin Ottax dv prkapIn R es h eo r E n p e r ecorgita e ro tis iat R ter epa s ta r cngtio rg f in io en es ir x os-3-8n y its g n – t - t - s - es ts8 -4 -3 - -4.04 2 1 .0 .5 4.5 .0 3.5 .0 .5 .5 3.5 4.0 Marketing bill 81 Source: Howard Elitzak ERS/USDA
Building Retail Partnerships Roles and ResponsibilitiesRetailer/ Wholesaler Effective Tactics Shopper SavvyLoyalty CardBetter Systems Results-drivenTracking Focus Dept. Profitability Strategic ApproachGrower/Shipper Fact-based Selling InnovativeMarketing/Merchandising Efficient Practices “Category” vs.“Item” PerspectiveSource: Adapted from The Perishables GroupBoards/Commissions Category Development Best Practices Store-levelResearch Purchase Triggers Consumer Drivers Long view
Conclusions While retailer buying power is increasing,partly expressed in new demands for fees andservices, the huge physical volumes they nowprocure also make them even more dependenton shippers for stable, consistent yr-rd volumes This may limit the exercise of market power inthe fresh produce sector
CONCLUSIONS: The Future? More and more, large year-round growershippers may become the sourcingentities for retailers, procuring volumeabove and beyond their own viageographic diversification, includingimports. Smaller seasonal players will need to findniche markets. SELECT YOUR MARKETER WELL!!
Blueberry Industry Snapshot 2003 and beyond N. American total production is projected to be around 450 million pounds (may be overly optimistic) California produced 800,000 lbs. in 2001 and 2 million in 2002, all fresh Ca. has a .9% share of the 2002 N. American highbush production volume; about a 2% share of